“Inverted” CO molecules on NaCl(100): a quantum mechanical study
Shreya
Sinha
 and
Peter
Saalfrank
 *
*
Theoretical Chemistry, Institute of Chemistry, University of Potsdam, Karl-Liebknecht-Str. 24-25, 14476 Potsdam, Germany. E-mail: peter.saalfrank@uni-potsdam.de; Tel: +49 (0)331-977-5232
First published on 12th November 2020
Abstract
Somewhat surprisingly, inverted (“O-down”) CO adsorbates on NaCl(100) were recently observed experimentally after infrared vibrational excitation (Lau et al., Science, 2020, 367, 175–178). Here we characterize these species using periodic density functional theory and a quantum mechanical description of vibrations. We determine stationary points and minimum energy paths for CO inversion, for low (1/8 and 1/4 monolayers (ML)) and high (1 ML) coverages. Transition state theory is applied to estimate thermal rates for “C-down” to “O-down” isomerization and the reverse process. For the 1/4 ML p(1 × 1) structure, two-dimensional and three-dimensional potential energy surfaces and corresponding anharmonic vibrational eigenstates obtained from the time-independent nuclear Schrödinger equation are presented. We find (i) rather coverage-independent CO inversion energies (of about 0.08 eV or 8 kJ mol−1 per CO) and corresponding classical activation energies for “C-down” to “O-down” isomerization (of about 0.15 eV or 14 kJ mol−1 per CO); (ii) thermal isomerization rates at 22 K which are vanishingly small for the “C-down” to “O-down” isomerization but non-negligible for the back reaction; (iii) several “accidentally degenerate” pairs of eigenstates well below the barrier, each pair describing “C-down” to “O-down” localized states.
1 Introduction
Adsorbed molecules on alkali halide surfaces have previously served as models to study physisorption,1,2 two-dimensional phase transitions,3 vibrational relaxation,4 laser induced desorption5 and surface chemistry.6 In particular, CO on NaCl is a prototypical model in surface science, which continues to attract attention, not only for benchmarking quantum chemical methods,7 but also for practical reasons, one example being the use of vibrational signatures of CO as sensitive probes for unravelling processes in heterogeneous catalysis.8A plethora of studies have focused on understanding the interaction of adsorbed CO molecules with NaCl(100) – see ref. 1 for a review of theoretical approaches and an analysis of the bonding mechanism. It has been found that adsorption of CO on NaCl(100) generally yields a “C-down” configuration wherein the CO molecule preferentially adsorbs in an upright orientation on the NaCl surface. This upright phase, termed “parallel/upright” (P/U), can be found for all coverages up to one monolayer (ML), i.e., one CO per Na+ in the surface layer, when using periodic models and Density Functional Theory in the Generalized Gradient Approximation (DFT-GGA) including dispersion.7 Experimentally, at coverage = 1, the P/U phase is known to be stable above 35 K.9 Below this temperature, a p(1 × 1) P/U → p(2 × 1) T/A phase transition occurs,9 where “T/A” stands for “tilted/antiparallel”. This structure was also confirmed by theory to be the most stable monolayer phase of CO:NaCl(100) at very low temperatures.7,10,11 In ref. 7, using large elementary cells and/or cluster models, also some new, less stable configurations with irregular, spiral and antiparallel CO arrangements were predicted by DFT, for example T/I (“tilted/irregular”) and T/S (“tilted/spiral”) phases, at various coverages. In recent work by Guo, Meyer and their coworkers,12 for coverages = 1 and 1/4 also tilted minima were found, often more stable than the P/U ones, by periodic DFT calculations with various functionals, employing two-layer slab models.
CO at NaCl(100) also displays fascinating effects when excited with IR light. For example, mid-infrared laser excitation of CO molecules on NaCl results in “vibrational energy pooling”, where CO molecules efficiently transfer vibrational energy among themselves, according to a sequence CO(v = n) + CO(v = m) → CO(v = n + 1) + CO(v = m − 1),13 this way accumulating multiple quanta in one and the same molecule. Quite recently, this long known energy pooling was re-investigated by Wodtke and coworkers14via infrared (IR) emission, showing signals from vibrational levels as high as v = 27.
Another interesting finding of Wodtke and coworkers,15 is the “flipping” of adsorbed CO molecules on NaCl(100) using infrared laser excitation at a temperature of 7 K,15 from a “C-down” to an “O-down” configuration. This configuration was briefly mentioned for an isolated CO molecule adsorbed on a NaCl(100) slab already in an earlier theoretical work of Meredith et al..2 In ref. 15, the lifetime of the “O-down” isomer was found to be short for a single CO monolayer on the NaCl(100) surface exposed to vacuum, i.e., it isomerized back to “C-down” in <102 s. However, adding more (∼100) CO overlayers on the top of the monolayer resulted in the stabilization of the “O-down” isomer. Thermal annealing at 22 K converted this isomer to the normal “C-down” isomer. Further, experimental frequency shifts of +7.6 and −9.3 cm−1 with respect to the gas phase 13C18O molecule were observed for the “C-down” and “O-down” isomers, respectively.15 Thus, the “O-down” C–O frequency is red-shifted w.r.t. to “C-down”, by about 17 cm−1, indicating a change in the dipolar contributions to the interaction with the local electric field of the surface. The results were also interpreted as showing the “C-down” configuration for the vibrationally unexcited molecule (v = 0) being more stable than at v = 1, and the reverse being true for “O-down”. This conjecture was corroborated by the mentioned theoretical work of Guo, Meyer and coworkers,12 who observe a reversed energy order of the two isomers if the C–O vibration is excited, with the excitation modelled by an elongated C–O bond. The accompanying change in dipole moments and resulting frequency shifts, were argued to aid in the flipping of the CO adsorbates from “C-down” to “O-down”. Guo and coworkers12 also presented six-dimensional Potential Energy Surfaces (PES) for two coverages, 1 and 1/4 ML, for p(1 × 1) and p(2 × 2) unit cells. The PESs were based on neural networks, trained from Ab Initio Molecular Dynamics (AIMD), quasi-classical trajectories.
Despite this progress, further theoretical studies are needed to explore the isomerization of CO at CO:NaCl(100). It is the goal of the current paper to shed more light on this reaction, by emphasizing the quantum nature of the vibrations which has not been done so far. We will not only study systems for which the inversion of CO has already been demonstrated experimentally (notably the T/A one-monolayer phase), but low-coverage P/U phases with coverages 1/8 and 1/4 as well in order to exclude possible effects of explicit CO–CO interactions on isomerization and vibrations, and to facilitate analysis in this case. Specifically, independent of the work reported in ref. 12, we find and characterize the “O-down” isomer, for coverage = 1/4 (in a p(2 × 2) cell) for the P/U phase, and for coverage = 1 ML for the T/A phase (p(2 × 1)), by periodic DFT-GGA calculations with dispersion corrections. In addition, we study a low coverage limit, the coverage = 1/8 P/U phase, using a large unit cell. We also consider a possible double-isomerization of both molecules per cell in the p(2 × 1) T/A, coverage = 1 phase. Besides characterizing stationary points (educt, “C down”, product, “O down”, transition state), we also present minimum energy paths from reactants and products, again necessarily in part similar to what has been done in ref. 12. Transition state theory is used to estimate rates for “C down” → “O down” reactions and the backreaction, at various temperatures. In addition, we report global two- and three-dimensional potential energy surfaces for isomerization, which were further utilized to obtain vibrational eigenstates and eigenfunctions. These give insight not only into the anharmonically corrected, reaction and activation energies, but show also some interesting features: Of particular mention are sub-barrier vibrational “doublets” of both educt (“C-down”) and product (“O-down”) character, which could play a role during isomerization beyond pathways provided by the excitation of the C–O bond.
Our paper is organized as follows. Section 2 outlines methods and models used for characterizing interactions of CO with NaCl(100) and vibrational eigenstates. Section 3 presents results in different subsections dealing with energies and harmonic frequencies of stationary points, Minimum Energy Paths (MEPs), thermal isomerization rates, 2D and 3D PESs and, finally, anharmonic vibrational eigenstates. A final Section 4 summarizes this work.
2 Methods and models
2.1 Periodic DFT calculations and surface models
We use periodic DFT calculations to describe the electronic structure of CO adsorbed on NaCl(100). We adopted DFT in the GGA, using the Perdew Becke Ernzerhof functional PBE16 with Grimme's D2 dispersion correction17 as implemented in the Vienna Ab initio Simulation Package18–21 (VASP). The ion cores were described by the Projector Augmented Wave (PAW) method,22 and an energy cutoff of 700 eV was applied for the plane wave basis. The calculations were performed for Γ-centered k-point grids as shown in Table 1. The chosen electronic structure method was successfully validated in ref. 7 against other, also hybrid, functionals, and even highly accurate, correlated wavefunction methods. For cases where a comparison is possible, our results are quite close to ref. 12, where PBE was combined with other types of dispersion corrections. and
and  supercells, respectively. The notion used for the unit cells refers to multiples of the shortest Na–Cl distance. The PBE + D2 optimized lattice constants are reported in the last column
The NaCl(100) surface was modelled using three layer slabs and different supercells for different coverages as listed in Table 1. As shown in Appendix A, Table 6, the three-layer slab and chosen k-point grids were sufficient to converge adsorption energies of CO on NaCl(100) and energy differences between “C-down” and “O-down” isomers to within ∼1 meV. Further computational details are also described in Appendix A. The three different situations shown in Table 1 correspond to coverages 1/8 and 1/4 with one molecule per cell each, and coverage 1 with two molecules per cell, respectively.
First the slab models without CO were optimized, with details given in Appendix A. Afterwards, CO was added and the geometry relaxed, with all the layers of the NaCl slab except the top layer kept frozen. For all systems studied, stable “C-down” and meta-stable “O-down” configurations of CO were found when using initial “C-down” or “O-down” configurations on top of a Na+ ion, respectively. The optimized “C-down” configurations studied here are all of the “P/U” (parallel upright) type for coverages 1/8 and 1/4, and they correspond to the “T/A” configuration for the coverage = 1, p(2 × 1) structure. Minimum structures like those shown in Fig. 1 below were confirmed by Normal Mode Analysis (NMA) via occurrence of real frequencies only. Details of NMA calculation are described in Appendix B.
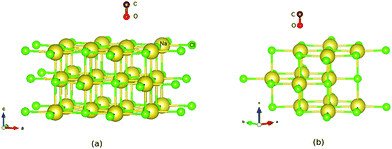 | ||
| Fig. 1 PBE + D2 optimized geometries of “O-down” CO molecules on NaCl(100) at coverages 1/8 (a) and 1/4 (b). The yellow and green balls represent Na and Cl ions respectively. | ||
For selected cases, we also performed AIMD calculations below, again on the PBE + D2 level, with trajectories determined in the canonical (NVT) ensemble at zero or at finite temperatures, in the latter case using a Nosé–Hoover thermostat.23
2.2 Minimum energy paths, transitions states, and thermal isomerization rates
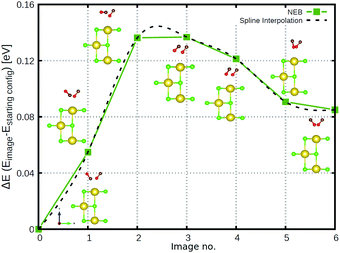
We also calculated minimum energy paths (MEPs) for the isomerization reaction from “C-down” to “O-down” and vice versa, using the Linear Transit Approximation (LTA) and (Climbing Image) Nudged Elastic Band method ((CI)NEB) as implemented in the Henkelmann VTSTtools24,25 package compiled with VASP. The MEPs were constructed for the 1/8 ML P/U and 1 ML T/A phases of CO:NaCl(100). Further, besides minima, we determined first-order transition states connecting the isomers, characterized by a single imaginary frequency. Computational details on LTA and CI-NEB calculations and on the transition state search are also described in Appendix B.The harmonic frequencies of adsorbed molecules (in frozen-surface approximation) obtained from NMA, were also used to evaluate zero-point energy corrections, thermodynamic quantities, and thermal isomerization rates. In the latter case, rate constants were evaluated using Eyring's transition state theory expression26
 | (1) |
2.3 Constructing potential energy surfaces
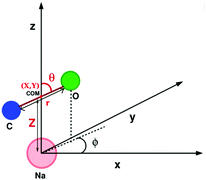
We also computed global, reduced-dimensional potential energy surfaces for the isomerization of a single CO molecule at NaCl(100) at coverage 1/4, within the static surface approximation. The single-CO/NaCl interaction potential is ideally a function of the well-known six dynamical Degrees Of Freedom (DOF) of a diatomic molecule at a rigid surface: its center of mass (X,Y,Z), the molecular bond length, r, the polar angle between molecular axis and surface normal, θ ∈ [0,π] and the azimuthal angle obtained by projecting the molecular axis on the surface plane, ϕ ∈ [0,2π], as represented in Fig. 10 of Appendix C. Here we assume that the center of mass of the molecule is fixed on top of a Na+ ion, which results in X = Y = 0 and eliminates X,Y as dynamical adsorbate DOFs, reducing the six-dimensional (6D) problem to 4D. We further neglect the dependence of the potential energy on the azimuthal angle, ϕ. This is reasonable as we observe only a weak dependence of the isomerization energy barrier on ϕ (see below). Further, in a first version of PES construction, we consider the CO molecule as a rigid rotor by fixing the C–O distance at a value of r = 1.141 Å (the optimized bond length of the “C-down” configuration). We then calculated the PBE + D2 energies at an equidistant 2D grid with NZ × Nθ = 38 × 61 = 2318 points with ΔZ = 0.1 Å and Δθ = 3°, giving a smooth 2D PES V(Z, θ) after a 2D cubic spline of the DFT points. This was done for four azimuthal angles, ϕ = 45°, 90°, 135°, 0°, representing different planes of rotation of the CO molecule (see below).Also, a 3D PES V(r, Z, θ) was constructed by including the r coordinate as a dynamical DOF, on a less densely sampled grid with Nr × Nθ × NZ = 14 × 61 × 38 = 32![[thin space (1/6-em)]](https://www.rsc.org/images/entities/char_2009.gif) 452 DFT points. A smooth potential was constructed from subsequent 2D and 1D cubic splines as
452 DFT points. A smooth potential was constructed from subsequent 2D and 1D cubic splines as  , where θGL represent the Gauss–Legendre roots which were used in this case to make the evaluation of Hamiltonian matrix elements easier (see below). A table (Table 7) with details of the chosen 2D and 3D grids is given in Appendix C, along with other information on PES generation. For the 3D study, the C–O bond length was allowed to vary between 0.9763 Å and 1.3338 Å where the latter is slightly larger than the outer classical turning point of an anharmonic oscillator along r at an energy corresponding to a vibrationally excited CO molecule (vr = 7) on NaCl(100).
2.4 Calculation of vibrational eigenfunctions
With smooth potentials, V(Z, θ) and V(r, Z, θ) for our 1/4 ML CO:NaCl(100) system at hand, we proceed to compute vibrational eigenstates, via time-independent, nuclear Schrödinger equations. In the 2D case, we use a translating, rigid-rotor nuclear Hamiltonian of the form | (2) |
 being the reduced mass of CO and req the fixed CO bond length. (Note that in this case, θ ∈ [−π,π].) In eqn (2), the parametric dependence of the potential energy surface on r, ϕ, X and Y is indicated. For both coordinates the Fourier Grid Hamiltonian (FGH)28 method was used, with details specified in Appendix C. Using NZ × Nθ = 100 × 200 = 20
![[thin space (1/6-em)]](https://www.rsc.org/images/entities/char_2009.gif) 000 grid points, a Hamiltonian matrix of size 20
000 grid points, a Hamiltonian matrix of size 20![[thin space (1/6-em)]](https://www.rsc.org/images/entities/char_2009.gif) 000 × 20
000 × 20![[thin space (1/6-em)]](https://www.rsc.org/images/entities/char_2009.gif) 000 was obtained which was directly diagonalized, resulting in eigenstates ψn(Z, θ) and energies En. The index n enumerates different states, which (at least for low-lying states) can be classified according to their localization behaviour (e.g., “C-down”, “O-down”) and node structure (see below).
000 was obtained which was directly diagonalized, resulting in eigenstates ψn(Z, θ) and energies En. The index n enumerates different states, which (at least for low-lying states) can be classified according to their localization behaviour (e.g., “C-down”, “O-down”) and node structure (see below).
Similarly, a 3D system Hamiltonian was considered with
 | (3) |
 is the angular momentum operator without ϕ dependence, and θ ∈ (0,π). Due to a larger potential grid in the 3D case, we resort to the Block Improved Relaxation (BIR) method as implemented in the Heidelberg Multi Configurational Time Dependent Hartree (MCTDH) package29 instead of direct diagonalization. A few details of the BIR-MCTDH calculations are presented in Appendix D, and some of the eigenstates obtained in this way below.
3 Results and discussion
3.1 Stationary points: geometries, energies, harmonic frequencies and thermal isomerization rates
In Table 2, for the three stationary points and each of the two coverages, adsorption energies, geometrical parameters and also vibrational frequencies obtained from NMA are listed.
 model for coverage = 1/4, with one CO molecule per cell each
| Coverage | State | ΔE (with ZPE) (meV) | r (Å) | Z (Å) | θ (°) | Frequencies (cm−1) | ||
|---|---|---|---|---|---|---|---|---|
| 1/8 | C | 0.00 | 1.141 | 3.329 | 0.3 | 2136.1 | 152.2 | 151.7 |
| 106.9 | 44.9 | 26.9 | ||||||
| O | 77.3 (62.0) | 1.143 | 3.112 | 179.7 | 2121.6 | 75.0 | 74.4 | |
| 71.6 | 15.5 | 14.5 | ||||||
| TS | 139.2 (114.5) | 1.143 | 3.470 | 77.9 | 2117.2 | 43.1 | 27.2 | |
| 25.4 | 7.4 | 70.2(i) | ||||||
| 1/4 | C | 0.00 | 1.141 | 3.330 | 0.3 | 2134.0 | 152.9 | 150.6 |
| 89.8 | 43.9 | 28.4 | ||||||
| O | 76.0 (64.0) | 1.143 | 3.102 | 179.0 | 2122.1 | 75.3 | 80.6 | |
| 88.0 | 22.4 | 17.1 | ||||||
| TS | 147.2 (117.0) | 1.143 | 3.529 | 77.7 | 2122.5 | 47.6 | 32.5 | |
| 26.5 | 11.4 | 68.2(i) | ||||||
Concerning energies w.r.t. to the most stable configurations (“C-down”) first, we note that the “O-down” configuration is destabilized by 77.3 meV for coverage 1/8 and 76.0 meV for coverage 1/4. From here it appears already that coverage effects are minor, in the studied (low) coverage-regime at least. Transition states are higher in energy than “C-down”, by 139.2 meV and 147.2 meV for coverages = 1/8 and 1/4, respectively. Note that both “O-down” and also the transition states are still bound w.r.t. to desorption of CO: The adsorption energy of CO in the “C-down” configuration for coverage = 1/8, is close to 183 meV on the PBE + D2 level of theory with the chosen setup (Table 6 in Appendix A). Note also that the energy differences between “C-down” and “O-down”, and also the barriers for “C-down” to “O-down” (and vice versa), become slightly lower with zero-point energy (ZPE) corrections. The effect on barriers, for example, is a lowering to 114 meV and 117 meV for coverages 1/8 and 1/4, respectively.
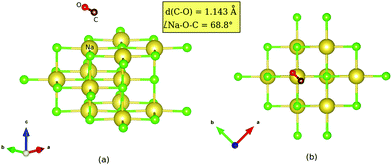
Upon inversion, besides θ, also other geometry parameters are affected. For both coverages 1/8 and 1/4, the changes for “O-down” and the transition state are very similar. At coverage = 1/8, for example, for “O-down” Z = 3.112 Å and r = 1.143 Å compared to the “C-down” values Z = 3.329 Å and r = 1.141 Å, i.e., the molecule shifts a bit towards the surface. The geometry of the transition states for coverage = 1/8 is also similar to that at coverage = 1/4, the latter shown in Fig. 2(b). From there we also note that in the transition state, the molecule orients along the vector, corresponding to an azimuthal angle ϕ = 90°.
From the dynamical matrix eigenvectors and previous literature,6 we can assign the normal frequencies for the “C-down” configuration, shown in Table 2, to the following vibrations: the highest frequency (2134 cm−1 for coverage = 1/4) is the C–O internal stretch mode. (For a free CO molecule, treated by the same method (PBE + D2, periodic), the harmonic frequency is 2124 cm−1.7) Further, the two modes around 150 cm−1 are the frustrated rotational modes, the surface-molecule Z mode is around 90 cm−1, and frustrated translational modes are below 45 cm−1. The internal C–O stretch mode for the O-oriented CO on NaCl(100) is red-shifted by ∼12 cm−1 in the harmonic approximation compared to “C-down”, for this coverage, and ∼15 cm−1 for coverage = 1/8. Nearly all other modes of the O-oriented species are drastically red-shifted (∼nearly half) compared to the modes of the “C-down” species. This is in line with the experimental red-shift found in ref. 15 (of ∼17 cm−1, for another isotope and coverage, see above).
Another connection to experiment comes from isomerization rates computed from transition state theory, eqn (1). For coverage 1/4, for example, we find rates k1 for the “C-down” to “O-down” reaction, of zero at T = 7 K and 2 × 10⁻¹⁷ s−1 at T = 22 K, i.e., no thermal reaction will happen at these temperatures. The rate constant k2 for the backreaction from “O-down” to “C-down”, on the other hand, is still negligibly small at T = 7 K (∼10−33 s−1), but ∼7 × 10⁻³ s−1 at T = 22 K, suggesting an “O-down” lifetime of about two minutes. This is to be compared to the lifetime of <102 s for a single CO monolayer on the NaCl(100) surface.15 Our calculations (with PBE + D2 barriers are typically too low, though30) suggest that indeed, “O-down” CO on NaCl(100) can isomerize back at comparatively low temperatures and not too high coverages, on timescales comparable to experiment. To corroborate this, we also performed single trajectory NVT-AIMD calculations at T = 22 K, starting from a stretched CO (r = 1.5 Å), with the “C-down” and “O-down” configurations, independently. In the “C-down” starting configuration trajectory, we observe besides motion along r, oscillations of the CO molecule along θ, but still occupying the site above the Na+ ion with the C-end down. In contrast to this, the “O-down” CO molecule oscillates and moves away from the surface (Z ∼ 4 Å), simultaneously rotating and diffusing to the nearest neighbour Na+ ion along the b direction and eventually adopting a slightly tilted “C-down” configuration. The possible role of diffusion in the isomerization is beyond the scope of this work and will be investigated in the future.
 supercell (corresponding to p(2 × 1)) with PBE + D2. Besides, structures were optimized with one (Fig. 3(b)) and two inverted CO molecules (Fig. 3(c)). Corresponding energies, selected geometric variables and (twelve, for two CO molecules) normal mode frequencies are listed in Table 3.
 supercell was used with two CO molecules per cell
| Cov. | State | ΔE (meV) | r 1 (Å) | Z 1 (Å) | θ 1 (°) | r 2 (Å) | Z 2 (Å) | θ 2 (°) | Frequencies (cm−1) | ||
|---|---|---|---|---|---|---|---|---|---|---|---|
| 2126.3 | 2120.9 | 167.7 | |||||||||
| 1 | CC | 0.00 | 1.142 | 3.03 | 35.9 | 1.142 | 3.05 | 34.6 | 164.6 | 162.5 | 157.7 |
| 92.6 | 87.8 | 57.3 | |||||||||
| 47.9 | 45.3 | 19.3 | |||||||||
| 2123.2 | 2107.2 | 166.9 | |||||||||
| 1 | OC | 84.4 | 1.143 | 3.09 | 143.9 | 1.142 | 3.05 | 34.8 | 162.4 | 94.7 | 88.5 |
| 83.5 | 68.6 | 53.6 | |||||||||
| 38.0 | 16.7 | 6.5 | |||||||||
| 2113.5 | 2112.5 | 78.8 | |||||||||
| 1 | OO | 163.1 | 1.144 | 3.01 | 131.9 | 1.144 | 3.19 | 142.2 | 70.3 | 63.1 | 60.7 |
| 56.6 | 45.3 | 22.6 | |||||||||
| 12.7 | 7.9 | 28.7(i) | |||||||||
From the table we note that it costs 84.4 meV to invert one CO molecule, and 163.1 meV to switch both. The inversion energy per CO molecule of ca. +84 meV is quite similar to the lower-coverage situations. We further see that for “OO”, i.e., a monolayer with all molecules flipped, an imaginary frequency appears in NMA, indicating that the found minimum is not very stable. In order to check the “all-switch” configuration, we performed single-trajectory NVT-AIMD calculations at T = 7 K and at T = 22 K, respectively, starting from the configuration shown in Fig. 3(c). As a result, this configuration remained stable (“OO”) at T = 7 K but started to oscillate with one of the CO molecules adopting an almost parallel configuration w.r.t the surface (going towards “OC”) at T = 22 K, suggesting that the “all-switch” configuration is indeed unstable at finite temperatures.
For geometries of optimized structures we note from Table 3 the same trends as those observed for inversion of upright CO molecules at lower coverages. Note that in the coverage = 1 T/A case, the antiparallel tilting of the two molecules remains qualitatively preserved under switching. Quantitatively, we observe that inverting one/both CO molecules, causes the tilt angle (Na–O(C)–C(O)) to reduce from 162° to ≈150°.
Considering the harmonic (NMA) frequencies in Table 3, we observe two C–O stretch modes, as a result of Davydov splitting due to the presence of two orientationally non-equivalent, adsorbed CO molecules (anti-parallel orientation) per unit cell. The Davydov splitting, Δωs for the pragmatic “C-down” configuration is found to be ≈5 cm−1, which is in close agreement to experiment and previous theory.7 From the dynamical matrix eigenvectors, we can verify that the slightly higher energy mode (2126 cm−1) belongs to the in-phase vibrations of the C–O bonds of the two CO molecules and the other mode (2121 cm−1) belongs to the out-of-phase vibration. For the “OO” configuration, the splitting reduces to nearly 1 cm−1, and for the “OC” configuration, it increases to 16 cm−1, pointing to changes in dipole–dipole interactions in the different configurations. Note that when going from “CC” to “OC” and further to “OO”, the C–O vibrations are also red-shifted similar to the low-coverage cases, by 8 and 13 cm−1 for the two modes when comparing “OO” with “CC”. Also other modes like the molecule-surface stretch mode are split as can be seen from the table. Upon switching, these modes can be very strongly red-shifted (compare “OO” with “CC” frequencies).
For the T/A model, we only found second-order and no first-order transition states for the inversion reactions so far. We also do not report a potential energy scan for T/A phase but will present a minimum energy path from the “CC” configuration to “OC”, where only one CO molecule undergoes isomerization, in the next section.
We close this section by making a connection to the recent theoretical work of Guo, Meyer and coworkers,12 who considered various coverage = 1/4 and coverage = 1 phases of CO:NaCl(100). In all cases they found very similar trends upon inversion as those reported here. For example, using a two-layer slab model and the so-called PBE-MBD functional (with another form of dispersion correction), for the inversion of an initially upright CO molecule and coverage = 1/4, they found an inversion energy to “O-down” of 73.7 meV, compared to our 76.0 meV. For the p(2 × 1) T/A model, coverage = 1, they found an energy difference between the lowest-energy “all C-down” and “one O-down, one C-down” structures of 75.1 meV, compared to our 84.4 meV. They also found frequency shifts of the C–O vibrations upon CO inversion in the order of magnitude as we do. Transition states for inversion were not optimized in ref. 12, however, from their computed potential energy surfaces and MEPs, activation energies can be estimated. For example, for coverage = 1/4, the activation energy for inversion reaction from the “C-down” side, was around 135 meV in rigid-surface approximation with PBE-MBD, compared to our 147 meV.
3.2 Energy pathways and potential energy surfaces
 supercell, giving an “all O-down” configuration.
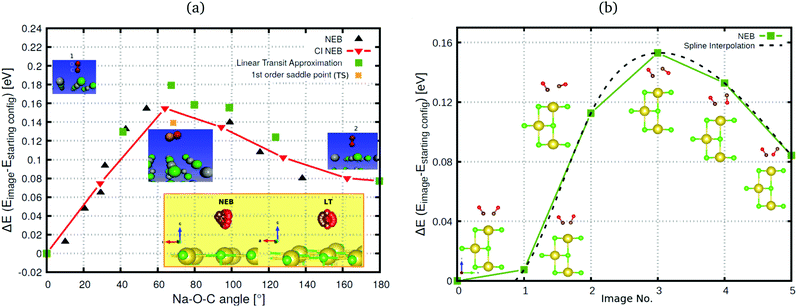
In Fig. 4(a) we also indicate, for coverage = 1/8, the transition state (“1st order saddle point”) obtained from an improved DIMER calculation, with an activation energy of 139.2 meV. This value is similar to the one for the TS at coverage 1/4, which had been depicted above in Fig. 2, and also the geometry is similar (not shown). From Fig. 4(a), it is seen that the LT overestimates the reaction barrier as expected, whereas the CI-NEB and NEB maxima come close to the true transition state. As mentioned above, for the coverage = 1 T/A phase, we found no first-order saddle point so far. Fig. 4(b), however, suggests on the basis of NEB calculations a barrier very close to the low-coverage case(s). For switching of the second CO molecule of the coverage = 1 T/A phase, a MEP similar to the one of Fig. 4(b) is found according to Fig. 9, Appendix B, however, with somewhat different energetics: switching of the second molecule seems slightly facilitated energetically.
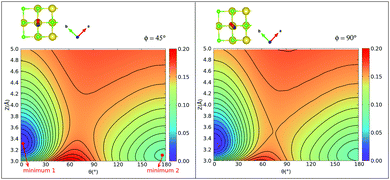
Considering the case ϕ = 90° first (Fig. 5(b)), we note the “C-down” and “O-down” minima, separated as closer inspection shows, by 76 meV in accordance with Table 2. The transition state in between is 150 meV higher than “C-down”, also in good agreement with Table 2. A general observation is that the PES topology and also energies are not very sensitive to the plane of rotation of the CO molecule, provided the CO bond length and position of center of mass of the CO molecule are kept fixed. A slightly higher activation energy (155 meV) is found for ϕ = 45°. We further note that the transition paths for crossing from minimum 1 (“C-down”) to minimum 2 (“O-down”) in the 2D cuts appears quite flat (uncorrugated), indicated by a larger distance between the contour lines along Z in the transition state regions. In a region of Z between 3.4 to about 4.2 Å (and θ ∈ [70°,90°]), the energy variation is less than 10 meV for ϕ = 45°, for example.
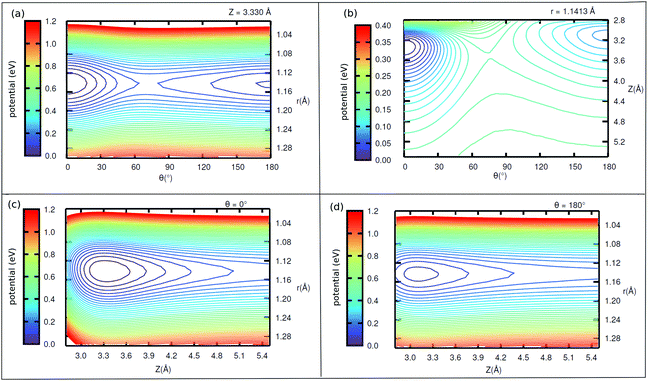
Further, in Fig. 11 (Appendix C), we show 2D potential energy cuts V(r, Z, θ) at two other r values, corresponding to a compressed C–O bond (r = 1.1138 Å) and an elongated one (r = 1.2513 Å). The energy difference between the “C-down” and “O-down” isomers changes, adopting a higher value of ≈84 meV for the contracted C–O bond and a lower value of ≈57 meV for the stretched C–O bond (i.e., close to the CO(vr = 1) outer classical turning point). This observation is in line with results of Guo and coworkers,12 who observe a reversal in energy order of the two isomers with increasing vibrational excitation of the C–O bond, which was modelled by C–O bond stretching.
3.3 Vibrational eigenstates
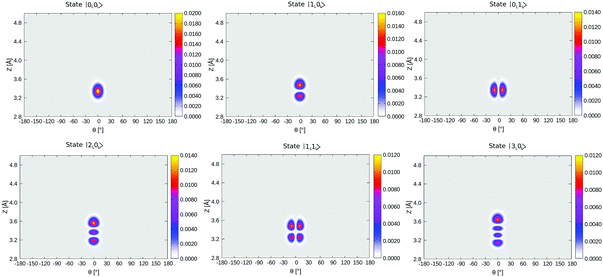
In Table 4, selected eigenstates are listed and classified as |mL/R,nL/R〉, where m is the Z quantum number and n is the θ quantum number and L/R stands for the wavefunctions which are either localized to “left” (“C-down”) or “right” (“O-down”) wells. The distinction between left/right disappears in the case of higher vibrational states, which are typically delocalized and denoted in the table as such. The vibrational energies in Table 4 are reported in wavenumbers, relative to the zero point energy of the ground state, which is ≈0.015 eV (119 cm−1). We also show probability densities of the lowest six vibrational states in Fig. 12 in Appendix E. The figure illustrates that these states are all localized in the left well, “C-down”, and can be nicely classified according to their node structure.
| State | Classification | Energy [cm−1] | State | Classification [cm−1] | Energy |
|---|---|---|---|---|---|
| 0 | |0L,0L〉 | 0.0 | 31 | |5L,2L〉 | 660.4 |
| 1 | |1L,0L〉 | 92.7 | 32 | |2L,4L〉 | 669.6 |
| 2 | |0L,1L〉 | 137.2 | 33 | |7L,1L〉 | 680.9 |
| 3 | |2L,0L〉 | 181.4 | 34 | |0R,2R〉 | 683.8 |
| 4 | |1L,1L〉 | 227.3 | 35 | |8L,0L〉 | 694.3 |
| 5 | |3L,0L〉 | 266.1 | 36 | |1R,1R〉 | 696.2 |
| 6 | |0L,2L〉 | 268.4 | 37 | — | 701.3 |
| 7 | |2L,1L〉 | 313.1 | 38 | — | 704.0 |
| 8 | |4L,0L〉 | 346.9 | 39 | |2R,0R〉 | 704.5 |
| 9 | |1L,2L〉 | 355.7 | 40 | |6L,2L〉 | 726.2 |
| 10 | |3L,1L〉 | 393.8 | 41 | |0L,6L〉 | 730.8 |
| 11 | |0L,3L〉 | 394.8 | 42 | |0R,2R〉 | 736.4 |
| 12 | |5L,0L〉 | 423.8 | 45 | |1R,2R〉 | 750.4 |
| 13 | |2L,2L〉 | 438.5 | 47 | |2R,1R〉 | 760.6 |
| 14 | |4L,1L〉 | 472.1 | 48 | |3R,0R〉 | 766.5 |
| 15 | |1L,3L〉 | 478.2 | 49 | |5L,3L〉 | 768.1 |
| 16 | |6L,0L〉 | 496.9 | 50 | |2L,5L〉 | 774.9 |
| 17 | |0L,4L〉 | 512.8 | 56 | — | 807.6 |
| 18 | |3L,2L〉 | 516.7 | 57 | — | 808.7 |
| 19 | |5L,1L〉 | 545.6 | 65 | |8L,2L〉 | 846.3 |
| 20 | |2L,3L〉 | 557.6 | 66 | |1R,4R〉 | 846.4 |
| 21 | |0R,0R〉 | 566.1 | 89 | |5R,1R〉 | 928.2 |
| 22 | |7L,0L〉 | 566.3 | 90 | — | 928.3 |
| 23 | |4L,2L〉 | 590.4 | 166 | Delocalized | 1098.6 |
| 24 | |1L,4L〉 | 594.0 | 170 | Delocalized | 1103.9 |
| 25 | |6L,1L〉 | 615.1 | 172 | Delocalized | 1108.0 |
| 26 | |1L,5L〉 | 625.5 | 173 | |5R,6R〉 | 1110.3 |
| 27 | |0R,1R〉 | 626.9 | 174 | — | 1110.9 |
| 28 | |8L,0L〉 | 632.1 | 175 | Delocalized | 1114.4 |
| 29 | |3L,3L〉 | 632.3 | 176 | Delocalized | 1115.0 |
| 30 | |1R,0R〉 | 637.8 | 177 | — | 1115.1 |
From Fig. 12 and Table 4, we note that above the nodeless, left-localized ground state |0L,0L〉 the first vibrationally excited state has a relative energy of 11.5 meV (93 cm−1) and corresponds to the surface-molecule “external stretching vibration” of CO:NaCl(100), |1L,0L〉, slightly higher in energy than the harmonic value of 90 cm−1 obtained from NMA (Table 2). The third excited state in Table 4 is |2L,0L〉 at 181 cm−1, red-shifted by 5 cm−1 w.r.t. to an ideal, harmonic progression of 2 × 93 = 186 cm−1 which is a signature of anharmonicity. In between, the second vibrationally excited state 2, with a relative energy of 17.0 meV (137 cm−1), corresponds to a “θ-excited state” |0L,1L〉, to be roughly compared with the ∼150 cm−1 normal mode vibrational frequencies of the frustrated θ/ϕ rotational motions in Table 2. The doubly θ-excited state |0L,2L〉 appears at 268 cm−1, also red-shifted w.r.t. to an ideal, harmonic progression of 2 × 137 = 274 cm−1.
A similar analysis can be done for the corresponding lowest, right-localized (“O-down”) states, highlighted in Table 4 in bold and depicted in Fig. 13 in Appendix E. We find the first right-well, nodeless state |0R,0R〉, at energy 566 cm−1, i.e., 70.1 meV above the vibrational ground state, which corresponds nearly to the energy difference between the “C-down” and “O-down” of ∼75 meV. The second and third right-well localized states are “θ-excited” and “Z-excited” states |0R,1R〉 and |1R,0R〉, at relative energies of 7.5 meV (61 cm−1) and 8.8 meV (72 cm−1) above |0R,0R〉, respectively. The corresponding harmonic values are 75/81 cm−1 for the frustrated rotation(s) and 88 cm−1 for the Z-mode – see Table 2.
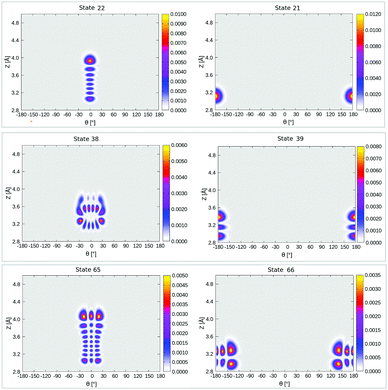
Interestingly, when looking at the eigenenergies obtained from direct diagonalization of the 2D Hamiltonian listed in Table 4, we find some pairs of “accidentally degenerate” eigenstates, which are degenerate up to three significant digits. Examples are pairs with state numbers 21/22 (at an energy ∼566 cm−1 above the ground state), and states 38/39 (at energy ∼704 cm−1). Fig. 7 showcases three pairs of these nearly degenerate eigenstates, each pair comprising of a left-well and a right-well state. For example, the lowest near-degenerate pair (states 21/22) is |0R,0R〉/|7L,0L〉, and the third pair shown in the figure comprising states 65/66 is |8L,2L〉/|1R,4R〉. Both pairs are (like other quasi-degenerate pairs) well below the classical barrier, which is ca. 1185 cm−1 above the potential minimum, or at ca. 1065 cm−1 above the ground state |0L,0L〉. The question if these pairs can play a role in isomerization cannot be answered by the present time-independent calculations in reduced dimensions and is reserved for future work.
Now coming to even higher vibrationally excited eigenstates, with energies above the barrier, we observe that these states are mostly delocalized over θ ∈ [−π,π] and Z ∈ [3.0,4.2] Å. A pictorial representation of some of the states is given in Fig. 14 of Appendix E. The lowest of these delocalized states is excited state 166 in Table 4 occurring at 1098.6 cm−1, slightly above the (ZPE-corrected) isomerization barrier (1065 cm−1). As shown in Fig. 14, this and higher states have a complicated node structure along Z and θ coordinates.
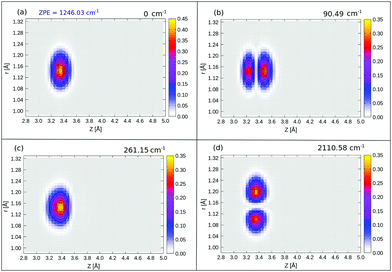
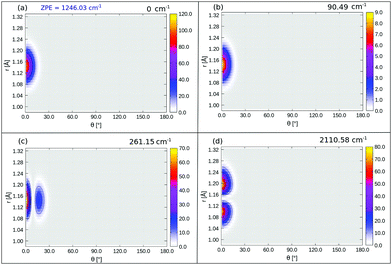
In Table 5 we list selected 3D vibrational state energies obtained in this work, up to excited state 19. Some higher lying states, with excitation in the r mode are also listed there. Probability densities are reported in Fig. 8 below and in Fig. 15 in Appendix E, respectively, for the ground state and three excited, “left-localized” (i.e., “C-down”) vibrational states. In Fig. 7, we show 2D densities ρ(Z, r), obtained near the “C-down” equilibrium value of θ. In Fig. 14, 2D densities ρ(θ, r) are plotted for the same states, obtained at the equilibrium value of Z. Since strictly no good quantum number for θ exists in the 3D case (see Appendix E), we make no assignment of quantum numbers in the figures and in the table.
| State | Energy [cm−1] | State | Energy [cm−1] |
|---|---|---|---|
| 0 | 0.0 | 12 | 518.2 |
| 1 | 90.5 | 13 | 549.9 |
| 2 | 176.9 | 14 | 573.1 |
| 3 | 259.2 | 15 | 576.3 |
| 4 | 261.1 | 16 | 588.3 |
| 5 | 337.6 | 17 | 613.4 |
| 6 | 346.0 | 18 | 629.8 |
| 7 | 412.1 | 19 | 640.7 |
| 8 | 426.3 | (vr = 1) | 2110.6 |
| 9 | 482.9 | (vr = 1) Zex | 2200.6 |
| 10 | 497.6 | (vr = 1) θex | 2369.7 |
| 11 | 502.2 | (vr = 2) | 4196.7 |
The probability density of the ground state wavefunction is localized around the equilibrium values for Z, r (Fig. 8(a)) and also for θ (Fig. 15(a)). This state has a zero-point energy of 1246 cm−1, slightly above the classical barrier of 1185 cm−1. The excitation energy from the ground state to the first vibrational excited state, state no. 1 (Table 5 and Fig. 8(b)), has one quantum in the Z-mode with an energy 90 cm−1, which is similar to the corresponding 2D case (state |1L0L〉 in Table 4), with an energy of 93 cm−1. Excited state 2, has two nodes in Z, with an energy of 177 cm−1, slightly more shifted compared to the corresponding 2D state |2L0L〉 with energy 181 cm−1 according to Table 4. The fourth excited state is the first “θ-excited” one with excitation energy of 261 cm−1. We cannot make a one-to-one comparison with the 2D eigenstates as stated, but on inspection of ρ(θ, Z) (not shown), it appears to be close and somewhat red-shifted, to the 2D state |0L2L〉 at 268 cm−1.
We also find right-localized (“O-down”) states in our BIR-MCTDH analysis (Fig. 16 in Appendix E and Table 5). The first right-well state, state 12 in Table 5, appears at an excitation energy of ∼518 cm−1 (ca. 64 meV) above the ground state, which is lower than for the 2D case, where state |0R0R〉 is of ∼566 cm−1 above the ground state. This lowering is due to the lower zero-point energy in the inverted well, with contributions now also coming from the r mode, not only from Z and θ.
We further find r-excited states by the selection of different initial wavefunctions in the BIR-MCTDH procedure with vibrational nodes in the r-mode. From Fig. 8(d) and Table 5, the first r-excited state (vr = 1) without nodes along Z or θ, appears at relative energy 2111 cm−1, red-shifted compared to the harmonic value of 2134 cm−1 from NMA, due to anharmonicity of the C–O stretch mode. The vr = 2 state is found to be at 4197 cm−1, red-shifted by 25 cm−1 w.r.t an ideal harmonic progression of 2 × 2111 = 4222 cm−1. The first vr = 1 and vr = 2 “right-well” states appear at an energy of ∼502 cm−1 (ca. 62 meV) and ∼487 cm−1 (ca. 60 meV) relative to the corresponding vr = 1 and vr = 2 states, respectively (not shown). Recall that the energy difference between the lowest “left” and “right” states with vr = 0 is 518 cm−1.
This trend is again in line with the findings of Guo and coworkers,12 and we surmise that with increasing vibrational quanta in r, the energy gap between the two isomers eventually diminishes and the energy order may even reverse.
Similar to 2D, we also find 3D state pairs in comparatively narrow energy regions with one state being localized to the left, the other localized to the right. Examples are excited states 15 (“left”) and 16 (“right”) in Table 5, which are separated by ∼12 cm−1. These state pairs are still well below the barrier, when considering zero-point energies. Again, the possible role of these pairs in “sub-barrier isomerization” (if any) lies beyond the scope of this work.
4 Summary and conclusions
The “O-down” isomer configuration observed experimentally in high-vibrationally excited CO adsorbates on NaCl(100) surface has been characterized at the PBE + D2 level for different phases and coverages, i.e., 1/8 and 1/4 ML of the parallel upright phase and 1 ML of the tilted/antiparallel phase. We find that inversion of CO costs approximately 80 meV (ca. 8 kJ mol−1) per molecule, largely independent of coverage.Minimum energy pathways and two- and three-dimensional DFT potential energy surfaces were constructed and discussed in particular for the 1/4 ML P/U phase of CO:NaCl(100). A transition state for “C-down” to “O-down” was found, ca. 0.15 eV above the “C-down” minimum and with CO being almost parallel oriented to the surface. Eyring's transition state theory suggests that at very low temperatures, no “C-down” to “O-down” inversion would occur while at 22 K, a back-isomerization from “O-down” to “C-down” could occur on a timescale of ∼100 s. The 2D potential energy scan along {Z, θ} is found to be not very sensitive to the plane of rotation of CO, i.e., the azimuthal angle, ϕ. The “O-down” configuration has a shallow minimum in the potential energy surface, and the “C–O stretch” vibrations are red-shifted by ≈12 cm−1 compared to “C-down”, for coverage = 1/4. Our findings are consistent with previous experiments15 and theory.12
We also computed and analyzed two-dimensional and three-dimensional vibrational eigenstates. Left- and right-well states with probability densities corresponding to “C-down” and “O-down” isomers were identified, the latter at energies ≈70 meV above the ground state and higher. Delocalized states both with “C-down” and “O-down” character were also observed above the isomerization barrier. Interestingly, pairs of almost degenerate states with “left” and “right” localized character were found well below the barrier in the 2D case. If these pairs survive in higher dimensions and if they can be coupled by a coupling mode and hence serve as low-energy pathways for below-barrier “C-down” to “O-down” isomerization, is currently an open question.
This work should be extended by quantum dynamical simulations of the vibrational energy transfer and the isomerization reaction which are currently underway in our laboratory utilising our potential energy surfaces and MCTDH. Excitations both of the high-frequency r-mode and the lower-frequency θ- and Z-modes will be studied. We are also simulating IR spectra using Ab Initio Molecular Dynamics (AIMD) in conjunction with time-dependent correlation function methods. This will aid in providing a deeper insight into the vibrational energy transfer, spectroscopy and isomerization of the CO:NaCl(100) system.
Conflicts of interest
There are no conflicts to declare.Appendix A: periodic DFT calculations
In Table 6, convergence tests on the number of layers and the k-point mesh on the PBE + D2 level are presented for a single CO molecule in a 4 × 4 supercell (i.e., coverage 1/8).Details of how adsorption energies were computed have been described in ref. 7, where also other parameters and procedures for CO/NaCl(100) had already been tested. Specifically, we used a vacuum gap of 15 Å to separate periodically repeating slabs along the z direction such that the inter-slab interactions are negligible. A dipole/quadrupole correction perpendicular to the surface was adopted using the built-in VASP routine. All calculations were performed for Γ-centered k-point grids with Gaussian smearing of the density of states with a smearing width of 0.01 eV. For all models considered in this work, we first optimized the naked NaCl surfaces, by allowing the interlayer distances to relax to its zero Kelvin geometry (the bottom layer was kept fixed at its position during this procedure) until the residual forces on any atom are smaller than 5 meV Å−1. Initial lattice constants were adopted from the 4 × 4 × 3 supercell model of ref. 7. The relaxed NaCl(100) surface, without symmetry restrictions, has only point group symmetry C1, deviating slightly from the cubic lattice configuration. The distance between the optimized NaCl layers is in the range [2.78,2.87] Å and the Na–Cl–Na angles also slightly deviate from 180°, being in the range [176°,178°]. Afterwards CO was added and the geometry optimized, with all the layers of the NaCl slab except the top layer kept frozen.
Appendix B: minimum energy paths, transitions states, thermal rate constants
As mentioned in the main text, MEPs for the isomerization reaction were found using the Linear Transit Approximation (LTA) and (Climbing Image) Nudged Elastic Band method ((CI)NEB) as implemented in the Henkelmann VTSTtools24,25 compiled with VASP. The LTA generates a set of linearly interpolated images between initial and final structures (minimum configurations), followed by single-point calculations at these images. In the NEB procedure, the first step is the same as the LTA method, however, the images are then relaxed through a force projection scheme such that each of the image points are at an energy minimum in all directions perpendicular to the path. The MEP path was considered converged when the forces acting on the individual images dropped below 0.05 meV Å−1. After convergence, an initial guess of the saddle point was constructed from the two highest energy images in the MEP path, and it was driven up to a second order saddle point utilizing the DIMER method, also implemented in the VTSTTools package. The normal mode analysis confirmed the second order saddle point with two imaginary frequencies. We used the corresponding eigenvectors of the imaginary modes to set up an “improved dimer” calculation with the second order saddle point configuration, finally obtaining a first order saddle point, or transition state, which was confirmed to be converged by its negative curvature, force below 0.01 eV Å−1 and its single imaginary frequency in NMA.Characteristic LTA and NEB paths for inversion of a single CO have been shown in Fig. 5 of the main text. In addition, in Fig. 9 we show the MEP for inversion of the second CO molecule within a coverage = 1 T/A unit cell, giving an “all O-down” configuration.
NMA was also used to evaluate vibrational frequencies and thermodynamic properties. In NMA we used the C and O atoms as movable atoms, i.e., we have six degrees of freedom for the cases with one CO molecule per cell, and twelve for the two-molecule case. (Including the first NaCl layer did not change frequencies significantly.) A step size, Δ = ±0.02 Å was taken to evaluate the derivatives for the NMA. It is to be noted that the results are quite sensitive to the step size, particularly for the frustrated translations, so care must be taken.
With the help of harmonic frequencies obtained from NMA, free energy differences ΔG between different stationary points were calculated as ΔG = ΔEel + ΔGvib(T). Here, ΔEel is the difference in electronic energies of the stationary points, and ΔGvib(T) a vibrational contribution (rotational and translational parts being absent for a surface reaction). Vibrational free energy contributions Gvib(T) were computed as
 | (4) |
Appendix C: details on global potential energy surfaces
The potential energy surfaces were constructed within the static surface approximation, for coverage = 1/4. The single-CO/NaCl interaction potential is ideally a function of the well-known six dynamical Degrees Of Freedom (DOF) of a diatomic molecule as defined in Fig. 10.As mentioned in the main text, for the coverage 1/4 P/U CO:NaCl(100) system, smooth potential energy surfaces V(Z, θ) and V(r, Z, θ) were constructed by 2D and 2D + 1D cubic splines from PBE + D2 VDFT(Zi,θj) and VDFT(rk,Zi,θj) potential energies, at grid points Zi, θj and, additionally, rk. In Table 7, we present details about the chosen grid representations. Note that in the 2D case, equidistant grids along both coordinates were adopted. In the 3D case, equidistant grids were used for r and Z while for θ, Gauss–Legendre roots were adopted. Fig. 11 shows 2D potential cuts of V(r, Z, θ) along θ, Z at (a) r = 1.1138 Å and (b) r = 1.2513 Å for 1/4 ML P/U CO:NaCl(100), which were referred to in the main text.
| No. of layers | E Cad | E Oad | ΔEC–O |
|---|---|---|---|
| 3 | 0.183 | 0.106 | 0.077 |
| 4 | 0.185 | 0.107 | 0.078 |
| k-Point grid | E Cad | E Oad | ΔEC–O |
|---|---|---|---|
| 1 × 1 × 1 | 0.183 | 0.106 | 0.077 |
| 2 × 2 × 1 | 0.182 | 0.106 | 0.076 |
| 3 × 3 × 1 | 0.182 | 0.106 | 0.076 |
| 4 × 4 × 1 | 0.182 | 0.106 | 0.076 |
| Quantity | 2D | 3D | ||||
|---|---|---|---|---|---|---|
| Value | Unit | Remark | Value | Unit | Remark | |
| Grid range along r | — | — | Constant r | [0.9763, 1.3338] | Å | |
| Grid range along Z | [2.3, 6.0] | Å | [2.3, 6.0] | Å | ||
| Grid range along θ | [−180, 180] | ° | GL roots | ° | ||
| N r grid points in r | — | — | 40 | Equid. | ||
| N z grid points in Z | 100 | Equid. | 80 | Equid. | ||
| N θ grid points in θ | 200 | Equid. | 140 | |||
| Δr grid spacing along r | — | 0.009 | Å | |||
| ΔZ grid spacing along Z | 0.037 | Å | 0.047 | Å | ||
| Δθ grid spacing along θ | 0.9 | ° | ≈1.28 | ° | Non-equid. | |
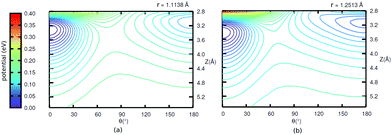 | ||
| Fig. 11 2D potential cuts along θ, Z at (a) r = 1.1138 Å and (b) r = 1.2513 Å for 1/4 ML P/U CO:NaCl(100). | ||
Appendix D: calculation of vibrational eigenfunctions
In order to solve the 2D nuclear Schrödinger equation Ĥ2Dψn(Z, θ) = Enψn(Z, θ) with Ĥ2D given in eqn (2), the Hamiltonian matrix was built with the Fourier Grid Hamiltonian (FGH) method.28The grid spacings were chosen as: ΔZ = LZ/NZ and Δθ = Lθ/Nθ. Here, LZ = Zmax − Zmin and Lθ = θmax − θmin, and NZ = 100, Nθ = 200. Further, Zmin = 2.3 Å and Zmax = 6.0 Å were chosen according to the grid ranges defined in Table 7, and θmax = π and θmin = −π. Note: the potential along the [−π,π] range was obtained by using the relation: V(Z, θ) = V(Z, −θ) which arises as a result of symmetry of the top site of NaCl(100) surface above which the center of mass of the CO molecule lies.
In order to solve the 3D Schrödinger equation Ĥ3Dψn(r, Z, θ) = Enψn(r, Z, θ) with Ĥ3D given in eqn (3), the Block Improved Relaxation method as implemented in the MCTDH package29 was used. In the BIR-MCTDH method, the time-dependent Schödinger equation is solved for a wavepacket propagated in imaginary time using MCTDH. The MCTDH wavefunction is written as a sum of products of Single Particle Functions (SPFs) and in the BIR method,31,32 a single set of SPFs is used for all wave functions which are optimized (relaxed) converging to a set of low lying vibrationally excited states. The SPFs are represented by a linear combination of time-independent basis functions. For the latter, here we use Discrete Variable Representations (DVRs) to represent the three degrees of freedom as listed in Table 8. The MCTDH requires the Hamiltonian to be given in a sum of products form which is the case for our 3D kinetic energy operators but not for our splined 3D potential. We therefore expand our potential in the sum of products form using the POTFIT program,33–35 also implemented in the MCTDH package. The potential is then represented as:
 | (5) |
 . j denotes the single particle potentials of expansion order m, and i and k label the grid points, i.e., q(k)i denotes the ith grid point of the kth grid. The global weighted fitting error from the POTFIT procedure was found to be <0.004 meV.
| θ | Z | r | |
|---|---|---|---|
| Primitive basis | LEG | SIN | SIN |
| N | 140 | 80 | 40 |
| Grid | GL roots [0,π] | [2.3,6.0] Å | [0.9763,1.3338] Å |
| N SPF | 40 | 20 | 10 |
In order to show fast convergence to the desired eigenstates, the initial wavepacket defined before the relaxation must have a reasonable overlap with the desired state. Here we defined the initial wavepackets as products of Gaussian wavepackets defined for the θ, Z and r degrees of freedom, centered at the equilibrium geometry of the global minimum and the corresponding widths taken as the grid spacings Δx of the DVR grids, where x ≡ {θ, Z, r}. (Other choices were also tested, for instance, defining the initial wave packet as a Hartree product of one-dimensional eigenfunctions of θ, Z, r leading to the same ground state.) In 3D, we obtain a ground state with an energy ∼1246 cm−1 relative to the potential minimum. We also get excited states, however, not all states expected from the 2D calculations in Table 4. In this context we note that for the θ coordinate, unlike in the 2D case, good quantum numbers for the vibrationally excited states cannot be assigned. This is because we utilise a Legendre polynomial basis (Pl(cos![[thin space (1/6-em)]](https://www.rsc.org/images/entities/char_2009.gif) θ)) for the theta coordinate and the eigenfunctions are given as linear combinations of this basis. Also note the different kinetic energy operator for θ in the 3D case as a result of the Legendre basis; here θ is transformed to cos
θ)) for the theta coordinate and the eigenfunctions are given as linear combinations of this basis. Also note the different kinetic energy operator for θ in the 3D case as a result of the Legendre basis; here θ is transformed to cos![[thin space (1/6-em)]](https://www.rsc.org/images/entities/char_2009.gif) θ and subsequently
θ and subsequently  to the ĵ2 operator.
For obtaining the “r-excited” states (vr = 1, 2), we use another relaxation method from the MCTDH package which converges to the eigenvector closest to the initial wavefunction and within a defined energy range. The same is also applied for finding the higher excited right-well states.
Appendix E: vibrational eigenstates
4.1 2D vibrational eigenstates
Density plots of selected left-localized (“C-down”) and right-localized (“O-down”) 2D vibrational states ψ(θ, Z) are depicted in Fig. 12 and 13, respectively. Density plots of selected delocalized, above-barrier states are shown in Fig. 14.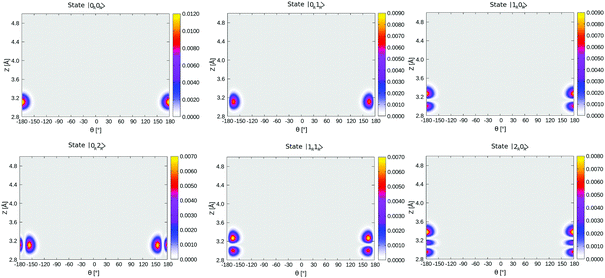 | ||
| Fig. 13 Density plots of the first six right-well localized vibrational eigenfunctions of 1/4 ML P/U CO:NaCl(100) along θ, Z. | ||
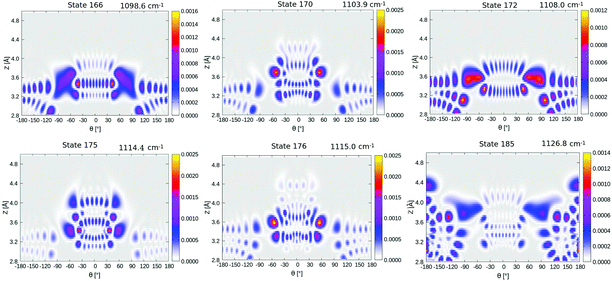 | ||
| Fig. 14 Density plots of higher vibrationally excited delocalized eigenfunctions of 1/4 ML P/U CO:NaCl(100) along θ, Z. | ||
4.2 3D vibrational eigenstates
2D densities ρ(θ, r) of selected three-dimensional states corresponding to Fig. 8 (see main text) are shown in Fig. 15. 2D densities of the lowest right-well localized 3D eigenstate (state 12 in Table 5) are shown in Fig. 16. | ||
| Fig. 16 2D ρ(Z, r) (a) and ρ(θ, r) plot (b) of the lowest, right-well localized 3D eigenstate (state 12 in Table 6, energy = 518.24 cm−1), of 1/4 ML P/U CO:NaCl(100), at θ = 170°, and Z = 3.09 Å, respectively, obtained from the BIR-MCTDH method. | ||
Acknowledgements
We acknowledge fruitful discussions with Alec Wodtke (Göttingen), Eric Fischer, Tillmann Klamroth and Foudhil Bouakline (all three from Potsdam), the latter two also for help in coding. We thank the Deutsche Forschungsgemeinschaft (DFG) for financial support through project Sa 547/9 and the North-German Supercomputing Alliance (HLRN) for providing HPC resources. We would like to thank Jan Peter Toennies for his wonderful contributions to surface science. One of us (P. S.) is grateful to him for many fruitful discussions over many years.References
- R. Gevirzman, Y. Kozirovski and M. Folman, Trans. Faraday Soc., 1969, 65, 2206–2214 RSC.
- A. W. Meredith and A. J. Stone, J. Chem. Phys., 1996, 104, 3058–3070 CrossRef CAS.
- J. Heidberg, E. Kampshoff, R. Kühnemuth and O. Schönekäs, J. Electron Spectrosc. Relat. Phenom., 1993, 64–65, 803–812 CrossRef CAS.
- S. A. Corcelli and J. C. Tully, J. Chem. Phys., 2002, 116, 8079–8092 CrossRef CAS.
- J. Heidberg, B. Brase, W. Claas and H.-C. Langowski, Vacuum, 1990, 41, 207–209 CrossRef CAS.
- H. H. Richardson and G. E. Ewing, J. Electron Spectrosc. Relat. Phenom., 1987, 45, 99–111 CrossRef CAS.
- A. D. Boese and P. Saalfrank, J. Phys. Chem. C, 2016, 120, 12637–12653 CrossRef CAS.
- A. Vimont, F. Thibault-Starzyk and M. Daturi, Chem. Soc. Rev., 2010, 39, 4928–4950 RSC.
- J. Heidberg, E. Kampshoff and M. Suhren, J. Chem. Phys., 1991, 95, 9408–9411 CrossRef CAS.
- J. Vogt and B. Vogt, J. Chem. Phys., 2014, 141, 214708 CrossRef.
- S. Picaud, P. N. M. Hoang, C. Girardet, A. W. Meredith and A. J. Stone, Surf. Sci., 1993, 294, 149–160 CrossRef CAS.
- J. Chen, S. Hariharan, J. Meyer and H. Guo, J. Phys. Chem. C, 2020, 124, 19146–19156 CrossRef CAS.
- H. C. Chang and G. E. Ewing, Phys. Rev. Lett., 1990, 65, 2125–2128 CrossRef CAS.
- L. Chen, J. A. Lau, D. Schwarzer, J. Meyer, V. B. Verma and A. M. Wodtke, Science, 2019, 363, 158–161 CrossRef CAS.
- J. A. Lau, A. Choudhury, L. Chen, D. Schwarzer, V. B. Verma and A. M. Wodtke, Science, 2020, 367, 175–178 CAS.
- J. P. Perdew, K. Burke and M. Ernzerhof, Phys. Rev. Lett., 1996, 77, 3865–3868 CrossRef CAS.
- S. Grimme, J. Comput. Chem., 2006, 27, 1787–1799 CrossRef CAS.
- G. Kresse and J. Hafner, Phys. Rev. B: Condens. Matter Mater. Phys., 1994, 49, 14251–14269 CrossRef CAS.
- G. Kresse and J. Hafner, Phys. Rev. B: Condens. Matter Mater. Phys., 1993, 47, 558–561 CrossRef CAS.
- G. Kresse and J. Furthmüller, Phys. Rev. B: Condens. Matter Mater. Phys., 1996, 54, 11169–11186 CrossRef CAS.
- G. Kresse and J. Furthmüller, Comput. Mater. Sci., 1996, 6, 15–50 CrossRef CAS.
- P. E. Blöchl, Phys. Rev. B: Condens. Matter Mater. Phys., 1994, 50, 17953–17979 CrossRef.
- S. Nosé, J. Chem. Phys., 1984, 81, 511–519 CrossRef.
- G. Henkelman, B. P. Uberuaga and H. Jónsson, J. Chem. Phys., 2000, 113, 9901–9904 CrossRef CAS.
- G. Henkelman and H. Jónsson, J. Chem. Phys., 2000, 113, 9978–9985 CrossRef CAS.
- H. Eyring, Chem. Rev., 1935, 17, 65–77 CrossRef CAS.
- R. P. Bell, Trans. Faraday Soc., 1959, 55, 1–4 RSC.
- J. Stare and G. G. Balint-Kurti, J. Phys. Chem. A, 2003, 107, 7204–7214 CrossRef CAS.
- M. Beck, A. Jäckle, G. Worth and H.-D. Meyer, Phys. Rep., 2000, 324, 1–105 CrossRef CAS.
- S. Heiden, D. Usvyat and P. Saalfrank, J. Phys. Chem. C, 2019, 123, 6675–6684 CrossRef CAS.
- H.-D. Meyer, F. L. Quéré, C. Léonard and F. Gatti, Chem. Phys., 2006, 329, 179–192 CrossRef CAS.
- L. J. Doriol, F. Gatti, C. Iung and H.-D. Meyer, J. Chem. Phys., 2008, 129, 224109 CrossRef.
- A. Jäckle and H.-D. Meyer, J. Chem. Phys., 1996, 104, 7974–7984 CrossRef.
- A. Jäckle and H.-D. Meyer, J. Chem. Phys., 1998, 109, 3772–3779 CrossRef.
- F. Otto, J. Chem. Phys., 2014, 140, 014106 CrossRef.
| This journal is © the Owner Societies 2021 |


