Kinetics of viscoelasticity in the electric double layer following steps in the electrode potential studied by a fast electrochemical quartz crystal microbalance (EQCM)†
Christian
Leppin
 ,
Astrid
Peschel
,
Frederick Sebastian
Meyer
,
Astrid
Peschel
,
Frederick Sebastian
Meyer
 ,
Arne
Langhoff
and
Diethelm
Johannsmann
 *
*
Institute of Physical Chemistry, Clausthal University of Technology, Arnold-Sommerfeld-Str. 4, D-38678 Clausthal-Zellerfeld, Germany. E-mail: johannsmann@pc.tu-clausthal.de
First published on 2nd February 2021
Abstract
Changes in the viscoelasticity of the electric double layer following steps in electrode potential were studied with an electrochemical quartz crystal microbalance (EQCM). The overtone scaling was the same as in gravimetry (−Δf/n ≈ const with Δf the frequency shift and n the overtone order). Changes in half-bandwidth were smaller than changes in frequency. This Sauerbrey-type behaviour can be explained with either adsorption/desorption or with changes of the (Newtonian) viscosity of the diffuse double layer. While the QCM data alone cannot distinguish between these two processes, independent information supports the explanation in terms of double layer viscosity. Firstly, the magnitudes of the frequency response correlated with the expected changes of the viscosity-density product in the diffuse double layer. With regard to viscosity, these expectations are based on the viscosity B–coefficients as employed in the Jones–Dole equation. Expected changes in density were estimated from the densities of the respective salts. Secondly, the explanation in terms of liquid-like response matches the kinetic data. The response times of frequency and bandwidth were similar to the response times of the charge as determined with electrochemical impedance spectroscopy (EIS). Rearrangements in the Helmholtz layer should have been slower, given this layer's rigidity. Kinetic information obtained with a QCM can aid the understanding of processes at the electrode–electrolyte interface.
Introduction
The electrochemical quartz crystal microbalance (EQCM, a QCM combined with an electrochemical setup) has in the past mostly been used to follow the formation and the dissolution of metallic layers1–3 or organic films.4,5 One compares the mass change as inferred from the frequency shift and the Sauerbrey equation6 to the charge transferred across the interface. The two are related by Faraday's law.7EQCM data are easily interpreted as long as the layer thickness is larger than a few nanometres with the frequency shift being correspondingly large. The instrument then operates in the gravimetric mode. Problems occur at the lower end of the sensitivity range. Frequency and bandwidth respond not only to deposited mass, but also to changes in viscosity8–11 and to changes in the softness of the layer under study.5 Other complications are slip,12 nanobubbles,13 roughness,14 piezoelectric stiffening,15 and stress.16 These effects typically amount to a few Hz. The different factors of influence can to some extent be disentangled from each other by making use of an advanced QCM (also called “QCM-D” for “QCM with Dissipation monitoring”17). These instruments determine the resonance bandwidth in addition to the resonance frequency and they do so on a number of different overtones.18 Still, ambiguities in interpretation often remain.
Separate from the difficulties in the data analysis, the EQCM suffers from limited time resolution. A typical data acquisition rate is 1 s−1. A rate of 10 data points per second is also feasible,19 but when measuring faster than that, the precision rapidly deteriorates. Fast data acquisition is particularly important in electrochemistry because analytic electrochemistry often exploits transients.20 With regard to speed, controlling the QCM with a multi-frequency lock-in amplifier (MLA) amounts to a significant advance.21,22 The MLA acquires entire resonance curves in a single shot. The time per data point in the standard mode (the “comb mode”) can be as short as 1 ms. It can decrease to 100 μs in the “single-frequency mode”.
Fast data acquisition brings the QCM closer to dynamic electrochemistry and it also allows for accumulation and averaging on repetitive processes, such as cyclic voltammetry or square wave voltammetry.21,23 We call the instrument exploiting this capability “voltage modulation QCM” in the following. (Of course, modulation and accumulation also are feasible with the standard QCM, but the cycle time must then be many seconds.) Accumulation and averaging can decrease the frequency resolution into the mHz range. Also, and equally important, stimulus-response experiments eliminate those interfering effects, which do not respond to the stimulus. This includes slow frequency drifts, caused by migration of crystal defects. It also includes roughness effects, as long as roughness does not depend on electrode potential. Modulation may also lessen the effects of nanobubbles and nano-pancakes,24,25 if bubble nucleation is slower than the modulation. On the downside, the modulation cycle may or may not pass through a well-defined reference state. No such reference state is available for the analysis of the experiments reported below. The situation closest to a reference state presumably is the potential of zero charge (PZC). Even at the PZC, a layer of adsorbed ions (the Helmholtz layer) persists. What is called Δf(t) below, is the deviation from the averaged frequency (averaged over the modulation cycle). When evaluating experiments in terms of viscoelasticity (cf.eqn (3) below), it must be kept in mind that none of the states, which the voltage modulation QCM compares, is free of a double layer. When two states lead to the same bandwidth, this implies equal amounts of elasticity, rather than the absence of elasticity.
Running the instrument this way and switching the electrode potential, one always finds a sizeable frequency response. Typical magnitudes are 1 Hz V−1. Given that these effects are ubiquitous, the underlying mechanism must be general. The experiments reported below occurred on inert electrolytes. The current was mostly capacitive, as indicated by a feature-less cyclic voltammogram. Under these conditions, the changes in frequency and bandwidth can be attributed to changes in the double layer.
To the best of our knowledge, the importance of the double layer viscosity was first pointed out by the Tel Aviv group in ref. 26. The argument builds on measurements of the frequency shift on the fundamental employing an oscillator circuit. Inert electrolytes were used, composed of ions, which are known to not specifically adsorb to the gold surface. Voltage sweeps over a range of about 1 V caused frequency shifts of a few Hz. The depth of information was less than what is obtained with the current instruments (bandwidth, overtones), but the conclusions, which the group draws, are similar to what is claimed here. A side remark: We subjected the ion types studied in ref. 26 to our measurement protocol and found them to behave similarly to the other solutions, systematically compared below.
In the early 2000s the diffuse double layer was studied with the QCM by Kern and Landolt.11 From today's perspective, these results are not easily understood because the shifts in frequency were in the range of hundreds of hertz. Even differences between the model and the experiment were of this magnitude. At a similar time, Etchenique and Buhse also reported work on the diffuse double layer.27,28 These experiments are intriguing insofar, as the shifts of frequency and bandwidth showed semicircles when displayed in polar form. The implicit parameter in these graphs was the salt concentration. These plots suggest that there was a characteristic rate of relaxation, which depended on salt concentration and which was similar to the resonance frequency at some specific salt concentration (a few tens of mM). Etchenique and Buhse point out a peculiarity in these experiments: the effects disappeared when the front surface of the resonator was completely covered with gold. This finding can be associated with piezoelectric stiffening,29 meaning that the sample's electric impedance takes an influence on the resonance frequency. The relaxation may have amounted to the discharging of a capacitor, meaning that the relaxation time may have been an RC-time.
Later, Encarnacao et al.30 and, more recently, Funari et al.31 studied the diffuse double layer, based on the dependence of the resonance frequency and the dissipation factor on salt concentration. (The dissipation factor, D, is proportional to the half bandwidth, Γ). The work by Funari et al. interprets the data in more quantitative form than ref. 30. An OpenQCM32 was used to determine the fundamental resonance frequency (at 10 MHz) and the dissipation factor of this mode as a function of salt concentration. The bulk viscosity as a function of concentration was determined independently and inserted into the Gordon–Kanazawa equation, thereby predicting a hypothetical QCM response for a semi-infinite liquid (no double layer). Deviations between experiment and the Gordon–Kanazawa result were attributed to the diffuse double layer. Using the thickness of the diffuse double layer as predicted by Debye–Hückel theory, an effective complex shear modulus of the double layer was derived. The double layer was found to be viscoelastic.
Modelling
We briefly expand on the background of the model, which is based on the acoustic multilayer formalism, as worked out by a number of researchers.33–36 While the equations reported by the different groups are not formally equal, they are equivalent. One formulation is | (1) |
Given that the diffuse double layer is acoustically thin (much thinner than the penetration depth of the shear wave, which is around 100 nm), eqn (1) can be Taylor expanded to 1st order in df. Referencing the frequency shift to the bulk liquid (rather than the dry crystal) this leads to37
 | (2) |
The term in brackets is a viscoelastic correction. Zbulk = (iωρbulkηbulk)1/2 is the wave impedance of the bulk. A Newtonian bulk viscosity is assumed in the following, which is reasonable, given the small salt concentration (20 mM). The term Z2bulk/Z2f is sometimes associated with the “missing mass”.38ρfdf is the Sauerbrey mass. Because eqn (2) is linear in df, it also holds in an integral sense. (Additivity only holds, when eqn (1) can be Taylor-expanded to 1st order in df.) Using Z = (iωρη)1/2 and rearranging, this leads to38,39
 | (3) |
The integral in eqn (3) has dimensions of a mass per unit area. It was renamed as mapp in the second step. When the integral is replaced by an apparent mass, eqn (3) has the same structure as the Sauerbrey equation. Note, however, that Δmapp is a complex function of overtone order, n, meaning Δmapp = Δm′app(n) + iΔm′′app(n). The letter Δ (to be distinguished from Δ0) here denotes a deviation from the time average. Nonzero Δm′′app corresponds to nonzero ΔΓ in experiment. If Δm′′app would strictly always be comparable in magnitude to Δm′app and if, further, Δmapp would always strongly depend on n, introducing the variable mapp would have been misleading. However, −Δf/n was mostly constant in experiment. ΔΓ was smaller than −Δf by a factor of 2 or more (with few exceptions). The shifts in frequency and bandwidth were not strictly in line with the Sauerbrey equation, but they often were close to that. This finding requires an explanation.
Typically, Sauerbrey behaviour (−Δf/n ≈ const, −Δf ≫ ΔΓ) is associated with adsorption and desorption. Following this view, one might be tempted to interpret Δmapp as a mass adsorbing and desorbing to and from the surface. However, there is another limit, which leads to the same experimental signature. A change in the viscosity-density product in the diffuse double layer also lets the contrast function in eqn (3) (the term in square brackets) be real and independent of n, as long as the viscosity is Newtonian.
Further complicating matters, the real part of Δmapp may be constant even in those cases, where Δm′′app ≈ Δm′app. Viscoelasticity entails a complex viscosity (η = η′ − iη′′) and a dependence of η on frequency (“viscoelastic dispersion”). One does not come without the other. Viscoelasticity is rooted in relaxation processes on the time scale of the inverse frequency. Such relaxations give rise to frequency-dependent response functions. In the specific case of eqn (3), however, the contrast function may be written as
 | (4) |
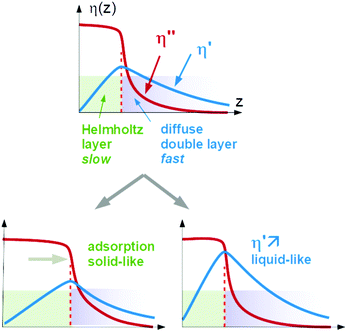
Again, Sauerbrey-type behaviour can be caused by either adsorption and desorption of molecules, which are rigidly attached to the substrate, or by changes in the (Newtonian) viscosity of the diffuse double layer. We call these two cases a “solid-like” and a “liquid-like” response. The two alternatives are sketched in Fig. 1.
A caveat: In principle, both processes might occur in parallel and still let the QCM response be close to Sauerbrey-like. There is room for opinion in this regard. The authors tend to think that the double layer would change its viscoelasticity in this case because the diffuse double layer and the Helmholtz layer are not sufficiently distinct to let these two processes be separate. Part of the double layer would in this case be soft, but still elastic. In the following, we portray “solid-like” and “liquid-like” as alternatives. The intermediate behaviour would change the layer's viscoelasticity, in our opinion.
The two cases cannot be distinguished based on QCM data alone. A statement can, however, be derived from information other than Δf and ΔΓ. Two such sources of information are available, which are the switching kinetics and the dependence on ion type.
With regard to switching kinetics, we argue that the QCM response cannot possibly be faster than the charge response, where the latter time constant is the RC-time from electrochemical impedance spectroscopy. If the time scale of the QCM response is much slower than the charge response, we attribute it to the Helmholtz layer. (Such slow processes are seen in experiments with amino acids and proteins, see Fig. 5 in ref. 23.) If the time scale of the QCM response is close to the time scale of the charge response, we attribute the process to the diffuse double layer.
With regard to ion-type, the dependence of the contrast function on the ion species is mediated by viscosity and density. For the viscosity, a starting point can be the Jones–Dole equation:40,41
 | (5) |
| B [L mol−1] | C [L mol−1] | |
|---|---|---|
| Li+ | 0.1466 | 0.0007 |
| Na+ | 0.0850 | 0.0214 |
| K+ | −0.0120 | 0.0265 |
| Cs+ | −0.0529 | 0.1086 |
| NH4+ | −0.0077 | −0.0047 |
| F− | 0.1256 | 0.0259 |
| Cl− | −0.0104 | 0.0240 |
| Br− | −0.0426 | 0.0613 |
| NO3− | −0.0481 | 0.0413 |
With regard to density, no parameters analogous to the viscosity B-coefficients are available in the literature, but such coefficients can be calculated from tabulated values of the density of salt solutions.46 In analogy to eqn (5), one writes
 | (6) |
We call Ci the “density C-coefficients”. The 9 ions under study can be combined to 20 different salts. Assuming additivity, an (overdetermined) equation system links the density increments of the individual ions to the density increments of the salts. The equation system can be solved (minimizing a square deviation, given that the system is overdetermined). Details are provided in the ESI.† The derived parameters are tabulated in Table 1 together with the viscosity B-coefficients.
The contrast function can be approximated as
 | (7) |
Δ0ci is the deviation from the bulk concentration. In the second step, it was assumed that BiΔ0ci ≪ 1, which can of course be debated. Following this line of argument, we search for a correlation between the shifts in frequency and bandwidth, on the one hand, and ∑(Bi + Ci)/zi, on the other. zi = ± 1 is the charge number. (We are only concerned with monovalent electrolytes.) The charge number enters because some ions are enriched, while others are depleted. The argument certainly has limitations with regard to quantitative detail. eqn (5) and (6) apply at low concentrations and they apply under conditions of electroneutrality, as pointed out in ref. 26 already. But the argument only motivates the search for a correlation, not a quantitative model. If a correlation is found, it speaks in favour of liquid-like response. The effects of adsorption and desorption should not depend on the viscosity B-coefficient.
Below we go through an estimate of the expected magnitudes of the frequency shifts. For adsorption/desorption with a density of 1 g cm−3 and a thickness of the adsorbed layer of 0.2 nm, the Sauerbrey equation predicts a frequency shift Δ0f ≈ −1 Hz. (Subscript 0 denotes a change with respect to a hypothetical state with no double layer at all.) For the estimate of Δ0f for the liquid-like case, we ignore the Helmholtz layer and assume exponential profiles of the ρη-product of the form Δ0(ρη)(z) = Δ0ηSΔ0ρS![[thin space (1/6-em)]](https://www.rsc.org/images/entities/char_2009.gif) exp(−z/rD). The subscript S denotes z = 0. rD is the Debye length. With this profile, the integral in eqn (3) can be evaluated, leading to
exp(−z/rD). The subscript S denotes z = 0. rD is the Debye length. With this profile, the integral in eqn (3) can be evaluated, leading to
 | (8) |
The bulk viscosity was assumed as 10−3 Pa s. Δ0ρSΔ0ηS/ηbulk can be estimated as
 | (9) |
Δ0cS is the shift in concentration at the substrate. Δ0σ ≈ 5 × 10⁻⁶ C cm−2 is charge in the electrode as determined by cyclic voltammetry (see Fig. 4b), which is balanced by a charge in the double layer. The minus sign occurs because the co-ions are depleted. F is the Faraday constant. With ∑(Bi + Ci)/zi being of the order of 0.1 L mol−1, all parameters entering the estimate are known. From eqn (8) and (9), one expects −Δ0f/n ≈ 0.3 Hz. Note that the Debye length cancels after combining the two equations. Again: A rigid adsorbed layer leads to similar values because the larger contrast function compensates the smaller thickness.
Operation of a QCM driven with a multi-frequency lock-in amplifier
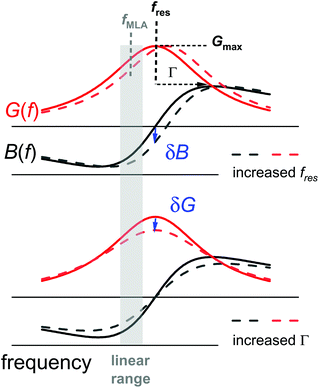
Differing from impedance analysis47 and ring-down,48 the MLA applies a “comb” of up to 42 evenly spaced frequencies. A resonance curve is obtained from the currents at these frequencies. Fourier-transformation of the comb to the time domain produces a sequence of pulses, spaced in time by Δt = 1/δfcomb, where δfcomb is the difference in frequency between two neighbouring members of the comb. Δt is the time resolution of the comb measurement. Given that the resonances are about 2 kHz wide, one may choose the spacing as wide as 1 kHz, resulting in a time resolution of 1 ms. For optimum sampling, the respective comb will then have only 9 to 20 members (Fig. S1 in the ESI†), because the other frequencies would be outside the resonance.In order to further improve the time resolution, one may abandon the comb measurements and read shifts in frequency and bandwidth from shifts of the electrical admittance at one single frequency (Fig. 2). This approach is less robust than the comb measurement because there is no redundancy.49 If the only variable parameters of a resonance curve are the resonance frequency, fres, and the half-bandwidth, Γ, shifts in the resonator's complex admittance at one fixed frequency, ΔY = ΔGel + iΔBel with Gel the conductance and Bel the susceptance, can be converted to shifts in fres and Γ. The single-frequency measurement is faster than the comb measurement because it avoids the constraint Δt = 1/δfcomb.
For a single-shot measurement, the MLA's precision in frequency is comparable to the precision of the conventional instrumentation. After averaging frequency readings for 1 s, the root-mean-square noise on the averaged values is 30 mHz. The noise on Γ is in the same range. Still, the MLA-driven voltage modulation QCM is attractive in terms of precision because it allows for accumulation and averaging of periodic signals.
Studies of a stimulus-response behaviour using a QCM have been carried out previously by Gabrielli, Perrot, and co-workers (ref. 50 and 51 and others). The group calls this technique AC-electrogravimetry (AC-EG). The voltage modulation QCM differs from AC-electrogravimetry in the following regards:
− AC-electrogravimetry employs an oscillator circuit, the output of which is fed into a frequency-to-voltage converter. This mostly happens at one single overtone and mostly supplies one frequency shift, which is converted to a mass shift with the Sauerbrey equation. The voltage modulation QCM, on the other hand, determines bandwidth as well as frequency and it does so on a few different overtones.
− The Paris group in ref. 50 applies sinusoidal electrical signals to the working electrode and sweeps the frequency. A current response (determined with electrochemical impedance spectroscopy, EIS) is plotted together with the mass response. Polar plots of either the current response or the mass response often show semicircles, characteristic of relaxations. The frequency at the apex is the inverse relaxation time. Sinusoidal excitation, followed by frequency filtering is an option for the voltage modulation QCM, as well. Frequency-domain experiments of this kind have superior precision because of frequency filtering. However, voltage modulation is not limited to sine-waves. Square-wave excitation combined with an analysis of the kinetics in the time domain is more direct. Evidently, working in the frequency domain and using the exact same protocol for EIS and the voltage modulation QCM has advantages, if the voltage modulation QCM is supposed to complement EIS.52
Materials and experimental
Lithium nitrate (LiNO3, purity ≥99.0%), ammonium nitrate (NH4NO3, purity ≥99.0%), potassium nitrate (KNO3, purity ≥99.0%), caesium nitrate (CsNO3, purity ≥99,8%), sodium fluoride (NaF, purity ≥99.0%), sodium chloride (NaCl, purity ≥99.0%), and sodium bromide (NaBr, purity ≥99.99%) were obtained from Sigma-Aldrich. Sodium nitrate (NaNO3, purity ≥99.0%) was obtained from Acros Organics. Ultrapure water (resistivity ≥18.2 MΩ cm) was generated by an arium 611VF reverse osmosis system (Sartorius).Stock solutions were prepared by dissolving the inorganic salts in ultrapure water at a concentration of 100 mM. Unless mentioned otherwise, the stock solutions were diluted to a concentration of 20 mM before measurement. The ion concentration was on purpose kept low (20 mM) to let the diffuse double layer be as thick as possible with the ohmic solution resistance still being tolerable.
Resonator crystals with a fundamental frequency of 5 MHz and a diameter of 14 mm were supplied by Quartz Pro, Stockholm, Sweden. The holder was built in-house. The temperature was 22 ± 1 °C. The potential at the resonator's front electrode was controlled by a potentiostat (Gamry, Interface 1010E). A two-electrode-setup with a platinum counter electrode was employed. Calibration of the electrode potential occurred with cyclic voltammograms on the ferro–ferricyanide couple. The acoustic resonances were probed using the multi-frequency lock-in amplifier (MLA) supplied by Intermodulation Products AB (Stockholm, Sweden). The time resolution was 1 ms for the comb measurements and 100 μs for the single-frequency measurements. Δf(t) and ΔΓ(t) were determined on three overtones at 15, 25, and 35 MHz.
Polycrystalline gold electrodes (geometric surface area 0.8 cm2) were employed as supplied by the manufacturer. About 75% of the electrode area exposed the Au(111) surface to the liquid as shown with grazing incidence X-ray diffraction (see the ESI†). Between measurements, the resonators were cleaned by rinsing with water, followed by repeated scans of cyclic voltammetry in 0.1 M sulphuric acid, until the shape of the current–voltage traces became stationary.
EIS was undertaken with a separate potentiostat (Ivium, IviumStat). The EIS data were modelled with the Randles circuit (see section Electrochemical impedance spectroscopy in the ESI†). A charge response time (an RC-time) was derived from the circuit parameters.
Comb measurements
Ideally, the resonator's electric admittance at the frequency fi would be given as | (10) |
G max is an amplitude, related to the effective electrode area. Gmax is not further considered in the data analysis. Because calibration usually has some imperfections, a more practical fit function is the phase-shifted Lorentzian:
 | (11) |
The phase-shifted Lorentzian contains three more fit parameters (a phase, φ, and two offsets, Goff and Boff), which account for imperfect calibration and, also, for the electrical parallel capacitance. Fits with eqn (11) produce agreement with the data with no discernible systematic errors.
Single-frequency measurements
For improved time resolution the comb measurements were complemented by single-frequency measurements, using one channel, only. The input to this channel is called A′(t) + iA′′(t). t is a time in the modulation interval (0 < t ≤ Tmod). A(t) is complex because it is a Fourier component of the signal at the detector with ω equal to the frequency of excitation. At this point, there is a complication in the MLA's software. The Fourier transform suffers from Fourier leakage, unless the frequency of excitation is in some specific relation to the data acquisition rate. In order to avoid Fourier leakage, the MLA “tunes” the frequency of excitation. Tuning may be turned off, but the increase in noise is prohibitively large. The tuned frequency is slightly displaced from the centre of the resonance, meaning that the grey bar in Fig. 2 is not necessarily at the centre of the resonance. One might still convert from the raw signal to Δf(t) and ΔΓ(t) using the known resonance parameters, but it is simpler to fit the single-frequency data to the comb data. As long as Δf(t) and ΔΓ(t) are much smaller than the width of the resonance, they are linearly related to the shifts ΔA′(t) + iΔA′′(t): | (12) |
α = α′ + iα′′ and β = β′ + iβ′′ are calibration parameters. α and β were determined by fitting the transformed values against the values obtained with the comb measurement.
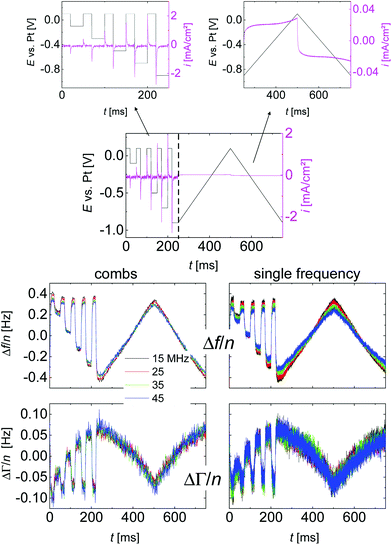
Calibration against comb data is problematic in two ways. Firstly, the calibration parameters α and β in eqn (12) change systematically when noise is added to the raw data. This effect is intrinsic to the algorithm. The effect is small but can be noticed in Fig. 3. Because of this small error, all response amplitudes were derived from the comb measurements. Time constants, on the other hand, were derived from the single-frequency measurements because of the superior time resolution. A second problem with eqn (12) is that α and β are fixed numbers, pertaining to an entire data set (0 < t ≤ Tmod). Should one of the parameters Gmax, φ, Goff, or Boff vary systematically in response to the modulation, calibration with fixed α and β will ignore this dependency.
The single-frequency measurement is limited in its data acquisition rate by the resonator's intrinsic response time, which is about (2πΓ)−1. Even this constraint can be avoided, in principle. One may determine the resonator's intrinsic response function and deconvolute the functions fres(t) and Γ(t), using the response function as the memory kernel. However, deconvolution was not undertaken here. With Γ ≈ 2000 Hz (depending on overtone order), the time resolution of the single-frequency measurement can be 100 μs, at best.
Measurement protocol
Fig. 3 shows a typical time trace of raw data, taken on a 20 mM solution of LiNO3 in water. One third of the time was spent on square-wave excitation with varied amplitude, two thirds were spent on linear ramps. The ramps served to verify that the sample under study was electrochemically inactive (no redox peaks). The ramps were sometimes omitted when capacitive behaviour had been confirmed in a previous experiment. The number of accumulations underlying Fig. 3 was N = 24![[thin space (1/6-em)]](https://www.rsc.org/images/entities/char_2009.gif) 600, which implies a total data acquisition time of 830 min (including time spent on fitting). The left-hand side and the right-hand side show data acquired with the comb mode and single-frequency mode, respectively. The colours correspond to the different overtones.
600, which implies a total data acquisition time of 830 min (including time spent on fitting). The left-hand side and the right-hand side show data acquired with the comb mode and single-frequency mode, respectively. The colours correspond to the different overtones.
Linear ramps
A central assumption in the interpretation is an ideally polarizable electrode. Polarizability was checked for with voltage ramps as shown in Fig. 4. The current–voltage curve is governed by a capacitive current. There are no peaks, which would be associated with a redox reaction. Frequency and bandwidth follow the voltage rather linearly. That the electrode is nearly ideally polarizable is also evidenced by electrochemical impedance spectroscopy as described in the ESI.† The charge transfer resistance is much larger than the solution resistance.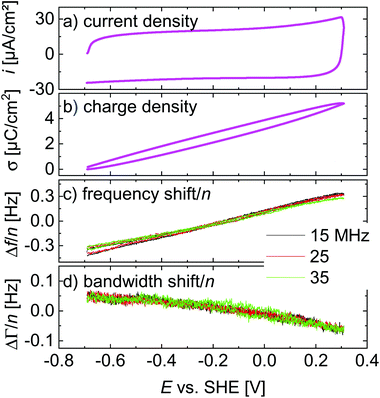 | ||
| Fig. 4 Linear ramps from Fig. 3 displayed versus electrode potential. The scan rate was 4.0 V s−1. | ||
Variable-amplitude square waves
Voltage steps were employed to access the kinetics of the QCM response. The left-hand side in Fig. 3 shows a typical data set. When the electrode is switched to cathodic potentials, the frequency decreases, while the bandwidth increases. At cathodic potentials, cations are enriched at the surface, while anions are depleted. Because the chosen anion (NO3−) has a small viscosity B-coefficient (Table 1), the cations (Li+ in Fig. 3) dominate the QCM response.The magnitude of the effects is proportional to the magnitude of the steps in electrode potential (in line with the linear dependence of Δf on electrode potential in Fig. 4). The overtone scaling (−Δf/n ≈ const) follows the Sauerbrey equation.
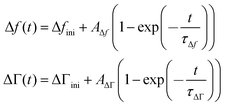
The kinetics of the response was fitted with the functions
 | (13) |
Δfini and ΔΓini are offsets, AΔf and AΔΓ are amplitudes, and τΔf and τΔΓ are response times. Fig. 5 shows examples of fits with eqn (13) for a 20 mM aqueous solution of LiNO3.
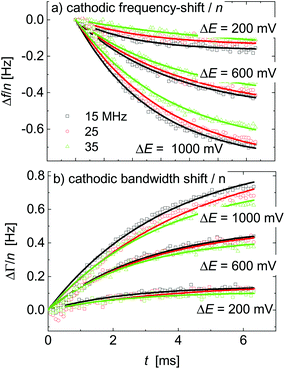 | ||
| Fig. 5 A subset of Fig. 4 showing the response to voltage steps. The lines are fits with eqn (13). The sample was an aqueous LiNO3 electrolyte at a concentration of 20 mM. | ||
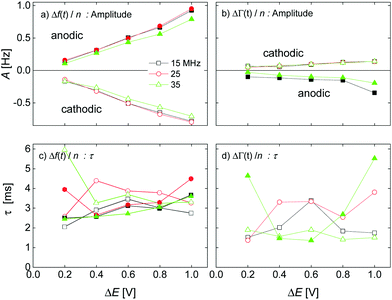
The kinetic parameters were similar for steps into the two directions (cathodic and anodic). Further, the response times were similar for Δf and ΔΓ. The discussion below is based on parameters derived from fits to Δf(t) in response to positive jumps in electrode potential. With regard to the amplitudes, these were normalized to the jump in potential. Slopes 〈A/ΔE〉 were derived from the top panels in Fig. 6 as
 | (14) |
The response times were largely independent of the magnitudes of the jumps. Averages were taken over the different magnitudes.
Uncertainties as stated in the figure captions of Fig. 6–9 are errors of the mean (averages over all data points, anodic and cathodic process included) obtained by bootstrapping following ref. 53. The error of the mean was normalized to the respective values (unit is %).
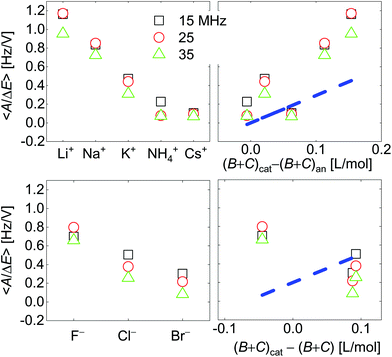 | ||
| Fig. 7 Voltage-normalized amplitudes for a set of cations (top) and a set of anions (bottom). The right-hand side shows the data plotted versus ∑(Bi + Ci)/zi. The dashed blue line indicates the slope as predicted from eqn (8) and (9). Ions were ordered according to ion radius on the left-hand side. Fractional errors of the mean: cations: 0.6%; anions: 1.8%. | ||
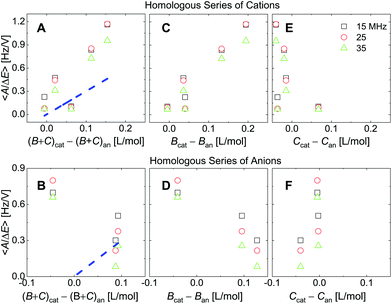 | ||
| Fig. 8 Analogues of the right-hand side in Fig. 7 where ∑(Bi + Ci)/zi was replaced by ∑Bi/zi (viscosity only, panels C and D) or ∑Ci/zi (density only, panels E and F). For the cations, the correlation with viscosity (∑Bi/zi) is stronger than the correlation with density (∑Ci/zi). | ||
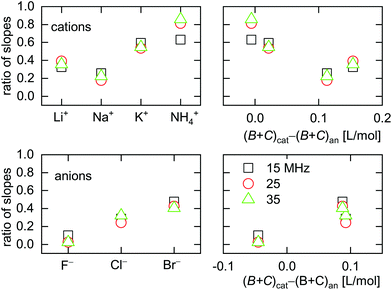 | ||
| Fig. 9 Ratio of slopes 〈A/ΔE〉ΔΓ/(–〈A/ΔE〉Δf) as obtained from ΔΓ and Δf (eqn (13)). Large ratios indicate a large elastic contribution. Cs+ was omitted from this graph because the sign of 〈A/ΔE〉ΔΓ for Cs+ was opposite to the sign of 〈A/ΔE〉ΔΓ for all other ions. | ||
Results and discussion
Correlation of amplitudes with the B- and C-coefficients
Fig. 7 shows voltage-normalized amplitudes for a set of cations (Li+, Na+, K+, NH4+, and Cs+). The common anion was NO3−. The bottom graph shows the same data for a set of anions (F−, Cl−, and Br−), where the common cation was Na+. The different overtones yielded similar results. Mostly, the signals followed Sauerbrey scaling.The right-hand side in Fig. 7 shows the same data plotted versus ∑(Bi + Ci)/zi (see eqn (9)). The dashed blue line shows the prediction from eqn (8) and (9).
Fig. 8 shows the correlations with ∑Bi/zi and ∑Ci/zi, separately. For the cations, the correlation with ∑Bi/zi is better than the correlation with ∑Ci/zi. Viscosity dominates the correlation, rather than density. Had the correlation with density been strong, this would have not ruled out adsorption and desorption, but the correlation is strong with ∑Bi/zi. This points to the diffuse double layer as the locus of changes (liquid-like response). The series of anions does not support the argument to the same extent as the series of cations. For the anions, the correlation with density is better than the correlation with viscosity. This correlation supports adsorption/desorption rather than liquid-like response.
Viscoelasticity
All electrolytes show effects not only in frequency, but also in bandwidth. Bandwidth effects go back to a nonzero η′′, which generates an imaginary component in the contrast function in eqn (3). Evidently, the double layer does display some viscoelasticity. However, the elastic component is smaller than the viscous component (with one exception), meaning that the effects in ΔΓ are smaller than the effects in Δf. This statement can be made quantitative by taking the ratio of the slopes, 〈A/ΔE〉, as derived from either ΔΓ or Δf. This ratio 〈A/ΔE〉ΔΓ/(−〈A/ΔE〉Δf) is shown in Fig. 9. For low ∑(Bi + Ci)/zi, the amplitudes in Δf (which appear in the denominator) are small (see Fig. 7). If the amplitudes in ΔΓ weakly correlate with ∑(Bi + Ci)/zi (which is plausible), the ratio of the two amplitudes is large at low ∑(Bi + Ci)/zi. This explains the trends seen in Fig. 9.Kinetics
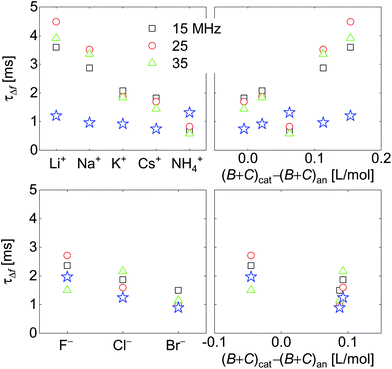
Response times are collected in Fig. 10. Response times are positively correlated with ∑(Bi + Ci)/zi. The blue open stars show the RC-times as inferred from EIS for comparison. There is a slight caveat with respect to the RC-times from EIS because a constant phase-element (a CPE) with a power law exponent of around 0.85 fitted the impedance traces better than a simple capacitance. See the section electrochemical impedance spectroscopy in the ESI† for how this was accounted for.For the anions, the QCM response times largely agree with the response times of the charge as determined by EIS. For the cations, the QCM responds slightly slower than the charge.
Limits of the model
Eqn (3) contains an integral of the viscosity-density profile, not the profile itself. The QCM cannot determine the profile. The profile is complicated, given the complicated structure of the double layer. Not only is there a more rigid and a softer layer (Helmholtz layer and diffuse double layer). Also, the ion concentration is high, ion-specific effects are ubiquitous, the layer is not electroneutral, and even water is oriented and has a dielectric constant different from εbulk. Neither the QCM nor EIS provide structural information. Structural information of this kind has been obtained with X-ray diffraction,54,55 sum-frequency generation,56 vibrational spectroscopy,57 and scanning tunnelling microscopy,58 often supported by molecular modelling. This being admitted, the QCM data are part of a larger picture. The search for more detailed structural models can be guided not only by cyclic voltammetry and EIS, but also by QCM data of the kind reported above.Conclusions
Using multi-frequency lock-in amplification, the QCM can reach a time resolution of down to 100 μs. Voltage modulation and accumulation yield a precision in frequency shift down to 1 mHz. This instrument was applied to the changes in the viscoelasticity of the electric double layer in response to steps of the electrode potential. The changes in frequency were larger than the changes in half bandwidth. Also, –Δf/n was similar on the different overtones. This Sauerbrey-type behaviour can be rooted in either adsorption and desorption (solid-like response) or in changes of the viscosity of the diffuse double layer (liquid-like response). For inert salts following liquid-like response, the changes in frequency and bandwidth are expected to be proportional to the sum of the viscosity B-coefficients and the density C-coefficients. For the series of cations, this expectation is confirmed in experiment. In this case, the correlation is governed by viscosity (by the B-coefficients). For the anions, the situation is less clear. The response times as determined with the QCM are similar to the charge response times as inferred from EIS. Given the correlation with ∑Bi/zi and the fast response, the effects should be attributed to the diffuse double layer (liquid-like response). Deviations from Sauerbrey-type behaviour are seen. There are small effects of viscoelasticity (as evidenced by nonzero ΔΓ) and –Δf/n is not strictly equal on the different overtones. Also, the QCM response is slightly slower than the charge response for the homologous series of cations. A more detailed description of the roles of adsorption, diffusion, viscosity, and viscoelasticity requires structural information to be gained with complementary techniques. The fast QCM contributes to such studies with kinetic information (similar to EIS) and with information on softness and structural relaxations on the time scale of 100 ns.Author contributions
Conceptualization: Johannsmann, D; Leppin, C. Methodology: Johannsmann, D; Leppin, C.; Meyer, F., Software: Johannsmann, D.; Meyer F.; Leppin, C., Validation: Johannsmann, D.; Leppin, C.; Langhoff, A., Formal analysis: Leppin, C.; Johannsmann, D., Investigation: Leppin, C; Peschel, A.; Meyer, F., Resources: Johannsmann, D., Data curation: Leppin, C.; Johannsmann, D., Writing—original draft preparation: Leppin, C.; Johannsmann, D., Writing—Review and Editing: Johannsmann, D.; Langhoff, A.; Leppin, C.; Meyer, F., Visualization: Leppin, C; Johannsmann, D., Supervision: Johannsmann, D; Langhoff, A, Project administration: Johannsmann, D., Funding acquisition: Johannsmann, D. All authors have read and agreed to the published version of the manuscript.Conflicts of interest
There are no conflicts of interest to declare.Acknowledgements
Andreas Böttcher helped with the design of the cells. Contributions by Zuzana Koudelkova in preparatory experiments are gratefully acknowledged. This work was in part funded by the Deutsche Forschungsgemeinschaft (DFG) under contract Jo278-19/1. Grazing incidence X-ray diffraction was undertaken at the Institute of Non-Metallic Materials, TU Clausthal with help by Sven Hampel.Notes and references
- T. Nomura and M. Okuhara, Frequency-Shifts of Piezoelectric Quartz Crystals Immersed in Organic Liquids, Anal. Chim. Acta, 1982, 142(OCT), 281–284 CrossRef CAS.
- T. Nomura and O. Hattori, Determination of Micromolar Concentrations of Cyanide in Solution with a Piezoelectric Detector, Anal. Chim. Acta, 1980, 115(MAR), 323–326 CrossRef CAS.
- L. Daikhin, V. Tsionsky, E. Gileadi and M. Urbakh, Looking At The Metal/Solution Interface With The Electrochemical Quartz Crystal Microbalance: Theory And Experiment, in Electroanalytical Chemistry: A Series of Advances, ed. A. J. Bard and I. Rubinstein, Marcel Dekker Inc, 2003, pp. 1–99 Search PubMed.
- E. J. Martin, K. Sadman and K. R. Shull, Anodic Electrodeposition of a Cationic Polyelectrolyte in the Presence of Multivalent Anions, Langmuir, 2017, 32(31), 7747–7756 CrossRef.
- A. R. Hillman, I. Efimov and K. S. Ryder, Time-scale- and temperature-dependent mechanical properties of viscoelastic poly(3,4-ethylenedioxythlophene) films, J. Am. Chem. Soc., 2005, 127(47), 16611–16620 CrossRef CAS.
- G. Sauerbrey, Verwendung von Schwingquarzen zur Wägung Dünner Schichten und zur Mikrowägung, Z. Phys., 1959, 155(2), 206–222 CrossRef CAS.
- A. Bund and G. Schwitzgebel, Investigations on metal depositions and dissolutions with an improved EQCMB based on quartz crystal impedance measurements, Electrochim. Acta, 2000, 45(22–23), 3703–3710 CrossRef CAS.
- W. W. Lee, H. S. White and M. D. Ward, Depletion Layer Effects on the Response of the Electrochemical Quartz-Crystal Microbalance, Anal. Chem., 1993, 65(22), 3232–3237 CrossRef CAS.
- W. Kautek, M. Sahre and D. M. Soares, In situ-Monitoring of Electrochemical Double-Layer Structure Changes at Gold with a Phase-Controlled Quartz Microbalance, Ber. Bunsen-Ges., 1995, 99(4), 667–676 CrossRef CAS.
- R. Etchenique and T. Buhse, Viscoelasticity in the diffuse electric double layer, Analyst, 2002, 127(10), 1347–1352 RSC.
- P. Kern and D. Landolt, Effect of the diffuse double layer on the interpretation of EQCM results in dilute NaClO4 solutions, J. Electroanal. Chem., 2001, 500(1–2), 170–177 CrossRef CAS.
- G. McHale, R. Lucklum, M. I. Newton and J. A. Cowen, Influence of viscoelasticity and interfacial slip on acoustic wave sensors, J. Appl. Phys., 2000, 88(12), 7304–7312 CrossRef CAS.
- V. Tsionsky, A. Kaverin, L. Daikhin, G. Katz and E. Gileadi, An experimental verification of the possible influence of gas nano-bubbles on the response of an electrochemical quartz crystal microbalance, Phys. Chem. Chem. Phys., 2005, 7(8), 1830–1835 RSC.
- L. Daikhin, E. Gileadi, G. Katz, V. Tsionsky, M. Urbakh and D. Zagidulin, Influence of roughness on the admittance of the quartz crystal microbalance immersed in liquids, Anal. Chem., 2002, 74(3), 554–561 CrossRef CAS.
- A. Peschel, A. Bottcher, A. Langhoff and D. Johannsmann, Probing the electrical impedance of thin films on a quartz crystal microbalance (QCM), making use of frequency shifts and piezoelectric stiffening, Rev. Sci. Instrum., 2016, 87(11), 115002 CrossRef.
- K. E. Heusler, A. Grzegorzewski, L. Jackel and J. Pietrucha, Measurement of Mass and Surface Stress at One Electrode of a Quartz Oscillator, Ber. Bunsen-Ges., 1988, 92(11), 1218–1225 CrossRef CAS.
- M. Rodahl, F. Hook, A. Krozer, P. Brzezinski and B. Kasemo, Quartz-Crystal Microbalance Setup for Frequency and Q-Factor Measurements in Gaseous and Liquid Environments, Rev. Sci. Instrum., 1995, 66(7), 3924–3930 CrossRef CAS.
- R. Beck, U. Pittermann and K. G. Weil, Impedance Analysis of Quartz Oscillators, Contacted on One Side with a Liquid, Ber. Bunsen-Ges., 1988, 92(11), 1363–1368 CrossRef CAS.
- F. Wudy, M. Multerer, C. Stock, G. Schmeer and H. J. Gores, Rapid impedance scanning QCM for electrochemical applications based on miniaturized hardware and high-performance curve fitting, Electrochim. Acta, 2008, 53(22), 6568–6574 CrossRef CAS.
- A. R. Hillman, M. J. Swann and S. Bruckenstein, General-Approach to the Interpretation of Electrochemical Quartz Crystal Microbalance Data .1. Cyclic Voltammetry - Kinetic Subtleties in the Electrochemical Doping of Polybithiophene Films, J. Phys. Chem., 1991, 95(8), 3271–3277 CrossRef CAS.
- C. Hutter, D. Platz, E. A. Tholen, T. H. Hansson and D. B. Haviland, Reconstructing Nonlinearities with Intermodulation Spectroscopy, Phys. Rev. Lett., 2010, 104(5), 050801 CrossRef.
- F. Meyer, A. Langhoff, D. Johannsmann and I. Reviakine, An Ultrafast Quartz Crystal Microbalance Based on A Frequency Comb Approach Delivers Sub-Millisecond Time Resolution, Rev. Sci. Instrum., 2019, 90, 115108 CrossRef.
- A. Gödde, C. Leppin, F. S. Meyer, A. Langhoff, J. Hartl, P. Garidel and D. Johannsmann, Fast pH-mediated changes of the viscosity of protein solutions studied with a voltage-modulated quatz crystal microbalance, Biointerphases, 2020, 15, 021004 CrossRef.
- J. R. T. Seddon, D. Lohse, W. A. Ducker and V. S. J. Craig, A Deliberation on Nanobubbles at Surfaces and in Bulk, ChemPhysChem, 2012, 13(8), 2179–2187 CrossRef CAS.
- X. H. Zhang, Quartz crystal microbalance study of the interfacial nanobubbles, Phys. Chem. Chem. Phys., 2008, 10(45), 6842–6848 RSC.
- V. Tsionsky, L. Daikhin and E. Gileadi, Response of the electrochemical quartz crystal microbalance for gold electrodes in the double-layer region, J. Electrochem. Soc., 1996, 143(7), 2240–2245 CrossRef CAS.
- R. Etchenique and T. Buhse, Anomalous behaviour of the quartz crystal microbalance in the presence of electrolytes, Analyst, 2000, 125(5), 785–787 RSC.
- R. Etchenique and T. Buhse, Viscoelasticity in the diffuse electric double layer, Analyst, 2002, 127(10), 1347–1352 RSC.
- A. Peschel, A. Bottcher, A. Langhoff and D. Johannsmann, Probing the electrical impedance of thin films on a quartz crystal microbalance (QCM), making use of frequency shifts and piezoelectric stiffening, Rev. Sci. Instrum., 2016, 87(11), 115002 CrossRef.
- J. M. Encarnacao, P. Stallinga and G. N. M. Ferreira, Influence of electrolytes in the QCM response: Discrimination and quantification of the interference to correct microgravimetric data, Biosens. Bioelectron., 2007, 22(7), 1351–1358 CrossRef CAS.
- R. Funari, A. Matsumoto, J. R. de Bruyn and A. Q. Shen, Rheology of the Electric Double Layer in Electrolyte Solutions, Anal. Chem., 2020, 92(12), 8244–8253 CrossRef CAS.
- https://openqcm.com/ , downloaded on 12/30/2020.
- A. Domack, O. Prucker, J. Ruhe and D. Johannsmann, Swelling of a polymer brush probed with a quartz crystal resonator, Phys. Rev. E: Stat. Phys., Plasmas, Fluids, Relat. Interdiscip. Top., 1997, 56(1), 680–689 CrossRef CAS.
- H. L. Bandey, S. J. Martin, R. W. Cernosek and A. R. Hillman, Modeling the responses of thickness-shear mode resonators under various loading conditions, Anal. Chem., 1999, 71(11), 2205–2214 CrossRef CAS.
- M. V. Voinova, M. Rodahl, M. Jonson and B. Kasemo, Viscoelastic acoustic response of layered polymer films at fluid-solid interfaces: Continuum mechanics approach, Phys. Scr., 1999, 59(5), 391–396 CrossRef CAS.
- R. Lucklum, C. Behling, R. W. Cernosek and S. J. Martin, Determination of complex shear modulus with thickness shear mode resonators, J. Phys. D: Appl. Phys., 1997, 30(3), 346–356 CrossRef CAS.
- D. Johannsmann, Viscoelastic analysis of organic thin films on quartz resonators, Macromol. Chem. Phys., 1999, 200(3), 501–516 CrossRef CAS.
- M. V. Voinova, M. Jonson and B. Kasemo, ‘Missing mass’ effect in biosensor's QCM applications, Biosens. Bioelectron., 2002, 17(10), 835–841 CrossRef CAS.
- section 10.2, in The Quartz Crystal Microbalance in Soft Matter Research: Fundamentals and Modeling, ed. D. Johannsmann, Springer, 2015 Search PubMed.
- G. Jones and M. Dole, The viscosity of aqueous solutions of strong electrolytes with special reference to barium chloride, J. Am. Chem. Soc., 1929, 51, 2950–2964 CrossRef CAS.
- H. D. B. Jenkins and Y. Marcus, Viscosity B-coefficients of ions in solution, Chem. Rev., 1995, 95(8), 2695–2724 CrossRef CAS.
- H. Falkenhagen, The quantitative boundary law of the viscosity of strong binary electrolytes, Phys. Z., 1931, 32, 745–764 CAS.
- D. F. Parsons, M. Bostrom, P. Lo Nostro and B. W. Ninham, Hofmeister effects: interplay of hydration, nonelectrostatic potentials, and ion size, Phys. Chem. Chem. Phys., 2011, 13(27), 12352–12367 RSC.
- N. Schwierz, D. Horinek, U. Sivan and R. R. Netz, Reversed Hofmeister series-The rule rather than the exception, Curr. Opin. Colloid Interface Sci., 2016, 23, 10–18 CrossRef CAS.
- W. E. Waghorne, Viscosities of electrolyte solutions, Philos. Trans. R. Soc., A, 2001, 359(1785), 1529–1543 CrossRef CAS.
- O. Söhnle and P. Novotny, Densities of aqueous solutions of inorganic substances. Physical Sciences Data 22, Elevier, Amsterdam, 1985 Search PubMed.
- R. Beck, U. Pittermann and K. G. Weil, Impedance Analysis of Quartz Oscillators, Contacted on One Side with a Liquid, Ber. Bunsen-Ges., 1988, 92(11), 1363–1368 CrossRef CAS.
- M. Rodahl, F. Hook, A. Krozer, P. Brzezinski and B. Kasemo, Quartz-Crystal Microbalance Setup for Frequency and Q-Factor Measurements in Gaseous and Liquid Environments, Rev. Sci. Instrum., 1995, 66(7), 3924–3930 CrossRef CAS.
- M. Pax, J. Rieger, R. H. Eibl, C. Thielemann and D. Johannsmann, Measurements of fast fluctuations of viscoelastic properties with the quartz crystal microbalance, Analyst, 2005, 130(11), 1474–1477 RSC.
- S. Bourkane, C. Gabrielli and M. Keddam, Study of Corrosion Processes by Ac Quartz Electrogravimetry, J. Electrochem. Soc., 1988, 135(8), C353–C353 Search PubMed.
- P. Lemaire, O. Sel, D. A. Dalla Corte, A. Iadecola, H. Perrot and J. M. Tarascon, Elucidating the Origin of the Electrochemical Capacity in a Proton-Based Battery HxIrO4 via Advanced Electrogravimetry, ACS Appl. Mater. Interfaces, 2020, 12(4), 4510–4519 CrossRef CAS.
- E. Gileadi, Physical Electrochemistry: Fundamentals, Techniques and Applications, Wiley-VCH, 2011 Search PubMed.
- W. H. Press, S. A. Teukolsky, W. T. Vetterling and B. P. Flannery, Numerical Recipes The Art of Scientific Computing, Cambridge University Press, Cambridge, 2007 Search PubMed.
- H. Keller, M. Saracino, H. M. T. Nguyen and P. Broekmann, Templating the near-surface liquid electrolyte: In situ surface X-ray diffraction study on anion/cation interactions at electrified interfaces, Phys. Rev. B: Condens. Matter Mater. Phys., 2010, 82, 245425 CrossRef.
- M. Nakamura, New insights on structural dynamics of electrochemical interface by time-resolved surface X-ray diffraction, Curr. Opin. Electrochem., 2019, 14, 200–205 CrossRef CAS.
- Z. D. Schultz, S. K. Shaw and A. A. Gewirth, Potential dependent organization of water at the electrified metal-liquid interface, J. Am. Chem. Soc., 2005, 127(45), 15916–15922 CrossRef CAS.
- C. Y. Li, J. B. Le, Y. H. Wang, S. Chen, Z. L. Yang, J. F. Li, J. Cheng and Z. Q. Tian, In situ probing electrified interfacial water structures at atomically flat surfaces, Nat. Mater., 2019, 18(7), 697–701 CrossRef CAS.
- M. Ito, Structures of water at electrified interfaces: Microscopic understanding of electrode potential in electric double layers on electrode surfaces, Surf. Sci. Rep., 2008, 63(8), 329–389 CrossRef CAS.
Footnote |
| † Electronic supplementary information (ESI) available: Fig. S1: Real and imaginary part of the resonance curves; Fig. S2: A typical EIS-spectrum in log–log form; Fig. S3: Amplitudes and response times vs. concentration for NH4NO3; Fig. S4: Inverse response times vs. inverse temperature (NH4NO3); Fig. S5: X-ray diffraction pattern from the electrode surface. See DOI: 10.1039/d0an01965h |
| This journal is © The Royal Society of Chemistry 2021 |

