Revealing the oxygen reduction reaction activity origin of single atoms supported on g-C3N4 monolayers: a first-principles study†
Huan
Niu
 a,
Xiting
Wang
a,
Chen
Shao
a,
Yuanshuang
Liu
b,
Zhaofu
Zhang
a,
Xiting
Wang
a,
Chen
Shao
a,
Yuanshuang
Liu
b,
Zhaofu
Zhang
 *c and
Yuzheng
Guo
*a
aSchool of Electrical Engineering, Wuhan University, Wuhan, Hubei 430072, China. E-mail: yguo@whu.edu.cn
bState Key Laboratory of Tribology, School of Mechanical Engineering, Tsinghua University, Beijing, 10084, China
cDepartment of Engineering, Cambridge University, Cambridge, CB2 1PZ, UK. E-mail: zz389@cam.ac.uk
First published on 11th March 2020
Abstract
Herein, the potential of single transition metal atoms (TM, from Ti to Au) supported on g-C3N4 (TM/g-C3N4) for the oxygen reduction reaction (ORR) was investigated by first-principles calculations. It was demonstrated that the TM atoms can remain stable in the cavity of g-C3N4 and interact with the substrate via charge transfer from the TM atoms to g-C3N4. Among all the TM/g-C3N4 samples, Pd/g-C3N4 stands out with a low overpotential of 0.46 V, showing good performance for ORR; thus, it has great potential to replace the noble Pt catalyst. The ORR activity of TM/g-C3N4 is a function of ΔE*OH (an energy descriptor). Furthermore, the d-band center and ICOHP (electronic structure descriptors) can quantitatively describe the variation trend of ΔE*OH in addition to Bader charge analysis (a charge transfer descriptor). Considering the number of d orbital electrons and the electronegativity of TM, φ (an intrinsic descriptor) can be applied to predict and reveal the origin of the ORR activity. A bridge from intrinsic characteristics to electronic structures, to charge transfer, to electronic structures and then to adsorption energy has been established, which is conducive to better reveal the ORR activity origin and provide guidance for designing effective ORR electrocatalysts.
1. Introduction
With their advantages of high power density and small exhaust emissions, low-temperature fuel cells1 can efficiently convert chemical energy into electric energy.2 As a crucial process in fuel cells, the oxygen reduction reaction (ORR) demands efficient catalysts.3 As conventional electrocatalysts, Pt-based materials are widely employed in ORR owing to their high activity.4–7 However, the high cost, poor stability and low natural abundance of Pt greatly limit the practical applications of these materials. Hence, it is essential to find potential catalysts to decrease the use of Pt-based materials and improve their catalytic efficiency.8–10Accordingly, single-atom catalysts (SACs) have gained ever-increasing interest since Pt/FeOx was prepared in 2011.11 SACs refer to a series of supported metal catalysts, where a metal is monodispersed as a single atom supported on the surface or anchored in the skeleton, such as many metal oxides, including FeOx,11 Al2O3,12 TiO2,13 and CeO2.14 It has become a new frontier in heterogeneous catalysis to maximize the use of active sites. However, the free energy of a metal increases as its sizes decrease. Therefore, it is critical to find proper supports possessing strong interaction with single metal atoms to prevent their aggregation.15
Benefiting from their high specific surface areas and weak van der Waals interactions, 2D materials have become one of the most advantageous candidates for supporting single metal atoms.16 In the past years, 2D materials have been widely used as substrates, such as nitrogen-doped graphene (N-G),17 graphdiyne (GDY),18 C3N,19 and transition metal dichalcogenides (TMDs).20 In addition, graphitic carbon nitride (g-C3N4), as an easy-to-synthesize and low-cost 2D material, has been used for the photocatalytic hydrogen evolution reaction (HER).21,22 To anchor TM atoms, it is essential to create regular vacancies for graphene and h-BN, which is challenging in experiments. In contrast, g-C3N4 possesses evenly distributed holes, which provide abundant nitrogen coordinators with rich electron lone pairs to capture metal atoms in the ligands. Recently, various single transition metals supported on g-C3N4 (TM/g-C3N4) have been experimentally synthesized, such as Co,23 Ni,24 Ru,25 Pd,26 and Pt.27 From a theoretical perspective, it has been found that TM/g-C3N4 can act as potential SACs for CO2 reduction,28 CO oxidation,29 and the N2 reduction reaction (NRR).30 For the application of ORR, He et al.31 and Chen et al.32 reported that a single Pd atom supported on g-C3N4 showed high ORR activity. However, an all-around and in-depth understanding of the origin of the ORR has not been achieved. Thus, it is well worth exploring whether Pd/g-C3N4 is the best ORR electrocatalyst among the TM/g-C3N4, what descriptor can properly describe and even predict the ORR activity of the different metal centres, and where the ORR activity originates from.
In this study, we comprehensively studied the 3d, 4d and 5d single transition metal atoms supported on a buckle g-C3N4 monolayer (TM = Ti, V, Cr, Mn, Fe, Co, Ni, Cu, Zr, Nb, Mo, Ru, Rh, Pd, Ag, Hf, W, Re, Ir, Pt, and Au) to investigate their stability, evaluate their ORR performance, establish proper descriptors, and reveal the origin of their ORR activity by first-principles calculations. The stability of TM supported on g-C3N4 was described by calculating the binding energy and cohesive energy. The overpotentials of all the TM/g-C3N4 were evaluated and Pd/g-C3N4 stood out with the lowest overpotential of 0.46 V. The relationship between the overpotential and the adsorption energy of OH (ΔE*OH) was determined. With the help of the d band theory, pCOHP and Bader charge analysis, our work shed light on the accurate quantitative description of ORR activity trends. Considering the number of d orbital electrons and the electronegativity of TM, a descriptor φ was applied to predict the ORR activity, which revealed the origin of the ORR activity.
2. Computational details
We employed the spin-polarized density functional theory (DFT) method for all calculations, as implemented in the Vienna ab initio Simulation Package (VASP) code.33 The projector-augmented-wave (PAW) basis set34 was adopted to describe the ion–electron interaction with a cut-off energy of 520 eV. The Perdew–Burke–Ernzerhof (PBE) of the generalized gradient approximation (GGA) functional35 was used to treat the exchange–correlation interaction. Γ-Centred 5 × 5 × 1 and 11 × 11 × 1 k-points grids were chosen for optimization and electronic structure calculations, respectively. The convergence tolerance of energy and force was 10−5 eV and 0.01 eV Å−1. DFT+U calculation was performed with U = 4.0 eV and J = 1.0 eV to consider the Coulomb interaction effect on all the screened TM.36,37 The similar magnetic ground states for the TM atoms (Fig. S1†) and similar adsorption energies of the ORR intermediates (Table S1†) indicate that the DFT method is acceptable in this work. The van der Waals interactions were described by the empirical correction in Grimme's scheme (DFT-D3).38 A 20 Å thickness vacuum was inserted to eliminate the interaction induced by a periodic boundary condition. Bader charge population analysis was employed to analysis the charge population and electron transfer.39 To evaluate the kinetic stability, the climbing image nudged elastic band (CI-NEB) method was used to calculate the diffusion energy barrier of the TM atoms on g-C3N4.40Ab initio molecular dynamics (AIMD) simulations were conducted to evaluate the thermodynamic stability of the catalysts.41 We employed the projected crystal orbital Hamilton population (pCOHP) to reveal the interaction between TM/g-C3N4 and the ORR intermediates.42–44 VASPKIT, a pre- and post-processing tool in the VASP code, was adopted to manage the electronic structures.45The adsorption energies of the OxHy species (ΔE*OxHy) involved in the ORR (O2, OOH, O, OH and H2O) on the substrates were determined by46
 | (1) |
The free energies in the electrochemical reaction pathways were calculated based on the computational hydrogen electrode (CHE) model proposed by Nørskov and co-workers.47 The change in the Gibbs free energy (ΔG) for each reaction step is given as follows:
| ΔG = ΔE + ΔZPE − TΔS + ΔU + ΔpH | (2) |
![[thin space (1/6-em)]](https://www.rsc.org/images/entities/char_2009.gif) ln
ln![[thin space (1/6-em)]](https://www.rsc.org/images/entities/char_2009.gif) 10 × pH, and the pH value is zero in this work. ΔeU = −eU, where e and U are the number of electrons transferred and the applied electrode potential, respectively. The potential-determining step (PDS) is the step with the most unfavourable equilibrium potential. The theoretical overpotential ηORR is defined as:
10 × pH, and the pH value is zero in this work. ΔeU = −eU, where e and U are the number of electrons transferred and the applied electrode potential, respectively. The potential-determining step (PDS) is the step with the most unfavourable equilibrium potential. The theoretical overpotential ηORR is defined as:| ηORR = max(ΔG1, ΔG2, ΔG3, ΔG4)/e + 1.23 | (3) |
3. Results and discussion
3.1 Stability of TM supported on g-C3N4
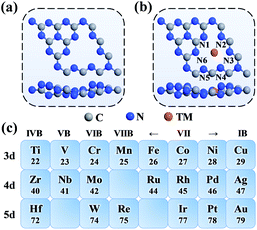
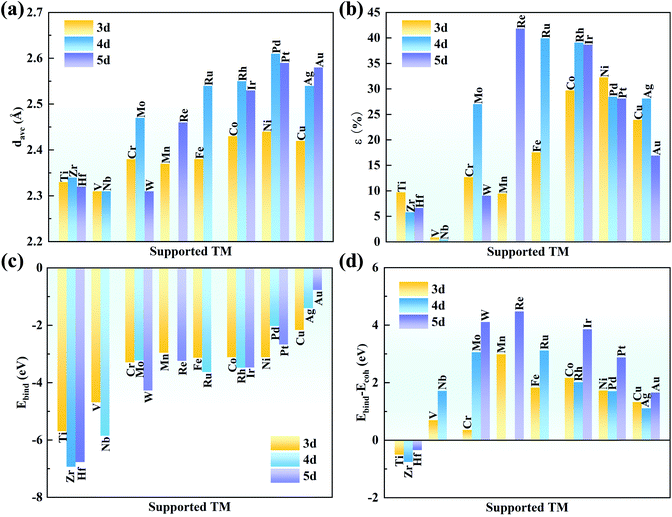
As shown in Fig. 1a, the g-C3N4 monolayer has a buckle structure with a lattice constant of 6.95 Å, which is more stable and more reasonable than the planar model (Fig. S2†).49,50 We focused on the TM embedded in the g-C3N4 cavity (Fig. 1b), which is a suitable site to stabilize TM atoms.51 To comprehensively understand the effect of the TM centres on the ORR activity, a series of 3d, 4d, and 5d transition metals were considered, as shown in Fig. 1c.With an increase in atomic number, the average bond length (dave) gradually increases, indicating protrusion from the cavity (Fig. 2a). The bond lengths between the TM atoms and neighboring N atoms are listed in Table S3.† The deviation degree (ε) between the TM atoms and the cavity centre can be defined as:
 | (4) |
The strong binding can prevent the aggregation of single TM atoms on the substrate. The binding strength of the TM on the g-C3N4 monolayer was calculated to compare their structural stability. The binding energies (ΔEbind) of the metal atoms on g-C3N4 and the TM bulk cohesive energy (ΔEcoh) are defined as
| ΔEbind = ETM/g-C3N4 − Eg-C3N4 − ETM-single | (5) |
| ΔEcoh = ETM/bulk/N − ETM-single | (6) |
Actually, clustering on the surface is unfavourable where ΔEbind − ΔEcoh is negative. However, even if the value is positive, the TM atoms are stable on the substrate when the diffusion barrier is high enough to prevent aggregation, which is due to the kinetic stability of SACs.53–55 As shown in Fig. 2d, the values of ΔEbind − ΔEcoh are −0.50, −0.75, and −0.34 eV for Ti, Zr and Hf, respectively, indicating their spontaneous dispersion in the cavities of g-C3N4. For the other transition metals, their values are slightly higher, indicating the risk of clustering on g-C3N4. The diffusion barriers of Mn, Mo, Ru, W, Re, Ir and Pt were examined by CI-NEB because of their very positive ΔEbind − ΔEcoh values (>∼3 eV). As listed in Table S4,† the energy barriers are as high as 2.48, 2.67, 2.11, 3.50, 2.54, 2.30 and 1.93 eV for Mn, Mo, Ru, W, Re, Ir and Pt, respectively. These large energy barriers suggest that these single TM atoms can remain in the cavity of g-C3N4 steadily.
Furthermore, the binding energy of the dimer TM was calculated. As shown in Table S5,† the ΔEbind values are more negative than ΔEbind2 for Mn, Mo, Ru, W, Re, Ir and Pt. Thus, single TM atoms are reasonably stable on the g-C3N4 substrate owing to the difficult formation of dimer TM. In addition, the AIMD simulation was performed at 500 K for 10 ps to illustrate their thermal stability. As seen in Fig. S3,† the energy and temperature oscillate within small ranges for Mn, Mo, Ru, W, Re, Ir and Pt/g-C3N4 during the period of AIMD simulation. Furthermore, these systems undergo further structural relaxation after the AIMD, and the final relaxed structures are almost the same with the initial structures. Hence, it is believed that TM/g-C3N4 will show high stability in real applications, in agreement with the observation in experiments.25,27
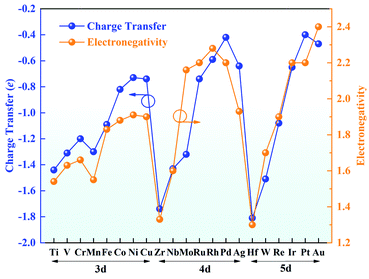
Bader charge analysis was conducted to gain insight into the valence states of the TM atoms (Fig. 3). The charge transfer from the TM atom to g-C3N4 leaves the TM atoms with positive charges, indicating a strong interaction between the TM atoms and g-C3N4. The amount of charge transfer decreases from left to right in each period, in good agreement with the trend of electronegativity. Hf possesses a charge transfer of 1.81e with the lowest electronegativity of 1.30, while the charge transfer of Au is reduced to 0.47e, and its electronegativity is 2.40. Furthermore, the positive charges on the TM atoms are beneficial for adsorbing ORR intermediates, which can effectively promote the ORR.
3.2 Adsorption of ORR species on TM/g-C3N4
The adsorption of O2 on the catalyst is the first step for the effective ORR. Thus, we have examined the adsorption of O2 on TM/g-C3N4 by considering the side-on and end-on configurations. Taking Ti and Au as examples, the side-on configuration of O2 adsorbed on Ti/g-C3N4 and the end-on configuration of O2 adsorbed on Au/g-C3N4 are shown in Fig. S4.† Apparently, O2 prefers the end-on configuration with weaker adsorption on Cu, Ag and Au/g-C3N4, while the side-on configuration of O2 is more favourable on the other TM/g-C3N4. The adsorption energies and bond lengths of O2 on all the TM/g-C3N4 are listed in Table S6.† The adsorption energies of O2 range from −4.80 to −0.46 eV with the TM–O bond lengths ranging from 1.79 to 2.14 Å. In addition, compared with Cu, Ag, and Au/g-C3N4, the distances of the O–O bond are longer for the other TM/g-C3N4, signifying that the O2 molecule is readily dissociated.Combined with the TM atoms, OOH, O and OH are strongly adsorbed on the substrates. The adsorption energies and bond lengths of the various ORR intermediates (OOH, O, OH and H2O) are shown in Table S7–S10.† It should be noted that OOH dissociates into O and OH when absorbed on Ti, V, Zr, Nb, Mo, Hf, Re, and W/g-C3N4 because of the quite strong absorption of O and OH, indicating that they may not have good ORR performances. The configurations of the dissociated OOH adsorbed on Ti/g-C3N4 and undissociated OOH adsorbed on Au/g-C3N4 are shown in Fig. S5† as examples. There is a nearly linear relationship between ΔE*O and ΔE*OH as well as between ΔE*OOH and ΔE*OH, as seen in Fig. 4. ΔE*O can be expressed as a function of ΔE*OH by ΔE*O = 2.40ΔE*OH + 2.06, with a coefficient of determination (R2) of 0.84. Similarly, the correlation between ΔE*OOH and ΔE*OH can be described as ΔE*OOH = 0.89ΔE*OH + 3.16 and ΔE*OOH = 0.72ΔE*OH − 1.37 for the un-dissociated and dissociated OOH with R2 equals 0.94 for both cases. This result validates the previous study on metals56 and graphene,57 again demonstrating that catalysts possessing strong adsorption of OH are likely to show strong adsorption of O and OOH. Different from the OOH, O and OH above, with adsorption energies lower than −1.00 eV, the adsorbed H2O cannot bind tightly to most of the substrates, thus H2O can easily drift away from the TM/g-C3N4 surfaces, which guarantees the recovery of the catalysts.
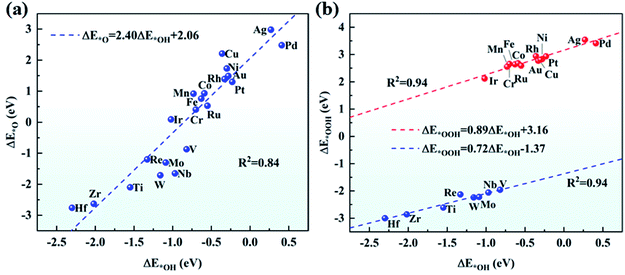 | ||
| Fig. 4 Scaling relationship (a) between ΔE*O and ΔE*OH, and (b) between ΔE*OOH and ΔE*OH on TM/g-C3N4. | ||
To prove the reliability of using a unit cell of g-C3N4, the adsorption energies of the OOH, O, and OH intermediates on a 2 × 2 × 1 g-C3N4 supercell with a single Pd atom are listed in Table S11† and compared with a g-C3N4 unit cell. The results show a negligible difference between the 2 × 2 × 1 supercell and unit cell of g-C3N4, indicating that it is acceptable to use a unit cell of g-C3N4.
3.3 Evaluation of ORR performance
In general, there are two pathways for the ORR process, the four-electron pathway and the two-electron pathway, distinguished by the final product of H2O or H2O2, respectively.58 By examining the adsorption of H2O2 on TM/g-C3N4, we found that H2O2 cannot be stably absorbed on TM/g-C3N4. Based on this, the two-electron pathway is excluded, and the four-electron pathway is the preferred to process on TM/g-C3N4 in an acid environment. The four steps in detail are: (1) O2 adsorbing on the surface of TM/g-C3N4 and reacting with H+ to form *OOH; (2) *OOH reacting with H+ and generating H2O and *O; (3) *O combining with H+ and forming *OH; and (4) the final product of H2O and the H2O molecule being released from the TM/g-C3N4 surface.The free energy of each reaction step was calculated for all the TM/g-C3N4 catalysts to obtain the PDS and overpotentials. The overpotentials for all the TM supported on g-C3N4 are summarized in Fig. 5a. Nørskov and co-workers illustrated that the ORR overpotential of Pt(111) is 0.45 V, which is close to the experimental observation.56 The overpotentials of Pd/g-C3N4 and Ag/g-C3N4 are 0.46 V and 0.60 V, respectively, which are close to that of Pt(111), indicating that they are potential substitutes of Pt(111), especially Pd/g-C3N4. Moreover, the 0.46 V overpotential value for Pd/g-C3N4 is lower than that in previous studies, such as Fe-Pc (0.68 V),59 Fe-Pp (0.77 V),60 CoN4-gra (0.47 V)61 and Co/BN (0.82 V),62 proving a better ORR performance with g-C3N4 as the support. The free energy changes in each step on all the TM/g-C3N4 are shown in Table S12.† Obviously, the PDS is the last step for most of the TM/g-C3N4, except for V (the second step, from *OOH to *O), Nb and W/g-C3N4 (the third step, from *O to *OH). The free energy diagrams of Pd/g-C3N4 are shown in Fig. 5b, and that of the other TM atoms supported on g-C3N4 are shown in Fig. S6–S8† for clarity. Obviously, the diagrams of Ti, V, Zr, Nb, Mo, Hf, W and Re/g-C3N4 are different from the other TM/g-C3N4 because of the dissociated OOH, which leads to a high overpotential. The structures of the ORR intermediates (O2, OOH, O, OH and H2O) adsorbed on Pd/g-C3N4 can be found in Fig. 5c. However, besides Pd/g-C3N4 and Ag/g-C3N4, none of the remaining TM/g-C3N4 have catalytic ORR activity because of their large overpotential of more than 1.00 V. Thus, these catalysts were not further considered as potential ORR catalysts.
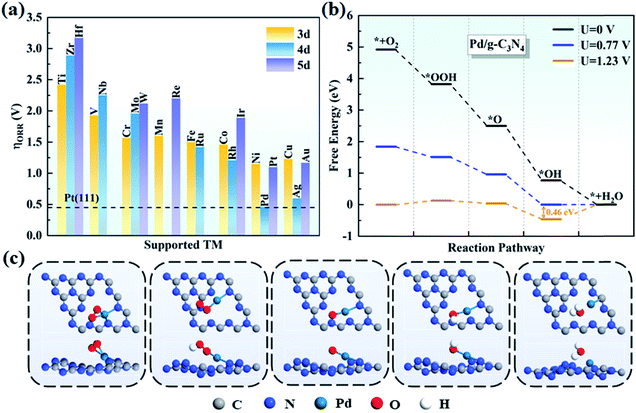 | ||
| Fig. 5 (a) Summary of the ORR overpotentials for TM supported on g-C3N4. (b) Free energy diagrams for the ORR on Pd/g-C3N4 and (c) corresponding atomic configurations of ORR species on Pd/g-C3N4. | ||
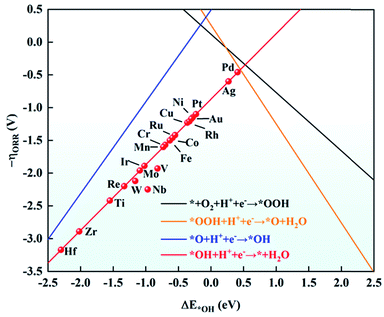
As mentioned above, the adsorption energies of OH have a scaling relationship with OOH and O. Based on this, ΔE*OH was chosen as a descriptor to explore the ORR activity on TM/g-C3N4. The relationship between the negative ORR overpotential (−ηORR) and ΔE*OH is established in Fig. 6. According to the Sabatier principle,63 intermediates adsorbed on the TM too strongly and too weakly can both discourage the catalytic process. The intermediates will poison the electrode surface if they are adsorbed too strongly, thus the proton–electron cannot transfer from TM to the intermediates. However, the results revealed the strong adsorption of the ORR species on TM/g-C3N4, indicating the risk of deactivation. Among the TM/g-C3N4, Pd/g-C3N4 is the closest to the top of the volcano plot, where the lowest ORR overpotential was calculated to be 0.42 V, suggesting that it is the closest catalyst to the theoretical minimum of the ORR overpotential.
3.4 Origin of ORR activity trend
To better understand the origin of the ORR activity trend, we chose the 4d metals, where Pd and Ag are included, for comprehensive analysis. During the catalytic process, the adsorption strength of intermediates can be modulated by different TM atoms supported on g-C3N4. Taking the adsorption of OH as an example, the adsorption strength between OH and TM on TM/g-C3N4 can be demonstrated by the bond formation, as illustrated in Fig. S9.† To reveal the role of the different TM centres, the d-band centre (εd) of TM/g-C3N4 was calculated as follows:64 | (7) |
In Fig. 7a, as the d orbital occupation increases, εd of the 4d TM atoms become more negative relative to the Fermi level (EF). A more negative εd usually implies weaker adsorption of the ORR species. Thus, the positive εd of Zr and Nb indicate the strong adsorption of the intermediates. However, for Mo, Ru, Rh, Pd and Ag, εd shifts to the left of EF, and thus the adsorption of the intermediates become weaker. The relationship between εd and ΔE*OH is presented in Fig. 7b. The good correlation coefficient (R2 = 0.80) indicates that the d-band centre can serve as a great descriptor to accurately illustrate the trend of ΔE*OH on TM/g-C3N4. However, the d-band center is not associated with the adsorption energy for a specific TM in a small range due to the neglect of the d-band shape and the effect of the TM-sp orbitals (Fig. S10†).65,66
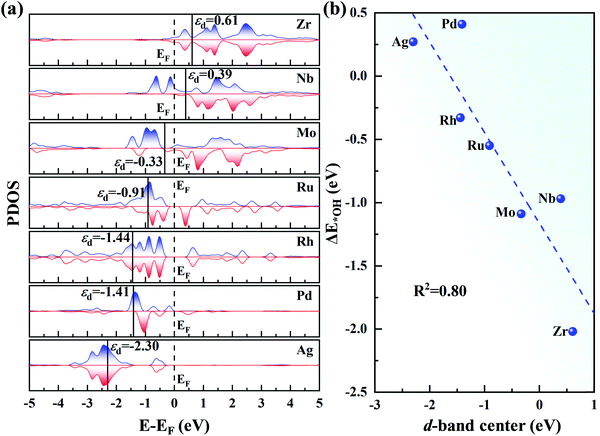 | ||
| Fig. 7 (a) Partial density of states of the 4d TM atoms on g-C3N4, where EF denotes the Fermi level and is set to zero. (b) Relationship between the d-band centre of TM/g-C3N4 and ΔE*OH. | ||
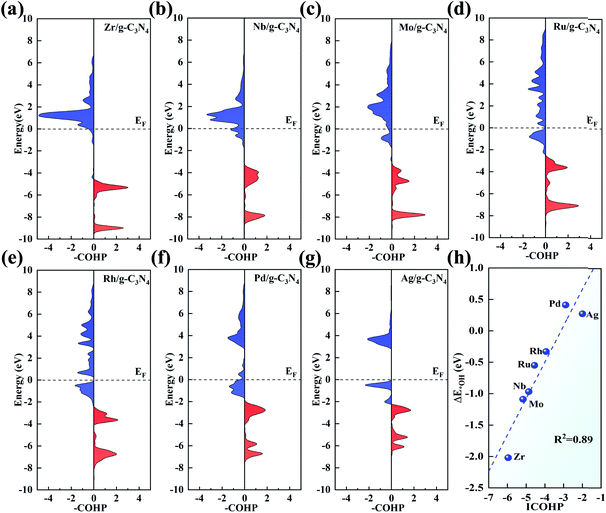
pCOHP was employed to analyse the bonding and antibonding states of the OH intermediate absorbed on the TM centre. From Zr to Ag, there is a trend that the filling of the antibonding orbital population increases and the energies of the bonding states move up to EF, in accordance with the variation in adsorption strength of the intermediates. To give a more quantitative explanation, the integrated COHP (ICOHP) was calculated by integrating the energy up to EF. Interestingly, there is a good linear relationship between ICOHP and ΔE*OH values (with R2 = 0.89, Fig. 8h). This linear correlation quantitatively reveals the role of different metal centres in the bonding/antibonding orbital populations, which accounts for the observed trend of ΔE*OH above.
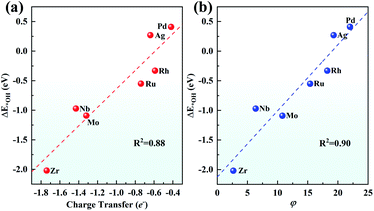
Although both the d-band centre and pCOHP explain the origin of the ORR activity trend well, it is still to be solved whether a better descriptor can be found to give an easier and more thorough explanation and even predict the ORR activity. Considering that the charge transfer of TM has been used to prove the performance of SAC,67 the relationship between the Bader charge transfer of the TM and the OH adsorption energy was further explored. As seen in Fig. 9a, Zr with the most positive charge of 1.74e shows the largest ΔE*OH of −2.02 eV among the 4d metals, while Pd loses 0.42e with the ΔE*OH of 0.41 eV. There is a linear relationship between the charge transfer of the TM and the OH adsorption energy with a fine correlation coefficient (R2 = 0.88), indicating that a more positive charge on the TM atom leads to more strongly adsorbing ORR intermediates, which gives evidence of the ORR origin from a new point of view.
Furthermore, inspired by the recent study of a universal descriptor to predict the ORR/OER/HER activities for graphene-based SACs,45 the descriptor φ to predict the ORR activities of TM/g-C3N4 considering the number of d orbital electron (θd) and the electronegativity of TM (ETM) is proposed as follows:
| φ = θd × ETM | (8) |
As shown in Fig. 9b, with θd multiplied by ETM, φ correlates linearly with ΔE*OH quite well with R2 = 0.90. This indicates that the adsorption strength of OH and the other intermediates can be easily estimated by basic characteristics rather than complex DFT calculations.
Moreover, we investigated all the TM screened in our study to evaluate whether these descriptors can be applied more broadly. As shown in Fig. S11,† there is a linear relationship for ΔE*OHversus d-band center, ICOHP, charge transfer and φ with R2 = 0.67, 0.77, 0.73 and 0.69, respectively. Thus, our results validate these descriptors can be used not only in a period but also for all TM. As shown in Fig. 10, on one hand, ΔE*OH can serve as a facial descriptor of ORR activity; on the other hand, εd, ICOHP, Bader charge transfer and φ give a quantitative description of ΔE*OH. Hence, it is systematically concluded that the ORR activity is intrinsically determined by the φ of TM atoms. The different φ leads to a different positive charge of TM atoms, resulting in a variation in electronic structures, such as bonding/antibonding orbital population and d-band centre. The electronic structures can further impact the adsorption strength of intermediates and reflect the ORR activity.
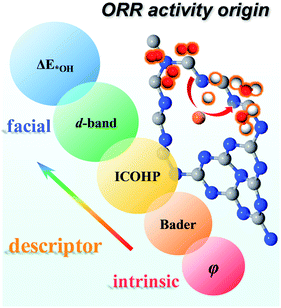 | ||
| Fig. 10 Descriptors of the ORR activity origin, including ΔE*OH, d-band centre, ICOHP, Bader charge transfer and φ. | ||
4. Conclusions
In conclusion, we revealed that single transition metal atoms supported on g-C3N4 can serve as promising high activity catalysts for the ORR by means of systematic first-principles calculations. Our detailed screening of a series of TM elements indicates that TM single atoms and g-C3N4 strongly combine, with charge transfer from the TM atoms toward g-C3N4. With a favourable ORR overpotential of 0.46 V, Pd/g-C3N4 demonstrates the highest performance among the TM/g-C3N4. Therefore, it is a potential competitive candidate for replacing the noble Pt catalyst. Furthermore, based on the scaling relationship between the adsorption energy of the ORR intermediates, ΔE*OH can serve as an energy descriptor to reflect the ORR activity of TM/g-C3N4. The variation trend of ΔE*OH on TM/g-C3N4 can be properly described by the d-band center, ICOHP and charge transfer. An intrinsic descriptor φ involving θd and ETM can be applied to predict the ORR activity. The multiple-level descriptors including basic characteristics, charge transfer, electronic structures and energy will provide greater insight to reveal the ORR activity mechanisms and improving the ORR activities of SACs.Conflicts of interest
There are no conflicts to declare.Acknowledgements
This work is supported by Wuhan University. The numerical calculations in this paper have been done on the supercomputing system in the Supercomputing Centre of Wuhan.References
- M. Winter and R. J. Brodd, Chem. Rev., 2004, 104, 4245–4270 CrossRef CAS.
- W. Xia, A. Mahmood, Z. Liang, R. Zou and S. Guo, Angew. Chem., Int. Ed., 2016, 55, 2650–2676 CrossRef CAS PubMed.
- Y. Jiao, Y. Zheng, M. Jaroniec and S. J. Qiao, J. Am. Chem. Soc., 2014, 136, 4394–4403 CrossRef CAS.
- V. R. Stamenkovic, B. S. Mun, M. Arenz, K. J. Mayrhofer, C. A. Lucas, G. Wang, P. N. Ross and N. M. Markovic, Nat. Mater., 2007, 6, 241 CrossRef CAS PubMed.
- N. Tian, Z. Zhou, S. Sun, Y. Ding and Z. Wang, Science, 2007, 316, 732–735 CrossRef CAS.
- C. Wang, H. Daimon, T. Onodera, T. Koda and S. Sun, Angew. Chem., Int. Ed., 2008, 47, 3588–3591 CrossRef CAS.
- J. Wu and H. Yang, Acc. Chem. Res., 2013, 46, 1848–1857 CrossRef CAS.
- A. Brouzgou, S. Song and P. Tsiakaras, Appl. Catal., B, 2012, 127, 371–388 CrossRef CAS.
- W. Liang, J. Chen, Y. Liu and S. Chen, ACS Catal., 2014, 4, 4170–4177 CrossRef CAS.
- X. Zhao, X. Liu, B. Huang, P. Wang and Y. Pei, J. Mater. Chem. A, 2019, 7, 24583–24593 RSC.
- B. Qiao, A. Wang, X. Yang, L. F. Allard, Z. Jiang, Y. Cui, J. Liu, J. Li and T. Zhang, Nat. Chem., 2011, 3, 634 CrossRef CAS.
- T. K. Ghosh and N. N. Nair, ChemCatChem, 2013, 5, 1811–1821 CrossRef CAS.
- P. Liu, Y. Zhao, R. Qin, S. Mo, G. Chen, L. Gu, D. M. Chevrier, P. Zhang, Q. Guo and D. Zang, Science, 2016, 352, 797–800 CrossRef CAS.
- J. Jones, H. Xiong, A. T. DeLaRiva, E. J. Peterson, H. Pham, S. R. Challa, G. Qi, S. Oh, M. H. Wiebenga and X. I. P. Hernández, Science, 2016, 353, 150–154 CrossRef CAS.
- B. Zhang, T. Fan, N. Xie, G. Nie and H. Zhang, Adv. Sci., 2019, 6, 1901787 CrossRef CAS.
- K. C. Kwon, J. M. Suh, R. S. Varma, M. Shokouhimehr and H. W. Jang, Small Methods, 2019, 3, 1800492 CrossRef.
- Y. Zhu, W. Sun, J. Luo, W. Chen, T. Cao, L. Zheng, J. Dong, J. Zhang, M. Zhang and Y. Han, Nat. Commun., 2018, 9, 3861 CrossRef.
- H. Yu, Y. Xue, B. Huang, L. Hui, C. Zhang, Y. Fang, Y. Liu, Y. Zhao, Y. Li and H. Liu, iScience, 2019, 11, 31–41 CrossRef CAS.
- Y. Zhou, G. Gao, J. Kang, W. Chu and L. W. Wang, J. Mater. Chem. A, 2019, 7, 12050–12059 RSC.
- N. Xuan, J. Chen, J. Shi, Y. Yue, P. Zhuang, K. Ba, Y. Sun, J. Shen, Y. Liu and B. Ge, Chem. Mater., 2018, 31, 429–435 CrossRef.
- X. Wang, K. Maeda, A. Thomas, K. Takanabe, G. Xin, J. M. Carlsson, K. Domen and M. Antonietti, Nat. Mater., 2009, 8, 76–80 CrossRef CAS PubMed.
- X. Zhang, T. Peng, L. Yu, R. Li, Q. Li and Z. Li, ACS Catal., 2014, 5, 504–510 CrossRef.
- P. Huang, J. Huang, S. A. Pantovich, A. D. Carl, T. G. Fenton, C. A. Caputo, R. L. Grimm, A. I. Frenkel and G. Li, J. Am. Chem. Soc., 2018, 140, 16042–16047 CrossRef CAS PubMed.
- S. Ohn, S. Y. Kim, S. K. Mun, J. Oh, Y. J. Sa, S. Park, S. H. Joo, S. J. Kwon and S. Park, Carbon, 2017, 124, 180–187 CrossRef CAS.
- S. Tian, Z. Wang, W. Gong, W. Chen, Q. Feng, Q. Xu, C. Chen, C. Chen, Q. Peng and L. Gu, J. Am. Chem. Soc., 2018, 140, 11161–11164 CrossRef CAS.
- E. Vorobyeva, Z. Chen, S. Mitchell, R. K. Leary, P. Midgley, J. M. Thomas, R. Hauert, E. Fako, N. López and J. Pérez-Ramírez, J. Mater. Chem. A, 2017, 5, 16393–16403 RSC.
- X. Li, W. Bi, L. Zhang, S. Tao, W. Chu, Q. Zhang, Y. Luo, C. Wu and Y. Xie, Adv. Mater., 2016, 28, 2427–2431 CrossRef CAS.
- G. Gao, Y. Jiao, E. R. Waclawik and A. Du, J. Am. Chem. Soc., 2016, 138, 6292–6297 CrossRef CAS PubMed.
- S. L. Li, H. Yin, X. Kan, L. Y. Gan, U. Schwingenschlögl and Y. Zhao, Phys. Chem. Chem. Phys., 2017, 19, 30069–30077 RSC.
- Z. Chen, J. Zhao, C. R. Cabrera and Z. Chen, Small Methods, 2018, 3, 1800368 CrossRef.
- F. He, K. Li, C. Yin, Y. Wang, H. Tang and Z. Wu, Carbon, 2017, 114, 619–627 CrossRef CAS.
- X. Chen and R. Hu, Int. J. Hydrogen Energy, 2019, 44, 15409–15416 CrossRef CAS.
- G. Kresse and J. Furthmüller, Comput. Mater. Sci., 1996, 6, 15–50 CrossRef CAS.
- P. E. Blöchl, Phys. Rev. B: Condens. Matter Mater. Phys., 1994, 50, 17953 CrossRef.
- J. P. Perdew, K. Burke and M. Ernzerhof, Phys. Rev. Lett., 1996, 77, 3865 CrossRef CAS PubMed.
- J. Zhou and Q. Sun, J. Am. Chem. Soc., 2011, 133, 15113–15119 CrossRef CAS PubMed.
- X. Zhang, Z. Bao, X. Ye, W. Xu, Q. Wang and Y. Liu, Nanoscale, 2017, 9, 11231 RSC.
- S. Grimme, J. Comput. Chem., 2006, 27, 1787–1799 CrossRef CAS PubMed.
- W. Tang, E. Sanville and G. Henkelman, J. Phys.: Condens. Matter, 2009, 21, 084204 CrossRef CAS.
- G. Henkelman, B. P. Uberuaga and H. Jónsson, J. Chem. Phys., 2000, 113, 9901 CrossRef CAS.
- S. Nosé, J. Chem. Phys., 1984, 81, 511–519 CrossRef.
- R. Dronskowski and P. E. Blöchl, J. Phys. Chem., 1993, 97, 8617–8624 CrossRef CAS.
- V. L. Deringer, A. L. Tchougréeff and R. Dronskowski, J. Phys. Chem. A, 2011, 115, 5461–5466 CrossRef CAS.
- S. Maintz, V. L. Deringer, A. L. Tchougréeff and R. Dronskowski, J. Comput. Chem., 2016, 37, 1030–1035 CrossRef CAS.
- V. Wang, N. Xu, J. C. Liu, G. Tang and W. Geng, 2019, arXiv: 1908.08269.
- I. C. Man, H. Y. Su, F. Calle-Vallejo, H. A. Hansen, J. I. Martínez, N. G. Inoglu, J. Kitchin, T. F. Jaramillo, J. K. Nørskov and J. Rossmeisl, ChemCatChem, 2011, 3, 1159–1165 CrossRef CAS.
- J. K. Nørskov, T. Bligaard, A. Logadottir, J. Kitchin, J. G. Chen, S. Pandelov and U. Stimming, J. Electrochem. Soc., 2005, 152, J23–J26 CrossRef.
- H. Xu, D. Cheng, D. Cao and X. C. Zeng, Nat. Catal., 2018, 1, 339 CrossRef CAS.
- H. Z. Wu, L. M. Liu and S. J. Zhao, Phys. Chem. Chem. Phys., 2014, 16, 3299–3304 RSC.
- Q. Gao, S. Hu, Y. Du and Z. Hu, J. Mater. Chem. A, 2017, 5, 4827–4834 RSC.
- Y. Zheng, Y. Jiao, Y. Zhu, Q. Cai, A. Vasileff, L. H. Li, Y. Han, Y. Chen and S. Z. Qiao, J. Am. Chem. Soc., 2017, 139, 3336–3339 CrossRef CAS PubMed.
- H. Li, Y. Wu, L. Li, Y. Gong, L. Niu, X. Liu, T. Wang, C. Sun and C. Li, Appl. Surf. Sci., 2018, 457, 735–744 CrossRef CAS.
- J. C. Liu, Y. Tang, Y. Wang, T. Zhang and J. Li, Natl. Sci. Rev., 2018, 5, 638–641 CrossRef CAS.
- C. Liu, Q. Li, J. Zhang, Y. Jin, D. R. MacFarlane and C. Sun, J. Mater. Chem. A, 2019, 7, 4771–4776 RSC.
- X. Lv, W. Wei, H. Wang, B. Huang and Y. Dai, Appl. Catal., B, 2020, 264, 118521 CrossRef.
- J. K. Nørskov, J. Rossmeisl, A. Logadottir, L. Lindqvist, J. R. Kitchin, T. Bligaard and H. Jonsson, J. Phys. Chem. B, 2004, 108, 17886–17892 CrossRef.
- F. Calle-Vallejo, J. I. Martinez and J. Rossmeisl, Phys. Chem. Chem. Phys., 2011, 13, 15639–15643 RSC.
- A. Kulkarni, S. Siahrostami, A. Patel and J. K. Nørskov, Chem. Rev., 2018, 118, 2302–2312 CrossRef CAS.
- Y. Wang, H. Yuan, Y. Li and Z. Chen, Nanoscale, 2015, 7, 11633–11641 RSC.
- G. Luo, Y. Wang and Y. Li, Sci. Bull., 2017, 62, 1337–1343 CrossRef CAS.
- X. Zhang, Z. Yang, Z. Lu and W. Wang, Carbon, 2018, 130, 112–119 CrossRef CAS.
- C. Deng, R. He, W. Shen, M. Li and T. Zhang, Phys. Chem. Chem. Phys., 2019, 21, 6900–6907 RSC.
- G. Rothenberg, Catalysis: concepts and green applications, John Wiley & Sons, 2017 Search PubMed.
- A. Ruban, B. Hammer, P. Stoltze, H. L. Skriver and J. K. Nørskov, J. Mol. Catal. A: Chem., 1997, 115, 421–429 CrossRef CAS.
- H. Xin, A. Vojvodic, J. Voss, J. K. Nørskov and F. Abild-Pedersen, Phys. Rev. B: Condens. Matter Mater. Phys., 2014, 89, 115114 CrossRef.
- X. Liu, Y. Jiao, Y. Zheng, M. Jaroniec and S. Z. Qiao, J. Am. Chem. Soc., 2019, 141, 9664–9672 CrossRef CAS PubMed.
- L. Li, X. Wang, H. Guo, G. Yao and L. Chen, Small Methods, 2019, 3, 1900337 CrossRef CAS.
Footnote |
| † Electronic supplementary information (ESI) available. See DOI: 10.1039/d0ta00794c |
| This journal is © The Royal Society of Chemistry 2020 |

