 Open Access Article
Creative Commons Attribution 3.0 Unported Licence
An experimentally validated neural-network potential energy surface for H-atom on free-standing graphene in full dimensionality†
Sebastian
Wille
ab,
Hongyan
Jiang
 a,
Oliver
Bünermann
 cd,
Alec M.
Wodtke
 acd,
Jörg
Behler
 bd and
Alexander
Kandratsenka
 *a
*a
aDepartment of Dynamics at Surfaces, Max-Planck-Institute for Biophysical Chemistry, Am Faßberg 11, 37077 Göttingen, Germany. E-mail: akandra@mpibpc.mpg.de
bInstitute for Physical Chemistry, Theoretische Chemie, Georg-August University of Göttingen, Tammannstraße 6, 37077 Göttingen, Germany
cInstitute for Physical Chemistry, Georg-August University of Göttingen, Tammann-straße 6, 37077 Göttingen, Germany
dInternational Center for Advanced Studies of Energy Conversion, Georg-August University of Göttingen, Tammannstraße 6, 37077 Göttingen, Germany
First published on 4th September 2020
Abstract
We present a first principles-quality potential energy surface (PES) describing the inter-atomic forces for hydrogen atoms interacting with free-standing graphene. The PES is a high-dimensional neural network potential that has been parameterized to 75![[thin space (1/6-em)]](https://www.rsc.org/images/entities/char_2009.gif) 945 data points computed with density-functional theory employing the PBE-D2 functional. Improving over a previously published PES [Jiang et al., Science, 2019, 364, 379], this neural network exhibits a realistic physisorption well and achieves a 10-fold reduction in the RMS fitting error, which is 0.6 meV per atom. The chemisorption barrier is 172 meV, which is lower than that of the REBO-EMFT PES (260 meV). We used this PES to calculate about 1.5 million classical trajectories with carefully selected initial conditions to allow for direct comparison to results of H- and D-atom scattering experiments performed at incidence translational energy of 1.9 eV and a surface temperature of 300 K. The theoretically predicted scattering angular and energy loss distributions are in good agreement with experiment, despite the fact that the experiments employed graphene grown on Pt(111). Compared to previous calculations, the agreement with experiments is improved. The remaining discrepancies between experiment and theory are likely due to the influence of the Pt substrate only present in the experiment.
945 data points computed with density-functional theory employing the PBE-D2 functional. Improving over a previously published PES [Jiang et al., Science, 2019, 364, 379], this neural network exhibits a realistic physisorption well and achieves a 10-fold reduction in the RMS fitting error, which is 0.6 meV per atom. The chemisorption barrier is 172 meV, which is lower than that of the REBO-EMFT PES (260 meV). We used this PES to calculate about 1.5 million classical trajectories with carefully selected initial conditions to allow for direct comparison to results of H- and D-atom scattering experiments performed at incidence translational energy of 1.9 eV and a surface temperature of 300 K. The theoretically predicted scattering angular and energy loss distributions are in good agreement with experiment, despite the fact that the experiments employed graphene grown on Pt(111). Compared to previous calculations, the agreement with experiments is improved. The remaining discrepancies between experiment and theory are likely due to the influence of the Pt substrate only present in the experiment.
1 Introduction
H-Atom chemisorption to graphene is relevant to hydrogen storage,1 the catalytic formation of molecular hydrogen in the interstellar medium2 and—because hydrogenation of graphene can induce a band-gap—two-dimensional semiconductor materials.3 Recently, a full-dimensional PES was reported4 using first principles energies obtained from Embedded Mean-Field Theory (EMFT)5–7 to parameterize a second generation Reactive Empirical Bond Order (REBO) function.8 Using classical and semi-classical dynamics calculations, qualitative agreement was obtained with H-atom scattering experiments carried out at incidence translational energies Ei of 1.9 and 1 eV. Furthermore, the trajectories provided an atomic scale movie at the femtosecond time scale showing the formation of a covalent chemical bond.4 The sticking probability could also be calculated using the REBO-EMFT PES and compared well with experiment at Ei = 1 eV. This suggests that the REBO-EMFT PES is the best available representation of interatomic forces in the H/graphene system.Despite the progress made in that work, two problems remained. First, the EMFT data was derived from a model of free-standing graphene, while the experiment was carried out on graphene that had been grown on Pt(111).4 To account for the influence of Pt in the simulations, a Lennard-Jones (LJ) interaction model with the Pt substrate was included for each atom in the graphene layer. This improved agreement with experiment, suggesting the influence of the substrate may be important. Unfortunately, it is unclear how to reparameterize the analytical REBO-EMFT PES from first-principles energies that include the Pt substrate. Therefore, the role of the substrate remains uncertain. The second problem concerns the fitting error (7 meV per atom) as the REBO function is not flexible enough to closely reproduce electronic structure data.4 This complicates the evaluation of the quality of different electronic structure methods, since the fitting error can easily be larger than the energy differences between the methods being compared. Clearly, a full-dimensional first-principles PES where fitting errors are small and where the role of the Pt substrate is included would be a significantly better approach to this problem. For both of these problems a solution is offered by atomistic potentials employing machine learning (ML) methods.
In recent years, ML potentials have become a promising new approach to construct PESs of first-principles quality.9,10 They have a uniquely flexible functional form that allows the accurate reproduction of reference data sets obtained in electronic structure calculations, without sacrificing the efficiency needed when they are repetitively evaluated in large-scale molecular dynamics (MD) simulations. ML potentials have been developed for many systems. These include free-standing11 and multi-layer graphene12 as well as graphite12–14 and amorphous carbon,15 which are closely related to this work. A frequently used type of machine learning potential suitable for large condensed systems is the high-dimensional neural network potential energy surface (HDNN-PES) method proposed by Behler and Parrinello in 2007.16
In this paper, we present the first HDNN-PES for H atoms interacting with free standing graphene, which we validate against data obtained from H and D scattering experiments using graphene grown on Pt(111), experiments that are similar to those recently reported elsewhere.17 Compared to the REBO-EMFT PES,4 we achieve substantially reduced fitting errors without sacrificing computational performance. Using MD, we show that experimentally obtained H/D-atom energy loss and angular distributions are faithfully reproduced. We demonstrate the improvement represented by the HDNN-PES by comparing the new results to MD simulations done with the previously reported REBO-EMFT PES.4 The remaining deviations between experiment and theory likely reflect the absence of the Pt substrate in our simulations; however, the influence of the substrate on the scattering distributions appears to be relatively small.
2 Experimental methods
The experimental apparatus has been described in detail in ref. 18. H/D-atoms are generated by photodissociating a supersonic molecular beam of hydrogen/deuterium iodide with a KrF excimer laser producing atoms with incidence energy of 1.9 eV. A small fraction of these atoms passes through two differential pumping stages, enter the ultra-high vacuum chamber and collide with the graphene sample grown in situ on a Pt(111) substrate. The sample is held on a six-axis manipulator, allowing variation of the incidence angle θi. Recoiling atoms are excited to a long lived Rydberg state (n = 34) by two laser pulses at 121.5 nm and 365 nm via a two-step excitation. These neutral atoms travel 25 cm in a field-free region and pass a detector aperture before they are field-ionized and detected by a multi-channel plate detector. The arrival time is recorded by a multi-channel scaler. The rotatable detector allows data to be recorded at various scattering angles θs. The graphene sample is epitaxially grown on a clean Pt(111) substrate by dosing ethylene (partial pressure 3 × 10⁻⁸ mbar) at 700 °C for 15 minutes.3 Computational methods
3.1 HDNN-PES
High-dimensional neural network potentials (HDNN-PESs)16 have been the first type of ML potential enabling the simulations of large condensed systems. In this approach, the total potential energy Etot of the system is constructed as a sum of atomic energy contributions, | (1) |
3.2 Density functional theory calculations
The Vienna ab initio simulation package (VASP) version 5.3.524–27 has been employed for the reference electronic structure calculations to generate the training set for the HDNN-PES. Density functional theory (DFT) at the generalized gradient approximation (GGA) level of theory using the Perdew–Burke–Ernzerhof (PBE)28 exchange–correlation functional with a plane-wave basis has been used in combination with Grimme D2 van der Waals (vdW) corrections.29 We made use of the Projector Augmented Wave (PAW)27,30 approach to model the core and valence electron interactions. The kinetic energy cutoff has been set to 400 eV. The Monkhorst–Pack scheme31 with a 8 × 8 × 1 Γ-centered k-point mesh for the 3 × 4 surface cell has been used to sample the surface Brillouin zone. With two atoms per primitive unit cell, the slab consists of 24 carbon atoms in total and is 8.55 Å × 7.40 Å in size (see Fig. 1). 3D periodic boundary conditions have been applied with 13 Å vacuum perpendicular to the graphene sheet to ensure that the periodic images of the surfaces are non-interacting and that hydrogen atoms can be included at a maximum separation of 6 Å from the surface. We included spin polarization in the electronic structure calculations, and partial occupations have been treated by applying the tetrahedron method with Blöchl corrections30,32 using the default value of 0.2 eV as the smearing parameter. The threshold for the change in energy between iteration steps when relaxing the electronic degrees of freedom has been 10−5 eV.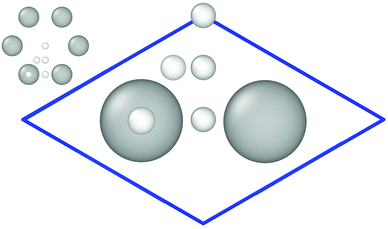 | ||
| Fig. 1 Primitive cell containing two C-atoms used to create the 3 × 4 graphene slab. Important high-symmetry sites are indicated by small white balls. This figure and the ones showing surface structures of graphene are created using OVITO version 2.9.0.33 | ||
3.3 Generating the reference structures
The iterative procedure described in detail elsewhere34 was used to generate the reference data. Briefly, step by step new DFT energies and forces are added for geometries where the HDNN-PES fit does not show the desired accuracy or covers the full configurational space. These geometries are identified by comparing the results of several generated HDNN-PESs with differing network structures. The reference data set is then extended with the additional data until convergence is reached.The initial data set consists of energies and forces obtained from DFT calculations for about 6 × 10⁴ reference configurations, which were picked up from: (i) ab initio molecular dynamics (AIMD) trajectories simulating H-atom scattering from graphene at incidence energy of 1.9 eV and incidence angles of 34° and 52° at surface temperatures of 300 K and 600 K; (ii) geometries close to the minimum energy path to adsorption, where the H-atom was put at the lateral position of the C-atom and the z-coordinates were varied over a range of −0.8 Å ≤ zH ≤ 5.8 Å and −0.8 Å ≤ zC ≤ 1.0 Å, respectively, with 0.025 Å step and without structures with rCH < 0.6 Å, whereas the remaining C-atoms were kept at their equilibrium positions; (iii) graphene geometries chosen randomly from an AIMD trajectory thermalized at 300 K with H-atom over the surface. The position of the H-atom is chosen randomly over the whole simulation cell where the z-coordinate ranges from 1 to 6 Å. The configuration with a C–H distance of 6 Å and a fully relaxed graphene surface was used as the asymptotic energy reference. This structure is our energy zero point.
The HDNN-PESs fitted to the initial reference data set were then improved on the set of about 1.5 × 10⁴ configurations obtained from MD simulations of H-atom scattering from a graphene sheet at incidence energy of 1.9 eV in the wide range of incidence angles (from 0° to 90° in 10° step) as well as at incidence energy of 6 eV and normal incidence angle with surface temperatures of 0 K and 600 K starting over high-symmetry sites shown in Fig. 1. Moreover, we also trained the HDNN-PESs on the configurations taken from equilibrium MD simulations of the graphene surface in the wide range of temperatures from 0 K to 2000 K. The high-temperature configurations are useful, since the surface can be heated locally in the neighborhood of the collision site.
In total, the final HDNN-PES was trained on the reference data set of 75![[thin space (1/6-em)]](https://www.rsc.org/images/entities/char_2009.gif) 945 configurations.
945 configurations.
3.4 Construction of the neural network potential
The HDNN-PES has been constructed using the RuNNer21,22,35 code. The atomic neural network's architecture consists of two hidden layers with 15 neurons per layer providing the energies both for hydrogen and carbon atoms. The parameters of symmetry functions19 are listed in Table S1 of ESI.† The symmetry function values have been rescaled to the range from 0 to 1. Randomly selected 90% of the reference data were used to train the NN, whereas the remaining 10% were used as an independent test set to validate the fit and to check for overfitting. The NN weight parameters were determined from the DFT energies and forces employing the adaptive global extended Kalman filter.36 The initial values of the weight parameters have been chosen randomly in the interval from −1 to 1. For the weights, a preconditioning scheme was applied to reduce the initial root-mean-square error (RMSE).21 The training data in each of the 200 iterations (epochs) of the fit were presented in a random order to reduce the probability of getting trapped in local minima.3.5 Molecular dynamics simulations details
MD simulations of H-atom scattering from graphene were performed using MDT2 code37 developed to study atomic scattering from various surfaces.4,38,39 The RuNNer subroutines implementing the HDNN-PES providing the energies and forces were integrated into the MDT2 code. All the results shown in this paper have been obtained from MD simulations carried out using the RuNNer-MDT2 interface.MD simulations of the H/D scattering from graphene have been carried out in the NVE ensemble using the standard velocity Verlet algorithm40,41 with a time step of 0.1 fs. The trajectories were started with an H-atom randomly put at height of 3.5 Å over the surface and were terminated either when the scattered atom distance from the surface became larger than 3.6 Å or when the trajectory duration exceeded 200 fs. The initial geometry for the graphene layer was randomly selected from 1000 configurations obtained after the equilibration of the surface at 300 K with Andersen thermostat.42,43 Those configurations were extracted from a single 100 ps-long trajectory with a period of 100 fs. In the experiment, graphene is not a single crystal but a composition of two equally abundant orientational domains. The two domains have a rotational distribution with a Gaussian width of 5° and they are rotated by 27° with respect to each other.4 This results in a H-atom velocity vector that is oriented symmetrically with respect to the two domains. To achieve scattering conditions comparable to experiment, the simulations have been carried out by averaging over two domains with incidence azimuth ϕi = ±13.5°, where zero for azimuth angle is aligned with a C![[double bond, length as m-dash]](https://www.rsc.org/images/entities/char_e001.gif) C bond in graphene.
C bond in graphene.
In total, ∼1.5 million trajectories have been carried out for different incidence angles and isotopes (hydrogen and deuterium). The exact numbers of trajectories for the different conditions can be found in Table S2 of the ESI.†
4 Results
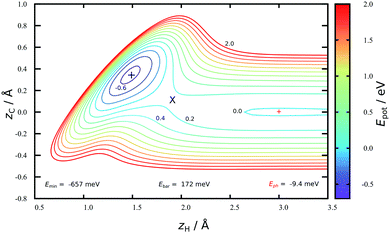
Fig. 2 shows a two-dimensional cut through the converged HDNN-PES developed in this work reflecting structures near the minimum energy path to chemisorption, where the H-atom approaches directly above a C-atom. A physisorption local minimum can be seen at large zH and a deeper chemisorption local minimum at small zH with zC ≈ 0.4 Å. The minimum energy path to chemisorption involves both degrees of freedom, demonstrating that the C-atom is partially re-hybridized from sp2 to sp3 at the transition state.The depth of this physisorption local minimum of the HDNN-PES is 9 meV, which compares well with the DFT GGA-PBE-D2 energy of 22 meV calculated for the same geometry. The global physisorption minimum is found for the H-atom centered over the 6-carbon ring. Here, the HDNN-PES gives a well depth of 11 meV at zH = 2.7 Å. This is still about 4 times smaller than the experimentally derived physisorption well depth (40 meV).44 A correlated, counterpoise corrected wave function calculation of the hydrogen-coronene system also gave a 40 meV well depth, placing the minimum at zH = 2.93 Å.45 The previous REBO-EMFT PES had no physisorption well.
The chemisorption well depth of the HDNN-PES (657 meV) also compares well with DFT (676 meV) but is deeper than that of the REBO-EMFT PES (610 meV). Furthermore, the DFT barrier (160 meV) is reproduced well by the HDNN-PES (172 meV) but is lower than that of the REBO-EMFT PES (260 meV).
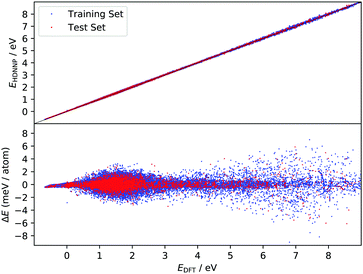
The improved quality of the HDNN-PES in comparison to the REBO-EMFT PES is due both to the use of a dispersion corrected functional as well as to reduced fitting error. The RMSE fitting error of the REBO function to the DFT-EMFT data was reported to be ≈7 meV per atom;4 furthermore, the REBO function cannot represent a physisorption well. The flexibility of the neural network—the RMSE for the HDNN-PES is ≈0.6 meV per atom for energies in training and test set and ≈90 meV Å−1 for forces in training and test set, respectively—easily leads to a physically realistic physisorption well and a more accurate representation of the DFT energies and forces. Fig. 3 shows the fitting error to the DFT energies graphically. While the errors are not randomly distributed, there is no reason to suspect systematic problems with the PES over the energy range of 10 eV.
Fig. 4 and 5 show perhaps in the most impressive way the quality of the NN fitting. Here, two classical trajectories are represented, one performed with the HDNN-PES and one with AIMD. The trajectories correspond to the same initial conditions and are typical of those that will be compared to experiment below. Fig. 4 shows the potential energy change along the trajectory while Fig. 5 shows the H atom motion in the trajectory in a perspective drawing. The trajectories obtained with these two approaches are nearly identical—note that if the fitting were perfect they would be identical. We now turn to the question: how well is the experiment reproduced by classical MD on the new HDNN-PES.
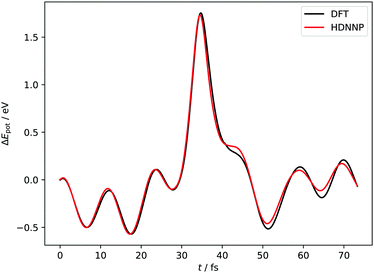 | ||
| Fig. 4 Potential energies from AIMD and HDNN-PES trajectories with Ei = 1.9 eV, θi = 34° and ϕi = 0°. The two trajectories were launched with identical initial conditions and both traverse the chemisorption well before returning to the gas phase after a single bounce. The distance of closest approach is below rCH = 1.4 Å. Movies of the two trajectories can be found in the ESI.† | ||
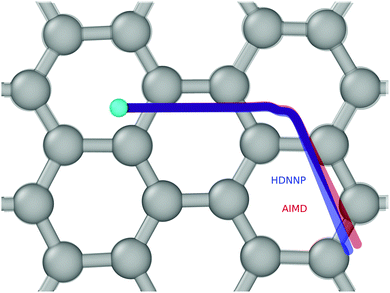 | ||
| Fig. 5 The same two trajectories as in Fig. 4—AIMD (red) and HDNN-PES (blue). The H-atom's initial position is shown as a cyan colored ball. The divergence between the two trajectories is due to residual error in the NN fit to the DFT data. A “side view” of the trajectories can be found in the ESI.† | ||
Fig. 6 and 7 show comparisons between experiment and theory for H and D scattering from graphene, respectively. In both figures, panels (A–C) show experimentally derived angle-resolved energy loss distributions represented as heat maps for three values of the incidence polar angle θi indicated with red numbers on the polar axes. The energy loss is the fraction of the incidence kinetic energy of the projectile Ei and the kinetic energy after its collision with the surface Es. Panels (D–F) show theoretically predicted distributions derived with the HDNN-PES of this work. In Fig. 6 we also show the distributions obtained when using the REBO-EMFT PES from ref. 4—see panels (G–I). When producing Fig. 6 and 7 we included only trajectories scattered within 1.5° of the in-plane direction in order to match the detection geometry of the experiment.
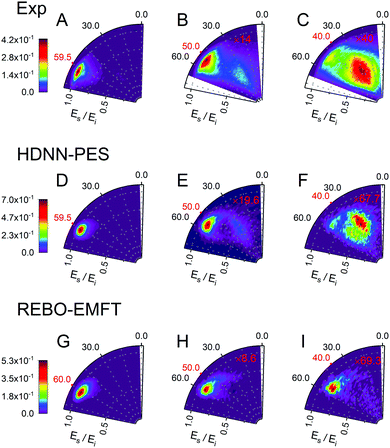 | ||
| Fig. 6 Comparing theory with experiment for H-scattering from graphene at incidence kinetic energy Ei = 1.9 eV. The energy loss is the fraction of Ei and the kinetic energy of the H-atom after its collision with the surface Es. Experimental distribution are shown in panels (A–C) along with theoretical distribution found from MD simulations using the HDNN-PES (D–F) and the REBO-EMFT PES from ref. 4 (G–I). The red labeled ticks indicate both the incidence and specular scattering angles. The integrated signals of panel A, D and G are normalized to 1. The number of trajectories used for the plots are shown in Table S2 in the ESI.† | ||
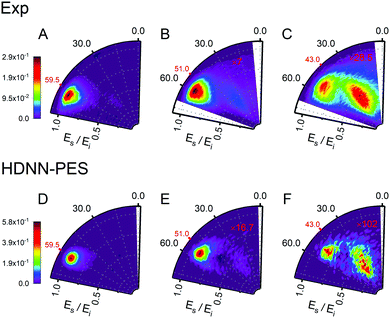 | ||
| Fig. 7 Comparing theory with experiment for D-scattering from graphene at Ei = 1.9 eV. Experimental distribution are shown in panels (A–C) along with theoretical distribution found from MD simulations using the HDNN-PES (D–F). The number of trajectories used for the plots are shown in Table S2 in the ESI.† | ||
The total observed scattering flux decreases rapidly as the incidence angle approaches the normal (note the scaling factors shown in red in Fig. 6 and 7). This occurs for two reasons. First, the normal component of H/D kinetic energy is more effective in promoting passage over the barrier to chemisorption.4 Thus, smaller incidence angles produce more sticking. Secondly, the experiment can only observe scattered atoms within a plane defined by the direction of the atomic beam and the normal to the surface. Changing the incidence angle affects the fraction of atoms scattered within that plane. The drop in scattering flux caused by the reduction of the incidence angle is indicated quantitatively by the multiplying factors on the panels. Clearly, the HDNN-PES predictions are in better agreement with experiment than those of the REBO-EMFT PES—see Fig. 6.
Both H and D scattering from graphene exhibit two distinct energy loss channels: a quasi-elastic and a high energy loss channel. The quasi-elastic channel comes from trajectories that fail to cross the barrier to chemisorption, whereas the high energy loss channel arises from trajectories that passed through the chemisorption well forming a transient C–H bond and subsequently returned to the gas phase.4 The relative intensities of these two channels are also sensitive to incidence angle. The experiment shows that at large incidence angles—see Fig. 6 and 7 panels (A)—only quasi-elastic scattering is seen. At small incidence angles—panels (C)—transient chemical bond formation dominates and at intermediate incidence angles—panels (B)—both channels contribute to the scattering signal. The angle-resolved energy loss distributions obtained with the HDNN-PES—Fig. 6 panels (D–F)—capture these experimental observations qualitatively better than those obtained with the REBO-EMFT PES—Fig. 6 panels (G–I).
The influence of isotopic substitution on the energy loss spectra can serve as an additional test to validate the accuracy of the HDNN-PES. Comparing the upper panels of Fig. 6 and 7 shows that the experimentally observed branching into the high energy-loss channel is somewhat smaller for D than for H under the same incidence conditions. Classical trajectories carried out on the HDNN-PES describe this isotope effect well. Even subtle difference in the angle-resolved energy loss distributions seen in experiment are captured in the trajectory calculations. Compare for example, panels C (experiment) and F (MD with HDNN-PES) of Fig. 6 and 7.
The quality of the results can be more clearly seen in angle-integrated energy loss distributions shown in Fig. 8. Here, the H and D energy loss distributions have in each case been normalized to the integrated scattering intensity of the θi = 59.5° distributions. The integrated scattering intensity drops off too rapidly with decreasing incidence angle, reflecting the overestimation of out-of-plane scattering in MD simulations, which is likely related to either to inaccuracies of the DFT data or the influence of a substrate. The theoretically predicted energy loss in the quasi-elastic channel (the position of the first peak in the panels of Fig. 8) is somewhat larger than seen in experiment and the error is larger for H than for D. This might be a quantum effect allowing the H atom to sample the PES closer to the chemisorption barrier producing more inelasticity.
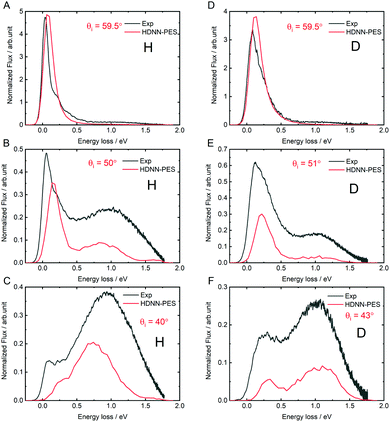 | ||
| Fig. 8 Comparing theory with experiment: angle integrated energy loss spectra. All incidence conditions are the same as in Fig. 6. | ||
The theoretically predicted D-atom energy loss for the transient bond-forming channel matches experiment remarkably well-see in particular panel D-but the H energy loss is smaller than experimental observation. We note that this is consistent with possible electronically non-adiabatic dynamics where the H atom energy loss is larger than that of the D-atom due to its higher velocity.
5 Conclusions
We have developed a high-dimensional neural network potential energy surface for H- and D-atoms interacting with a free standing graphene sheet. The potential reproduces a large set of DFT-GGA electronic structure data with high accuracy and is sufficiently efficient to be used in large-scale molecular dynamics simulations. By computing several hundred thousand classical trajectories we demonstrated the utility of the PES by simulating angle- and energy-resolved H- and D-atom scattering experiments similar to those recently published.4,17The theoretical distributions are remarkably close to those seen in experiment. They accurately capture the branching between a quasi-elastic channel that samples only the physisorption well and a high-energy-loss channel that results from trajectories that traverse the chemisorption well. The simulations also capture subtle differences between H and D scattering seen in experiment that appear as broadening of the angular distribution at specific values of θi. These results suggest that for scattering at 1.9 eV, neglecting the Pt substrate in the model of scattering dynamics does not introduce large errors.
We do, however, still see systematic differences between experiment and theory. These may be due to failure of the classical or Born–Oppenheimer approximations or both. It is, of course, possible that improved electronic structure data as well as a proper inclusion of the influence of the Pt substrate could explain the remaining discrepancies between experiment and theory. While the present work is only a first step, it demonstrates a crucial milestone toward developing a first principles quality PES that includes the influence of the metal substrate.
Conflicts of interest
There are no conflicts to declare.Acknowledgements
We thank the DFG for financial support via the SFB 1073 projects A04 and C03 (Project No. 217133147). We gratefully acknowledge the funding of this project by computing time provided by the DFG project INST186/1294-1 FUGG (Project No. 405832858). AK acknowledges European Research Council (ERC) under the European Union's Horizon 2020 research and innovation programme (grant agreement no. 833404). Open Access funding provided by the Max Planck Society.Notes and references
- L. Schlapbach and A. Zuttel, Nature, 2001, 414, 353–358 CrossRef CAS.
- L. Hornekaer, A. Baurichter, V. Petrunin, D. Field and A. Luntz, Science, 2003, 302, 1943–1946 CrossRef CAS.
- R. Balog, B. Jorgensen, L. Nilsson, M. Andersen, E. Rienks, M. Bianchi, M. Fanetti, E. Laegsgaard, A. Baraldi, S. Lizzit, Z. Sljivancanin, F. Besenbacher, B. Hammer, T. G. Pedersen, P. Hofmann and L. Hornekaer, Nat. Mater., 2010, 9, 315–319 CrossRef CAS.
- H. Jiang, M. Kammler, F. Ding, Y. Dorenkamp, F. R. Manby, A. M. Wodtke, T. F. Miller, III, A. Kandratsenka and O. Bünermann, Science, 2019, 364, 379–382 CrossRef CAS.
- M. E. Fornace, J. Lee, K. Miyamoto, F. R. Manby and T. F. Miller, III, J. Chem. Theory Comput., 2015, 11, 568–580 CrossRef CAS.
- F. Ding, T. Tsuchiya, F. R. Manby and T. F. Miller, III, J. Chem. Theory Comput., 2017, 13, 4216–4227 CrossRef CAS.
- F. Ding, F. R. Manby and T. F. Miller, III, J. Chem. Theory Comput., 2017, 13, 1605–1615 CrossRef CAS.
- D. Brenner, O. Shenderova, J. Harrison, S. Stuart, B. Ni and S. Sinnott, J. Phys.: Condens. Matter, 2002, 14, 783–802 CrossRef CAS.
- J. Behler, J. Chem. Phys., 2016, 145, 170901 CrossRef.
- F. Noé, A. Tkatchenko, K.-R. Müller and C. Clementi, Annu. Rev. Phys. Chem., 2020, 71, 361–390 CrossRef.
- P. Rowe, G. Csányi, D. Alfè and A. Michaelides, Phys. Rev. B, 2018, 97, 054303 CrossRef.
- M. Wen and E. B. Tadmor, Phys. Rev. B, 2019, 100, 195419 CrossRef CAS.
- R. Z. Khaliullin, H. Eshet, T. D. Kühne, J. Behler and M. Parrinello, Phys. Rev. B: Condens. Matter Mater. Phys., 2010, 81, 100103 CrossRef.
- R. Z. Khaliullin, H. Eshet, T. D. Kühne, J. Behler and M. Parrinello, Nat. Mater., 2011, 10, 693–697 CrossRef CAS.
- V. L. Deringer and G. Csanyi, Phys. Rev. B, 2017, 95, 094203 CrossRef.
- J. Behler and M. Parrinello, Phys. Rev. Lett., 2007, 98, 146401 CrossRef.
- H. Jiang, X. Tao, M. Kammler, F. Ding, A. M. Wodtke, A. Kandratsenka, T. F. Miller III and O. Bünermann, 2020, arXiv:2007.03372 [physics.chem-ph].
- O. Bünermann, H. Jiang, Y. Dorenkamp, D. J. Auerbach and A. M. Wodtke, Rev. Sci. Instrum., 2018, 89, 094101 CrossRef.
- J. Behler, J. Chem. Phys., 2011, 134, 074106 CrossRef.
- N. Artrith and J. Behler, Phys. Rev. B: Condens. Matter Mater. Phys., 2012, 85, 045439 CrossRef.
- J. Behler, Int. J. Quantum Chem., 2015, 115, 1032–1050 CrossRef CAS.
- J. Behler, Angew. Chem., Int. Ed., 2017, 56, 12828 CrossRef CAS.
- J. Behler, J. Phys.: Condens. Matter, 2014, 26, 183001 CrossRef CAS.
- G. Kresse and J. Furthmüller, Phys. Rev. B: Condens. Matter Mater. Phys., 1996, 54, 11169 CrossRef CAS.
- G. Kresse, J. Non-Cryst. Solids, 1995, 192–193, 222–229 CrossRef.
- G. Kresse and J. Furthmüller, Comput. Mater. Sci., 1996, 6, 15–50 CrossRef CAS.
- G. Kresse and D. Joubert, Phys. Rev. B: Condens. Matter Mater. Phys., 1999, 59, 1758–1775 CrossRef CAS.
- J. P. Perdew, K. Burke and M. Ernzerhof, Phys. Rev. Lett., 1996, 77, 3865–3868 CrossRef CAS.
- S. Grimme, J. Comput. Chem., 2006, 27(15), 1787–1799 CrossRef CAS.
- P. E. Blöchl, Phys. Rev. B: Condens. Matter Mater. Phys., 1994, 50, 17953–17979 CrossRef.
- H. J. Monkhorst and J. D. Pack, Phys. Rev. B: Condens. Matter Mater. Phys., 1976, 13, 5188–5192 CrossRef.
- P. E. Blöchl, O. Jepsen and O. K. Andersen, Phys. Rev. B: Condens. Matter Mater. Phys., 1994, 49, 16223–16233 CrossRef.
- A. Stukowski, Modell. Simul. Mater. Sci. Eng., 2010, 18, 015012 CrossRef.
- N. Artrith and J. Behler, Phys. Rev. B, 2012, 85, 045439 CrossRef.
- J. Behler, RuNNer – A Neural Network Code for High-Dimensional Potential-Energy Surfaces, Universität Göttingen, 2020, http://www.uni-goettingen.de/de/560580.html Search PubMed.
- T. B. Blank and S. D. Brown, J. Chemom., 1994, 8, 391–407 CrossRef CAS.
- D. J. Auerbach, S. M. Janke, M. Kammler, S. Kandratsenka and S. Wille, Molecular Dynamics Tian Xia 2 (MDT2); program for simulating the scattering of atoms and molecules from a surface (GitHub repository), 2020, Available at https://github.com/akandra/md_tian2.
- S. M. Janke, D. J. Auerbach, A. M. Wodtke and A. Kandratsenka, J. Chem. Phys., 2015, 143, 124708 CrossRef.
- O. Bünermann, H. Jiang, Y. Dorenkamp, A. Kandratsenka, S. M. Janke, D. J. Auerbach and A. M. Wodtke, Science, 2015, 350, 1346–1349 CrossRef.
- M. P. Allen and D. J. Tildesley, Computer Simulation of Liquids, Clarendon Press, USA, 1st edn, 1989 Search PubMed.
- W. C. Swope, H. C. Andersen, P. H. Berens and K. R. Wilson, J. Chem. Phys., 1982, 76, 637 CrossRef CAS.
- D. Frenkel and B. Smit, Understanding Molecular Simulation: From Algorithms to Applications, Academic Press, San Diego, 2nd edn, 2002 Search PubMed.
- H. C. Andersen, J. Chem. Phys., 1980, 72, 2384 CrossRef CAS.
- E. Ghio, L. Mattera, C. Salvo, F. Tommasini and U. Valbusa, J. Chem. Phys., 1980, 73, 556–561 CrossRef CAS.
- M. Bonfanti, R. Martinazzo, G. F. Tantardini and A. Ponti, J. Phys. Chem. C, 2007, 111, 5825–5829 CrossRef CAS.
Footnote |
| † Electronic supplementary information (ESI) available. See DOI: 10.1039/d0cp03462b |
| This journal is © the Owner Societies 2020 |

