 Open Access Article
Creative Commons Attribution 3.0 Unported Licence
Review of high entropy ceramics: design, synthesis, structure and properties
Rui-Zhi
Zhang
 *ab and
Michael J.
Reece
*a
aSchool of Engineering and Materials Science, Queen Mary University of London, London E1 4NS, UK. E-mail: m.j.reece@qmul.ac.uk
bSchool of Physics, Northwest University, Xi'an 710069, China. E-mail: zhangrz@nwu.edu.cn
First published on 20th September 2019
Abstract
High entropy ceramics are novel materials with no less than four different cations or anions. The development of high entropy ceramics follows the ‘configurational entropy stabilized single phase’ concept, which was first demonstrated for high entropy metal alloys in 2004. The advantages of high entropy ceramics are their compositional and structural diversity, and many of them have a band gap, which makes them potential functional materials for a wide range of applications. They have recently generated significant interest with the publication of 70+ related papers since 2015. In this review we have summarized the recent progress in this rapidly growing field. We emphasize the progress by researchers to answer the following three fundamental questions for high entropy ceramics: (1) which combinations of cations or anions can be synthesized as single-phase materials; (2) are the component elements truly random down to the atomic scale; and (3) what new physics, properties and applications will the incorporation of multi-elements elements bring. These fundamental questions are still open at this stage and warrant further studies. The objective of this review is to give a comprehensive overview of the literature to date on high entropy ceramics and to guide further investigation in this emerging field.
1. Introduction
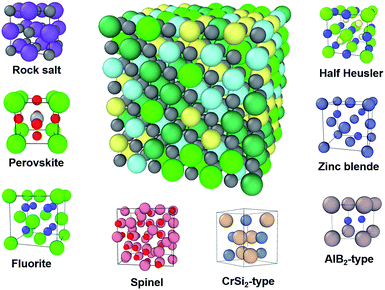
High entropy ceramics (HECs), sometimes also referred to as high entropy compounds, are single phase ceramics with no less than four types of cations or anions. The concept of high entropy ceramics is inherited from the field of high entropy alloys (HEAs). The two families of materials are fundamentally different, and hence their applications are also different. Since the invention of HEAs in 2004,1,2 intensive research on HEAs in the past decade has led to many interesting results, such as enhanced hardness and strength.3,4 Due to the intensive research on HEAs, HECs have now become a new focus in the search for novel materials. Similar to HEAs, HECs consist of multi-component elements in a single phase, for which their large configurational entropy contributes to their formation.5 In contrast to metallic HEAs, HECs are typically semiconductors or insulators with a band gap, which makes them potentially useful functional materials. For example, high entropy chalcogenides can be good thermoelectric materials due to their large Seebeck coefficient and low thermal conductivity.6,7 Recently, it was reported that charge-induced disorder in high entropy oxides controls thermal conductivity;8 this opens up new possibilities to improve the performance of thermoelectric materials.Another advantage of HECs is that they have ample structural diversity (see Fig. 1). The members of the HEC family are increasing rapidly. The earliest reported work on HECs was on coating materials, typically nitrides9–11 and carbides.9 In 2015 Rost et al. reported on entropy-stabilized HEC oxides.5 This work stimulated interest in the properties of these materials, such as dielectric,12 Li-battery13 and low thermal conductivity.8 In the following three years, researchers extend the family members to include diborides,14 chalcogenides,7 silicides15 and intermetallics such as half Heusler,16 for a broad range of applications from structural to functional. The growing number of members studied is bringing structural diversity. The earlier reported HECs all had rock salt structure, including nitrides, carbides and the well-studied Mg0.2Co0.2Ni0.2Cu0.2Zn0.2O. To date there are eight structural types, with more likely to be reported in the near future (Fig. 1). To name a few, cubic perovskite oxides,17 fluorite oxides18 and hexagonal diborides.14
The review consists of four sections covering design of single phase HECs, typical synthesis methods, atomic scale structure characterization, properties and applications. The structural and element diversity of HECs makes the design and prediction of single phase materials very important, and this topic will be discussed in detail in the following section.
2. Design of single phase HECs
Developing new materials is always one of the fundamental driving forces in materials science. Therefore, predicting yet-unknown single solid solution phases is of great interest to the high entropy materials community. For such prediction, a model, either based on descriptors or on the calculation of Gibbs free energy, is needed. Then this model can be used to predict the stability of a given formula in a given crystal structure, or to explore the combinatorial space to identify stable compositions. Unlike for the HEA community, the design of HECs is at a very early stage. Currently, in most HEC papers the authors simply chose a group of elements in a specific part of the periodic table. Only a few papers deal with the design of materials, of which most use a descriptor approach.2.1 Using descriptors
An underlying assumption is that stable single-phase solid solutions have something in common that can be described by descriptors. The descriptor-based approach can be tracked to the pioneering work of William Hume-Rothery,19 in which several rules, later coined as the ‘Hume-Rothery rules’, describe the conditions under which solid solution alloys can be formed. It is worth noting that some descriptors used in the design of HECs can be considered as derivatives of these rules. | (1) |
 is the average effective lattice constant and ΔR*is the difference in effective lattice constant, Z is the number of formula units per unit cell, and Ḡ is the average shear modulus. A small δ value means a low internal strain energy and high atomic solubility, and vice versa. For multi-component solid solutions, the average
 ![[small delta, Greek, macron]](https://www.rsc.org/images/entities/i_char_e0c5.gif) value can be calculated by averaging the values for all of the quasi-binary solid solutions. Using a phenomenological formula for the enthalpy of mixing and configurational entropy, the upper bound of
value can be calculated by averaging the values for all of the quasi-binary solid solutions. Using a phenomenological formula for the enthalpy of mixing and configurational entropy, the upper bound of ![[small delta, Greek, macron]](https://www.rsc.org/images/entities/i_char_e0c5.gif) values were calculated as 2.08, 2.92, 3.58, and 4.12 GPa Å−3 for binary, ternary, quaternary and 5 component solid solution compounds, respectively (Fig. 2). These criteria were tested by experimentally fabricating several multi-component materials, e.g. (Cu/Ag)(In/Ga)Te2-, Cu2(S/Se/Te)-, and (Pb/Sn/Ge/Mn)Te. X-ray diffraction analysis showed that all these materials are phase pure without any obvious impurity phases (Fig. 2).
values were calculated as 2.08, 2.92, 3.58, and 4.12 GPa Å−3 for binary, ternary, quaternary and 5 component solid solution compounds, respectively (Fig. 2). These criteria were tested by experimentally fabricating several multi-component materials, e.g. (Cu/Ag)(In/Ga)Te2-, Cu2(S/Se/Te)-, and (Pb/Sn/Ge/Mn)Te. X-ray diffraction analysis showed that all these materials are phase pure without any obvious impurity phases (Fig. 2).
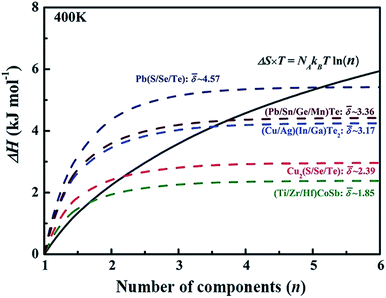 | ||
| Fig. 2 The dashed lines illustrate internal strain energy as a function of the number of components for several solid solution compounds. The black solid line represents the energy contributed by configurational entropy. Reproduced with permission. Copyright 2017, John Wiley and Sons.6 | ||
Using a data-driven approach, Zhang et al.7 identified all of the diamond-like Cu/S containing compounds in the Inorganic Crystal Structure Database (ICSD), and then all of the cation–sulfur bond lengths in the 49 identified compounds were calculated using the ICSD crystallographic information files (CIFs). These bond length values were compared with those calculated from the bond valence model (Fig. 3), and it was found that, although there was general agreement, the bond length of some cations, such as Cu, Ge and Sn, have a large variation and they can be considered as ‘soft atoms’. These atoms were then used in the design of high entropy sulphides to reduce the local strain energy. By considering the Hume-Rothery rules, two high entropy sulphides, metallic Cu5SnMgGeZnS9 and semiconducting Cu3SnMgInZnS7, were designed and then successfully fabricated as single-phase dense ceramics with homogenously distributed cations.
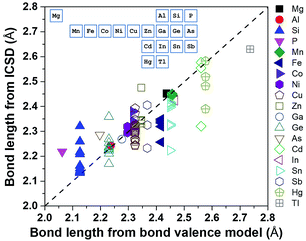 | ||
| Fig. 3 Bond length calculated using ICSD CIFs and BVM. The inset shows the position of the elements in the periodic table. Reproduced under the terms of the CC-BY 4.0 license. Copyright 2018, the authors, published by ACS Publications.7 | ||
Jiang et al. fabricated several high-entropy perovskite oxides,17 and concluded that the Goldschmidt's tolerance factor, instead of cation-size differences on a specific lattice site, influences the formation and temperature-stability of single cubic perovskite solid solutions. They found that the calculated tolerance factors for all six compositions that form single phase high-entropy perovskite phases were close to unity (0.97 ≤ t ≤ 1.03). They suggested that a Goldschmidt tolerance factor close to unity (t ≈ 1.00) is important, but not a solely sufficient criterion to form a single high-entropy perovskite phase.
The above models illustrate the use of descriptors related to mixing enthalpy. There has also been an attempt to develop an ‘entropy descriptor’. K. Vecchio et al. proposed ‘entropy forming ability (EFA)’ as a descriptor to address the synthesizability of HECs from first principles.20 The EFA was estimated as the inverse of the standard deviation of the energy distribution spectrum of the enthalpies of all of the possible atom configurations of 10-atom supercells
 | (2) |
The EFA descriptor was used to screen all of the possible compositions of five-metal carbides selecting from 8 chosen cations (Ti, Zr, Hf, V, Nb, Ta, Mo, W). Then the six compositions with the highest EFA values (the highest one is MoNbTaVWC5 with EFA = 125 atom eV−1) were experimentally fabricated as single phase HECs, and three compositions with low EFA values (the lowest one is HfMoVWZrC5 with EFA = 37 atom eV−1) were found to be multi-phase. These experimental results demonstrate the effectiveness of the EFA descriptor.
A major criticism of descriptor based chemical models comes from the point view of physics. Researchers argue that phase stability is not an intrinsic property of a material, and hence kinetics and all of the competitive phases must be considered to predict stability.26 However, the descriptors are implicitly related to Gibbs free energy, and that is the reason why some descriptors are also referred as ‘empirical thermo-physical parameters’.27 For example, similar atomic radius usually means low strain energy, which reduces the enthalpy of mixing. Although Gibbs free energy based physical models are widely accepted as more quantitatively accurate, the use of descriptors has some merits such as they are easy to use, and can be quite effective under certain circumstances.
2.2 Using Gibbs free energy
Gibbs free energy calculations and phase diagrams can give quantitative information on phase stability. The Gibbs free energy can be calculated using density functional theory (DFT) or other empirical methods, such as the Calculate Phase Diagrams (CALPHAD) method that is used to calculate phase diagrams. A modern trend is to combine empirical methods and DFT. To date, there are few works on the calculation of Gibbs free energy for the prediction of the stability of HECs. Therefore, this section will mainly focus on the principles and briefly introduce their application to HEAs. For comprehensive reviews on these method's as applied to HEAs, see the in-depth reviews by M. C. Gao et al.27 and M. Widom.28| G = H − TS | (3) |
S = kB∑ln![[thin space (1/6-em)]](https://www.rsc.org/images/entities/char_2009.gif) Ω Ω | (4) |
For an alloy system, the entropy is contributed to by vibrational entropy, configurational entropy and other terms. For a completely disordered alloy, and using Sterling's approximation, the configurational entropy, sometimes referred to as entropy of mixing, is
 | (5) |
An alternative approach is the coherent potential approximation (CPA),34 which approximates a configurationally random alloy with an effective medium that is determined self-consistently from the condition of stationary scattering. This approach only considers compositional disorder, and local lattice distortions are totally ignored. Compared to the SQS approach, in which a large cell is used and local distortion is included, the computational cost for CPA is relatively low, as only a unit cell with pseudo-mixed-atoms is used. Although CPA is less accurate, it is still useful and effective when local distortions are not important to the properties of interest. Another advantage of CPA is that the composition can be varied continuously.
Cluster expansion37 refers to the mathematical expression of a physical quantity in the form of a series expansion. The main terms of the series represent a corresponding noninteracting system, and the subsequent terms describe the interactions between the particles. This method is physically strict and systematic in principle, although its application to real systems is quite complicated. It has been applied to alloys for a long time.38,39 The implementation of cluster expansion for alloy systems can be found in programs such as universal cluster expansion (UNCLE)40 and alloy theoretic automated toolkit (ATAT),32 in which the free energies of HEC phases can be calculated and hence the phase diagram predicted. Cluster expansion has been used together with DFT calculations for high-throughput screening for novel high entropy materials.41
3. Synthesis and processing of HECs
So far, three methods have been used to synthesise HECs, namely solid-state reaction, wet chemical, and epitaxial growth. In this section the discussion mainly focuses on solid state reaction, in which the kinetics of formation for different HECs has been investigated. The other two methods have so far only been applied to oxides, and are briefly covered at the end of this section.Solid-state reaction is the predominant synthesis route used to prepare HECs, in which the powders are usually produced by mechanochemistry or mixing of the precursor powders during ball milling, and then the resultant powders are sintered. HECs prepared from low melting point precursors, such as chalcogenides, are synthesised by mechanochemistry during ball milling. In this scenario, inter-diffusion of the components begins during ball milling, and the XRD diffraction peaks of precursors disappear in the ball milled powders.7 For HECs from high melting point precursor, such as oxides and carbides, ball milling is used only to mix the powder, and the HECs are synthesised during sintering, i.e. the inter-diffusion processes of the components mainly occur during sintering.
E. Castle et al.42 found that using same processing conditions, ZrC appeared as a second phase in HEC (Hf–Ta–Zr–Ti)C, while (Hf–Ta–Zr–Nb)C was single phase. They attributed this observation to the slower diffusion of ZrC in the HfC–TaC–ZrC–TiC mixed phases than in HfC–TaC–ZrC–NbC. To explain the different diffusion rates of ZrC, they suggested the following order of inter-diffusing rates: TaC < ZrC ∼ HfC < NbC < TiC, based on the vacancy formation energies, known melting points (relative atomic mobility), metal atomic radius and lattice parameters of the individual carbides. Therefore, TiC–TaC or NbC–TaC inter-diffusion occurs first in the mixed phases HfC–TaC–ZrC–TiC and HfC–TaC–ZrC–NbC, respectively, as TiC or NbC are the fastest and TaC is the slowest diffusing components. Incorporating TiC reduces the lattice parameter of TaC, making it more difficult for the larger ZrC to inter-diffuse into the mixed carbide phase, thus slowing down the kinetics of the ZrC inter-diffusion. By contrast, incorporating NbC increases the lattice parameter of TaC and hence makes the diffusion of ZrC easier.
W. Hong et al.43 did a similar analysis for (Mg,Co,Ni,Cu,Zn)O. From the XRD spectra of the HECs heat treated at temperatures from 650 to 825 °C, they found that the inter-diffusion between the components started at 650 °C; the diffraction peaks of MgO and CoO started to merge, and the peak intensity of the other components became weaker. With increasing temperature, the characteristic peaks of NiO, ZnO and CuO disappeared successively. This observation indicates that CoO and MgO have the fastest inter-diffusion rates while ZnO and CuO have the slowest. They also found that the rate at which species can be incorporated into the HEC structure may relate to metal vacancy formation energies, while no correlation was found between the cation radii and the observed interdiffusion behaviour.
Another kinetic effect relates to meta-stability. Some HECs can be synthesised at high temperatures but are meta-stable at room temperature, therefore phase separation tends to occur during the cooling down period after sintering. A common processing routine to deal with this is quick quenching, i.e. samples were quenched from around 1000 °C to room temperature in less than one minute.5 This technique has been applied to various types of compounds, such as oxides5 and half Heuslers.16
The wet chemical methods used for synthesising HECs include nebulised spray pyrolysis, flame spray pyrolysis and reverse co-precipitation. They have been used to prepare nanoscale oxide powders of (Mg,Co,Ni,Cu,Zn)O,44–46 PtNiMgCuZnCoOx,47, (Lix(Co0.2Cu0.2Mg0.2Ni0.2Zn0.2)OFx)48 and HEC oxides.44,49 High entropy metal oxide nanotube arrays were also prepared by anodic oxidation of TaNbHfZrTi HEA precursors.50
The third HEC synthesis routine is epitaxial growth of films. So far in the literature only pulsed laser deposition (PLD) has been used to prepare HEC oxides. One advantage of this method is that single crystals can be grown,51 therefore grain boundary segregation is avoided and precise elemental ratios can be achieved. Epitaxial growth is also useful for preparing structures that are not possible to produce by solid state reaction and wet chemical methods, such as superlattices and heterostructures.52
4. Atomic scale structure
From the point view of crystal structure configuration, the major difference between HEAs and HECs is that the latter usually have a uniform anion/cation sub-lattice, and only have disorder on the other sites. The sub-lattice, on one hand, reduces the possible configurational entropy; while on the other hand, it reduces short range order (SRO), which increases the configurational entropy of the cations.5SRO means order over distances comparable to interatomic distances. Taking a two-component alloy with components A and B as an example: the interaction energies EA–A, EB–B and EA–B are usually different, so some atomic pair configurations are more energetically favourable than others, and hence the number of lower energy configurations is much greater than in the completely random case. This results in SRO, which reduces the configurational entropy compared to the completely random configuration. In HECs, a uniform anion sub-lattice can reduce SRO. In a recent paper, Rost et al. proposed that the cations in high entropy oxides are perhaps more disordered than in a HEA.5 As shown in Fig. 4, the cations in the oxide have the same coordination environment: all have six nearest-neighbour octahedral coordination with oxygen ions. As the interaction energy is mainly contributed to by the nearest-neighbour, the configurational energy difference on different cation sites becomes small, and hence the preference of cations pairs and SRO is less likely. This increases configurational entropy and favours single phase formation.
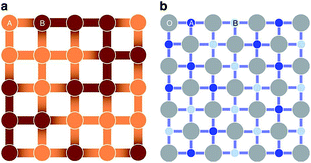 | ||
| Fig. 4 A schematic representation for the comparison of (a) a random binary alloy and (b) a random pseudo-binary oxide. The darkness of the atoms illustrates differences in electronegativity, and the darker bonds more localized negative charge. In the oxide, the nearest neighbour cations are separated by uniform anion sub-lattice. Reproduced under the terms of the CC-BY 4.0 license. Copyright 2015, the authors, published by Springer Nature.5 | ||
4.1 General structure features
The structure of HECs involves different length scales. An ideal HEC should have a lattice with long-range periodicity but compositional disorder, i.e. the periodic lattice sites are randomly occupied by the constituent atoms. Therefore, the structural characterization of HECs is mainly concerned with the determination of single phase (i.e. long-range periodic lattice) and the homogeneity of the constituent elements (i.e. truly random occupation). It is worth noting that although in most HEC development the achievement of a homogeneous single phase is emphasized, sometimes second phases and/or phase separation can be beneficial to the properties. For example, ferroelectric relaxors contain nano polar regions, which confer high dielectric energy storage and giant piezoelectric properties,53 and thermoelectric composites with nano-scale phase separation confers low lattice thermal conductivity.54 While such effects could be useful, this topic has not yet been covered by the HEC community. In the following we only focus on the techniques for charactering single phase, local atom structure and chemical homogeneity.Long-range periodicity is usually tractable through analysis of Bragg peak intensities in XRD. For the compositional distribution, SEM-EDS can be used to find if the elements are homogeneously distributed at the microscale. XRD and SEM-EDS are commonly used techniques to characterise HECs and will not be discussed in detail. In this review we focus on less common techniques dealing with nanoscale atom distribution and the local lattice structure of HECs. The local lattice distortion is an important structural feature of HECs that needs to be characterised. It is worth noting that severe lattice distortion is one of the four fundamental concepts proposed for HEAs.55,56
4.2 Atomic scale structural features
Another useful technique for investigating atom scale element distribution is APT. It is a destructive method that can be used for 3D chemical composition imaging at the atomic scale.62 Liu et al. used APT to check the distribution of atoms at the atomic-scale in Cu2S1/3Se1/3Te1/3 ceramics (Fig. 5a).6 Chellali et al. used APT to study the atomic scale cation distribution in three types of high entropy oxides, rock-salt (Co0.2Cu0.2Mg0.2Ni0.2Zn0.2)O, fluorite (Ce0.2La0.2Pr0.2Sm0.2Y0.2)O2−δ, and perovskite (Gd0.2La0.2Nd0.2Sm0.2Y0.2) (Co0.2Cr0.2Mn0.2Fe0.2Ni0.2)O3.63 In the chalcogenides and oxides, APT results showed that all of the anions or cations were homogenously distributed at the atomic scale and no significant aggregation was found.
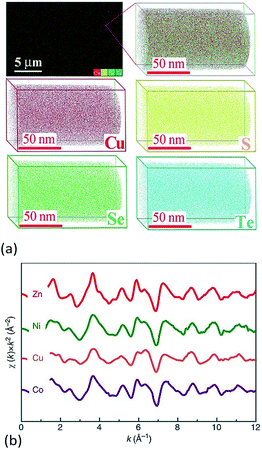 | ||
| Fig. 5 (a) 3D-Atomic maps for Cu2S1/3Se1/3Te1/3 from Atomic Probe Tomography (APT) detection, which suggest that all elements are homogenously distributed at nanoscale.6 (b) Extended X-ray absorption fine structure (EXAFS) measured for Mg0.2Co0.2Ni0.2Cu0.2Zn0.2O. The oscillations for each element occur with similar relative intensity and at similar reciprocal spacing, which suggests a similar local structural and chemical environment for each.5 (a) Reproduced with permission. Copyright 2017, John Wiley and Sons.6 (b) Reproduced under the terms of the CC-BY 4.0 license. Copyright 2015, the authors, published by Springer Nature.5 | ||
Rost et al. quantified the local atomic structure of Mg0.2Co0.2Ni0.2Cu0.2Zn0.2O on an element-by-element basis (Fig. 5b).5,64 They found that the metal–oxygen bond lengths varied for each cation, with notable distortion around the Cu–O polyhedral. The interatomic distances of second nearest neighbours (i.e. the metal–metal pairs) were found to be uniform. By combination of model fitting of experimental data and DFT calculations, they showed that distortion from an ideal rock salt structure occurs primarily through distortion of the oxygen sublattice, with the cations distributed randomly on their FCC sublattice. Using the same method, Harrington et al. found that each of the metals has a similar local surroundings in (V0.2Nb0.2Ta0.2Mo0.2W0.2)C.59 It is worth noting that some elements are missing in these EXAFS experiments due to either the energetic limitations of the beamline (e.g. Mg in HEC oxides) or absorption edge overlap (e.g. W and Ta in the HEC carbides).
Total scattering describes the probability of finding atoms a certain distance away from another atom.65 Peng et al. generated X-ray PDF spectra for equal-molar TiN0.3/VC/NbC/TiC/TaC/Mo2C/WC. By fitting the PDF profile using the PDF gui code with an ideal FCC structural model and a random atomic arrangement, they concluded that the HEC carbide was a well-defined single phase with negligible lattice distortion.61
The local distortion can also be indirectly detected by electron paramagnetic resonance (EPR), which exploits the physical properties of unpaired electrons in materials, e.g. electrons of transition metal ions. Berardan et al. probed the geometry of the Cu ion in (MgCoNiCuZn)0.9Li0.1O and (MgCoNiZn)0.74Cu0.26O lattices.66 They found that the EPR signal of the first composition was isotropic, which corresponds to the octahedral environment expected from the rock salt structure. While the second composition, i.e. the Cu-rich one, had a distorted EPR signal, which indicates that there was significant distortion from the ideal rock salt structure. The deviation originates from a controllable Jahn–Teller distortion. DFT calculations from Rák et al. support the experimental results.67
Anand et al. constructed 23![[thin space (1/6-em)]](https://www.rsc.org/images/entities/char_2009.gif) 536 supercells for the 5-component (Mg,Co,Cu,Ni,Zn)O system with a rock salt lattice, and each supercell had 1000 cations and 1000 oxygen anions.68 Molecular dynamics using the Buckingham interatomic potential was conducted to capture the local structures. It was found that in supercells with higher configurational energies, less Cu2+–Cu2+ pairs but more Cu2+–Zn2+ pairs were present. No particular ordering was found for the other 13 types of pairs (Fig. 6a). Based on nearest-neighbour distance analysis, it was found that Cu2+–Cu2+ and Cu2+–O2− pairs have lowest cation–cation and cation–anion bond lengths with minimum variation, respectively.
536 supercells for the 5-component (Mg,Co,Cu,Ni,Zn)O system with a rock salt lattice, and each supercell had 1000 cations and 1000 oxygen anions.68 Molecular dynamics using the Buckingham interatomic potential was conducted to capture the local structures. It was found that in supercells with higher configurational energies, less Cu2+–Cu2+ pairs but more Cu2+–Zn2+ pairs were present. No particular ordering was found for the other 13 types of pairs (Fig. 6a). Based on nearest-neighbour distance analysis, it was found that Cu2+–Cu2+ and Cu2+–O2− pairs have lowest cation–cation and cation–anion bond lengths with minimum variation, respectively.
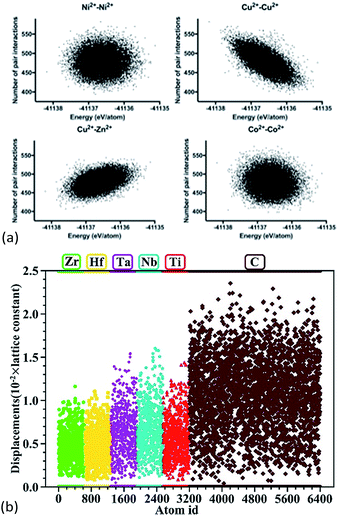 | ||
Fig. 6 (a) Molecular dynamics of 23![[thin space (1/6-em)]](https://www.rsc.org/images/entities/char_2009.gif) 536 (Mg,Co,Cu,Ni,Zn)O supercells. The dots show the dependence of number of next nearest-neighbour cation–cation pairs on the total energies of formation of the supercells.68 For the 15 possible types (of which only 4 are shown here) of cation–cation pairs, only Cu2+–Cu2+ and Cu2+–Zn2+ pairs show an energetical dependence. (b) DFT calculations of (Hf0.2Zr0.2Ta0.2Nb0.2Ti0.2)C. The dots show atomic displacements of each individual atom from its ideal position in a rock salt structure.57 Reproduced with permission. (a) Copyright 2018, Elsevier.68 (b) Copyright 2018, John Wiley and Sons.57 536 (Mg,Co,Cu,Ni,Zn)O supercells. The dots show the dependence of number of next nearest-neighbour cation–cation pairs on the total energies of formation of the supercells.68 For the 15 possible types (of which only 4 are shown here) of cation–cation pairs, only Cu2+–Cu2+ and Cu2+–Zn2+ pairs show an energetical dependence. (b) DFT calculations of (Hf0.2Zr0.2Ta0.2Nb0.2Ti0.2)C. The dots show atomic displacements of each individual atom from its ideal position in a rock salt structure.57 Reproduced with permission. (a) Copyright 2018, Elsevier.68 (b) Copyright 2018, John Wiley and Sons.57 | ||
Ye et al. built 100 supercells for rock salt (Hf0.2Zr0.2Ta0.2Nb0.2Ti0.2)C.57 Each supercell contained 64 atoms with a random distribution of the metal atoms, and the cation stoichiometry was nearly equimolar. These supercells were then fully relaxed using DFT calculations to give total energies and atomic positions. The displacement of the atoms shows that generally the anion (i.e. carbon) has larger displacements than the cations (Fig. 6b), suggesting that the lattice distortion in these HEC carbides occurs mainly through the anion sublattice. A similar anion lattice distortion was also reported for DFT calculations of the HEC oxide64,69 Mg0.2Co0.2Ni0.2Cu0.2Zn0.2O and sulphide Cu5SnMgGeZnS9.7
5. Properties and applications
The review of properties of HECs in this section shows that the addition of multiple elements not only allows new materials to be synthesized but also leads to an enhancement of physical effects and potentially new physics in the case of thermal conductivity. It also raises some fundamental questions, such as, the meaning of band structure in the case of semiconductor materials and the origin of strengthening effects in plasticity. The types of HECs for specific applications are listed in Table 1.| Application | HECs under investigation | Design model |
|---|---|---|
| Low thermal conductivity | Oxides8 | MD + Green–Kubo formula |
| Thermoelectric | Chalcogenides,6,7 half Heusler6,16 | DFT + Boltzmann transport equations |
| Structural materials | Carbides,20,33,42,57,59,60,70 | DFT + hardness models |
| Borides,14,71,72 | ||
| Nitrides73 | ||
| Catalyst | Oxides47,74 | DFT |
| Dielectrics | Oxides12 | DFT |
| Magnetic | Oxides67,75,76 | DFT |
Design models for property predictions are useful to guide HEC composition selection. As listed in Table 1, they are generally well developed and have gained great success in simple crystal structures. The main challenge for applying them to HECs lies in the domain of DFT and MD, i.e. the limited SQS size in DFT due to the demanding computational power, and the lack of availability of accurate interatomic potentials for multi-component systems in MD. The properties modelling of HECs is at its infant stage but is growing rapidly.
5.1 Thermal conductivity
The thermal conductivity of solids is determined by both phonon and electron transport. In the literature on HECs, the phonon part, i.e. the lattice thermal conductivity, has been the most commonly reported and analysed. The electronic contribution to the thermal conductivity has, however, barely been discussed. Therefore, this section mainly focuses on the lattice thermal conductivity.J. Braun et al.8 investigated the thermal conductivities of five-cation MgCoNiCuZnO5 and six-cation MgCoNiCuZnXO6 (X = Sc, Sb, Sn, Cr or Ge) thin films grown epitaxially on MgO substrates using Time- and Frequency-Domain Thermoreflectance. They found that these high entropy oxides possess amorphous-like thermal conductivities, which drop by a factor of two to ∼1.4 W m−1 K−1 when a sixth cation is added, regardless of the mass added (Fig. 7a). They attributed these low thermal conductivities to local ionic charge disorder in addition to mass and strain field contrast. Another advantage of these high entropy oxides is that they possess the highest ratio of elastic modulus to thermal conductivity of any isotropic crystal (Fig. 7b), as the local ionic charge disorder effectively reduces thermal conductivity without compromising mechanical stiffness.
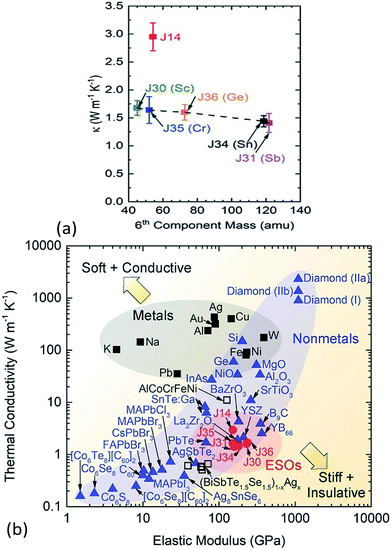 | ||
| Fig. 7 (a) Thermal conductivity (κ) of six-cation MgCoNiCuZnXO6 (X = Sc, Sb, Sn, Cr or Ge) high entropy oxides as a function of sixth atomic mass. The five-cation MgCoNiCuZnO5 (J14 in red) is also shown at its average cation mass as a reference. (b) Thermal conductivity (κ) versus elastic modulus (E) for isotropic crystals at room temperature. The metals (squares) group has a subset of HEAs (open squares) and the non-metals (blue triangles) group has a subset of entropy stabilized oxides (ESOs, red circles). Reproduced with permission. Copyright 2018, John Wiley and Sons.8 | ||
Junqin Li et al. fabricated multi-element telluride (Sn0.7Ge0.2Pb0.1)1−xMn1.1xTe77 and half Heusler Nb1−x(HfZrMoVTi)xFeSb.16 The lattice thermal conductivities were 0.32 W m−1 K−1 at 900 K for (Sn0.7Ge0.2Pb0.1)0.75Mn0.275Te and 2.5 W m−1 K−1 at 873 K for Nb0.6(HfZrMoVTi)0.4FeSb. Compared to SnTe or NbFeSb, the reduction in the thermal conductivities is 78% and 55%, respectively, and the value for the HEC telluride is lower than the amorphous limit of SnTe. Both HECs contain nanoscale second phase precipitates, therefore the influence of multielement on lattice thermal conductivity was not quantified.
Yan et al.78 fabricated single phase (Hf0.2Zr0.2Ta0.2Nb0.2Ti0.2)C using high-energy ball milling and spark plasma sintering. The high entropy carbides exhibited a much lower thermal conductivity (6.45 W m−1 K−1) than the binary carbides HfC (29.3 W m−1 K−1) and TaC (33.5 W m−1 K−1) at room temperature. They attributed the thermal conductivity reduction to significant phonon scattering by the distorted anion sublattice. They proposed that the lattice distortion in (Hf0.2Zr0.2Ta0.2Nb0.2Ti0.2)C occurs mainly through the anion sublattice, based on the fact that (Hf0.2Zr0.2Ta0.2Nb0.2Ti0.2)C and (Mg0.2Co0.2Ni0.2Cu0.2Zn0.2)O have similar rock-salt structures, and in (Mg0.2Co0.2Ni0.2Cu0.2Zn0.2)O the distortion from an ideal rock-salt structure occurs primarily through disorder of the anion sublattice, which was confirmed by an extended X-ray absorption fine structure (EXAFS) analysis.64 It is worth mentioning that the carbon stoichiometry of the samples was not analysed, which has an effect on the thermal conductivity due to phonon scattering by carbon vacancies.79
Gild et al.18 fabricated eight single phase high entropy fluorite oxides (HEFO) with five principal cations (in addition to a four-principal-cation (Hf0.25Zr0.25Ce0.25Y0.25)O2−δ as a starting point and baseline) by high energy ball milling, spark plasma sintering, and annealing in air. These single-phase high entropy oxides possess lower thermal conductivities than 8 mol% Y2O3-stabilized ZrO2 (8YSZ), and the lowest one is 1.1 W m−1 K−1 for (Hf0.25Zr0.25Ce0.25)(Y0.125Ca01.25)O2−δ, which is almost half of the value of 8YSZ (2 W m−1 K−1). The reduced thermal conductivities are likely related to increased phonon scattering in the system due to multiple metal cations, which can lead to reductions in the phonon mean free path due to scattering from mass and bond disorder. They concluded that high-entropy effects do appear to reduce thermal conductivities in general. K. Chen et al.80 prepared single phase (Ce0.2Zr0.2Hf0.2Sn0.2Ti0.2)O2 using the same methods, and obtained a room-temperature thermal conductivity of 1.28 W m−1 K−1.
| τd−1 = Aω4 | (6) |
 | (7) |
An alternative approach to calculate lattice thermal conductivity is to use molecular dynamics,84 including both equilibrium molecular dynamics (EMD) using the Green–Kubo formula, and non-equilibrium molecular dynamics (NEMD), which directly creates a temperature gradient in a large supercell. A. Giri et al.85,86 employed the widely used 12–6 Lennard Jones (LJ) potential and NEMD method to investigate the lattice thermal conductivity of a five component solid solution. They found that the thermal conductivity reduction due to mass scattering alone reached a critical point, and a further decrease in thermal conductivity requires a change in local strain-field.86 For example, comparing 2-component and 5-component solid solutions, only introducing mass contrast results in a one third reduction of thermal conductivity, but by changing the interatomic potential parameter (a way to introduce strain field fluctuation) plus mass contrast, the reduction can be more than a half. They also found that the thermal conductivity of solid solutions with an ordered sublattice had a pronounced temperature dependence in comparison to their fully disordered counterparts. The reason is that in ordered systems, anharmonic effects result in large temperature dependencies of thermal conductivities, while in disordered systems, impurity scattering leads to a largely reduced dependence on temperature.85
M. Lim et al.87 used the EMD method to study the thermal conductivity of J14 (Mg0.2Co0.2Ni0.2Cu0.2Zn0.2)O as well as J14 plus Sc, Sn, Cr, or Ge in equal-molar cation proportions (Fig. 8). The simulations used a Buckingham potential, whose parameters were taken from MgO, plus coulombic electrostatic forces where the charge values were obtained from DFT calculations. By manipulating the mass and charges, it was shown that atomic charge disorder should be included to explain the low thermal conductivity of the experimental data of these high entropy oxides. For the MD simulations discussed above, it is worth noting that the interatomic potentials in these models are oversimplified compared with a real system due to the difficulties in developing highly reliable potentials for the complex high entropy systems. The advantage of the MD simulations is that they provide some insight at the atomic scale to explain the low thermal conductivity behaviour of HECs.
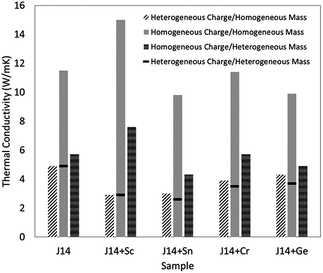 | ||
| Fig. 8 Thermal conductivities using different combinations in molecular dynamics simulations, in order to show the influence of charge disorder and mass contrast on thermal conductivity. The systems are J14 (Mg0.2Co0.2Ni0.2Cu0.2Zn0.2)O, and J14 plus Sc, Sn, Cr, or Ge in equal-molar cation proportions. Reproduced with permission. Copyright 2019, AIP Publishing.87 | ||
DFT provides a general framework for modelling complex atomic interactions. As a parameter free method, DFT can provided input parameters to other formalism for lattice thermal conductivity calculations. Due to its high computational cost, DFT has not yet been used for high entropy systems, while its application for binary solid solution has given some promising results. For instance, A. Henry et al.88 used EMD to simulate the thermal conductivity of InxGa1−xAs, in which the parameters for the interatomic potentials were determined using DFT data. Other approaches include calculating interatomic force constants (IFCs) using DFT, then using these IFCs with the Peierls–Boltzmann transport (PBT) equation (e.g. as implemented in Sheng BTE89) or Green's functions.90 It is worth noting that virtual crystal approximation (VCA), which is usually used to calculate the thermal conductivity of alloys,91 is not suitable for high entropy compounds, as charge disorder needs to be considered.8 There is continuous effort to develop new phonon transport theory for disordered systems.92 With the rapidly growing computation power for large scale DFT calculation, DFT based thermal conductivity modelling of HECs is emerging.
5.2 Thermoelectric properties
The electrical conductivity of high entropy sulfide Cu3Sn1+xMgGeZnS9 (x = 0,0.1,0.2) shows an interesting temperature dependence7 (Fig. 9). Below 523 K, Cu5Sn1.1MgGeZnS9 first shows metallic behavior, then the electrical conductivity shows a small maximum; while Cu5Sn1.2MgGeZnS9 shows semiconducting behavior. The authors attribute the behavior to the thermal activation of carriers and localized states introduced by disorder, but this suggestion needs further electronic structure studies to support it. It is worth noting that some high entropy oxides, such as Sr(Zr0.2Sn0.2Ti0.2Hf0.2Nb0.2)O3, are not electrically conductive, although they should have dopant carriers based on the valence of their cations. The reason for this is still unclear. Again, further electronic structure studies including DFT calculations would be useful to clarify this.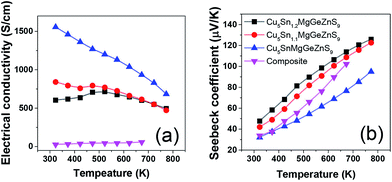 | ||
| Fig. 9 Temperature dependent (a) electrical conductivity and (b) Seebeck coefficient of high entropy sulfide Cu5Sn1+xMgGeZnS9 (x = 0, 0.1, 0.2). The values for Cu3SnS4–Cu2MgGeS4–ZnS composite are also shown for comparison. Reproduced under the terms of the CC-BY 4.0 license. Copyright 2018, the authors, published by ACS Publications.7 | ||
The high entropy concept is also beneficial for increasing thermopower, also known as Seebeck coefficient, which is a measure of the magnitude of an induced thermoelectric voltage in response to a temperature difference across a material. The randomly distributed atoms increase the crystal structure symmetry and hence band symmetry, which is favorable for achieving high thermopower. Liu et al.6 reported that the room temperature thermopower of (Cu/Ag)(In/Ga)Te2- and Cu2(S/Se/Te)-based multicomponent materials increases with configurational entropy. Recent studies also show that entropy favors a rhombohedral-to-cubic structure transition in GeSe, when AgSbSe2 (ref. 93) or AgBiSe2 (ref. 94) was added to increase the entropy of the system. Consequently, the thermopower is improved.
5.3 Ionic conductivity for Li-ion battery
D. Bérardan et al.13 fabricated single phase (MgCoNiCuZn)1−x−yGayAxO (A = Li, Na, K). Firstly, they confirmed that these materials were electronic insulators by investigating the evolution of the current density during a 1 V potential step over 2 days with blocking electrodes. Then they found that the room temperature Li+ conductivity of the Li >20% (mole% on A-site) compound exceeds that of LiPON by 2 orders of magnitude (Fig. 10), which makes these HECs very attractive for applications as solid electrolytes. The ionic conduction probably occurs through the oxygen vacancies, which are created by charge compensation when a monovalent element (e.g. Li+) is introduced, and larger ionic conductivity values could probably be obtained by optimizing the concentration or ordering of oxygen vacancies as well as the size of the divalent cations in the compound.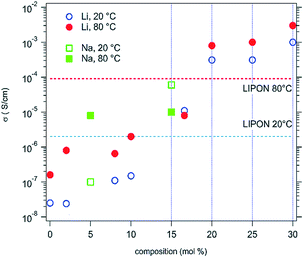 | ||
| Fig. 10 Ionic conductivities for high entropy (MgCoNiCuZn)1−x−yGayAxO samples, where A = Li (circles) or Na (squares). The values usually observed for a LiPON solid conductor are also shown for comparison. Reproduced under the terms of the CC-BY 4.0 license. Copyright 2016, the authors, published by RSC Publishing.13 | ||
However, the HEFOs fabricated by Gild et al.18 showed significantly lower ionic conductivities than 8 mol% Y2O3-stabilized ZrO2 (8YSZ). Arrhenius plots of ln(σT) vs. 1000 T gave similar activation energies of 1.14–1.29 eV for all the high entropy oxides. They attributed the lower ionic conductivity to the much higher doping levels of the HEFOs compared to 8YSZ.
5.4 Mechanical properties
There have been only a few reports on the mechanical properties of HECs and these have focused on transition metal carbides. Csanádi et al.42 investigated the nanoindentation of (Hf–Ta–Zr–Nb)C and found that the HEC had a higher indentation modulus than all of the monocarbides, and 8% higher than a rule of mixtures average of the values for the individual monocarbides (Fig. 11a). The indentation hardness was notably higher for the HEC (36.1 ± 1.6 GPa) compared to the hardest monocarbide HfC (31.5 ± 1.3 GPa) and the binary carbide (Hf–Ta)C (32.9 ± 1.8 GPa), and 30% higher than the value for the rule of mixtures (27.7 GPa) (Fig. 11b). Yan X et al.78 reported elastic (nanoindentation) and Vicker's hardness results for (Ti,Zr,Hf,Ta,Nb,Ta)C and found that they were comparable to those of the monocarbides reported in the literature. However, the HEC had a theoretical density of only 93%, which would have resulted in a relatively low Vicker's hardness. Sarker P et al.20 synthesised several five transition metal containing carbides and found a general increase in the nanoindentation elastic modulus and hardness compared to the monocarbides, comparable to that reported by Csanadi et al.70 Ye et al.57 have reported a very high nanoindentation hardness for (Ti,Zr,Hf,Nb,Ta)C of 40.6 GPa, and also an indentation elastic modulus higher than the rule of mixture value for the monocarbides obtained from the literature. They also found the indentation fracture behaviour and properties to be similar to those of the monocarbides reported in the literature.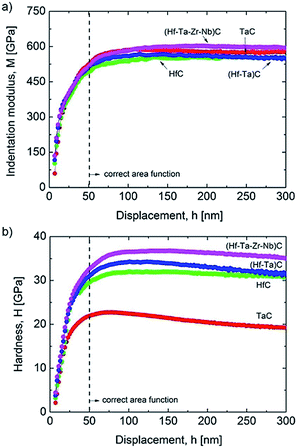 | ||
| Fig. 11 Comparison of: (a) indentation modulus; and (b) hardness depth-profiles of the mono, binary and high-entropy carbide (Hf–Ta–Zr–Nb)C. The results were averaged from 64 indents made per sample, following rejection of those close to grain boundaries and pores. Reproduced under the terms of the CC-BY 4.0 license. Copyright 2018, the authors, published by Springer Nature.42 | ||
Harrington T. J. et al.59 investigated the relationship between the nanoindentation elastic modulus and hardness of several five transition metal carbides with their electronic properties. They found a good correlation between these properties and the Valence Electron Concentration (VEC), with the indentation elastic modulus increasing and the hardness decreasing with VEC increasing from 8.4 to 9.4. The origin of the reported increased yield stress of HECs compared to the mono and binary carbides may also be related to the local lattice distortions in a similar way to solid solution hardening in metal alloys.95 The theories for metals are limited to small concentrations of solute atoms, and new approaches are needed to describe the effect of multi-elements on yield in HECs. In order to understand the plasticity of HECs we need to know their dislocation slip systems. The plastic deformation behaviour of group IV and V transition metal carbides is still being debated. It is generally considered that the group IV carbides slip on {011} planes, while the group V carbides slip on {111}.96–102 This therefore raised the interesting question of what is the dominant slip system of (Zr,Hf,Nb,Ta)C. In recent work by Csanadi et al.70 they found from analysis of slip traces in micropillar compression experiments (effectively single crystal) that the dominant slip system for the monocarbides of Ta and Hf, and (Zr,Hf,Nb,Ta)C, was {110} 〈1![[1 with combining macron]](https://www.rsc.org/images/entities/char_0031_0304.gif) 0〉 (Fig. 12b). They also found a significantly higher yield stress for the HEC compared to that of the monocarbides (58% higher compared to HfC) (Fig. 12a) while retaining a ductility comparable to TaC. The preliminary results on the mechanical properties of HEC carbides suggests that the elastic and plastic behaviour of these materials are not simply a rule of mixtures and that significant improvements in strength can be achieved.
0〉 (Fig. 12b). They also found a significantly higher yield stress for the HEC compared to that of the monocarbides (58% higher compared to HfC) (Fig. 12a) while retaining a ductility comparable to TaC. The preliminary results on the mechanical properties of HEC carbides suggests that the elastic and plastic behaviour of these materials are not simply a rule of mixtures and that significant improvements in strength can be achieved.
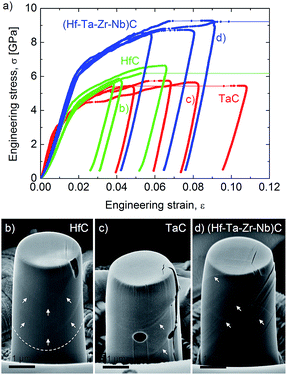 | ||
| Fig. 12 (a) An enhanced yield and failure strength for the (Hf–Ta–Zr–Nb)C high entropy carbide. The stress–strain curves were obtained during micropillar compression of individual grains. Micropillars of similar orientations (Φ ∼ 14°) exhibit limited plasticity for grains of (b) HfC but more ductile behaviour for (c) TaC and (d) (Hf–Ta–Zr–Nb)C high-entropy carbide. Slip traces on micropillar surfaces are marked by arrows. Reproduced under the terms of the CC-BY 4.0 license. Copyright 2019, the authors, published by Springer Nature.70 | ||
6 Summary and outlook
The emerging topic of high entropy ceramics opens up a large new compositional space, with the possibility of new materials with enhanced properties and demonstrating new phenomena. The early work on a wide range of materials, including oxides, sulphides and carbides suggests that it is possible to synthesise single phase materials. However, closer examination of these materials may reveal some degree of ordering of the elements at the atomic scale. Some materials may turn out to be entropy stabilised to room temperature, while others may only be stable at high temperatures and show a miscibility gap on cooling. To elucidate these points will require more detailed structural analysis of these materials using a range of techniques, including direct methods such as total scattering with neutrons and X-rays, EXAFS and atom probe tomography, supported by indirect methods such as NMR and ESR.103 It is worth noting that NMR has not yet been applied to the characterization of HECs, while it has been used for decades to study solid solutions. NMR elucidated the local atomic arrangement of Ti and Sn in Y2Ti2−xSnxO7 pyrochlore solid solutions104,105 supported by DFT calculations.106With the development of tools to predict the synthesisability of HECs and the application of artificial intelligence, we could see the rapid emergence of interesting new materials that could open up new lines of research and applications. The modelling of these materials will be challenging because of the large number of elements involved and their mixed covalent and ionic bonding. One particularly challenging task is to find stable compounds in the multi-element composition space. To do this the Gibbs free energy of all of the possible structures needs be compared. It is not likely that brute force methods can be used in this situation because of the limits of computational power. Therefore, advanced searching algorithms need to be developed, such as the constraint satisfaction algorithm used by Abu-Odeh et al.26 for the exploration of the HEA composition space.
To date, the effect of multi-elements on non-stoichiometry has not been well investigated. Considering the rich crystal chemistry of non-stoichiometric compounds and the strong dependence of their properties on deviation from stoichiometry, this presents a potentially exciting new area of research for high entropy ceramics. It raises some interesting questions: will the range of deviation from stoichiometry change; will the mechanisms of accommodating non-stoichiometry change; and will it lead to SRO; and will it change the stability of HECs?
Most of the materials studied to date have been prepared using solid state synthesis and densification by sintering. There has been some work on the synthesis of powders by chemical routes. The presence of multi-elements could lead to blockages in the synthesis of some HECs because of the formation of stable intermediate phases. The “cocktail” effect in these materials may lead to lower diffusion rates, which may present kinetic barriers to the synthesis and densification of the materials. This will require efforts to optimise the currently used processing routes or the synthesis of materials through non-equilibrium routes, for example, arc melting and rapid cooling.
With the use of increasing numbers of elements there will be greater constraints on the use of elements based on cost, toxicity and sustainability. One way in which this could be mitigated is to use inexpensive, crude, mineral precursors containing the component elements. Minerals commonly contain multi-elements and are prototypes of many functional materials. This is similar to the approach used by Xu Lu et al. in their work on multi-element tetrahedrite thermoelectrics.107 This approach may also help to mitigate the potential problem of slow kinetics of reaction during synthesis by the solid state route.
The properties of functional materials are often very sensitive to composition and stoichiometry. This means that there will be a greater challenge to prepare the target composition of the precursors and also to control the volatilisation of elements during processing, particularly on an industrial scale.
In this review we have identified three fundamental questions that need to be answered and highlighted the impact of multi-elements on reducing thermal conductivity and increasing yield stress. These results could lead to the development of new thermoelectrics and ultra-high melting temperature ceramics for extreme environments. The novelty of HECs means that there are considerable opportunities to identify other interesting effects on other properties. Some interesting recent work has been reported on multi-element oxides that show promising properties as enhanced thermochemical water splitting catalysts74 and CO oxidation catalysts.47 There have also been a few reports of interesting magnetic effects in (Mg,Ni,Co,Zn,Cu)O based rock salt structured oxides67,75 and perovskite structured oxides;76 including a compressive Jahn–Teller distortion and long range magnetic order despite substantial chemical and structural disorder on the metal sublattice.
Conflicts of interest
There are no conflicts to declare.Acknowledgements
This work was supported by Engineering and Physical Sciences Research Council (EPSRC), MASSIVE project (Grant No. EP/L017695/1). RZ acknowledges the support from Natural Science Foundation of China (11674264).References
- J. W. Yeh, S. K. Chen, S. J. Lin, J. Y. Gan, T. S. Chin, T. T. Shun, C. H. Tsau and S. Y. Chang, Adv. Eng. Mater., 2004, 6(5), 299–303 CrossRef CAS.
- B. Cantor, I. T. H. Chang, P. Knight and A. J. B. Vincent, Mater. Sci. Eng., A, 2004, 375–377, 213–218 CrossRef.
- B. S. Murty, J.-W. Yeh, S. Ranganathan and P. P. Bhattacharjee, High-Entropy Alloys, Elsevier, 2019 Search PubMed.
- M. C. Gao, J.-W. Yeh, P. K. Liaw and Y. Zhang, in High-Entropy Alloys: Fundamentals and Applications, Springer International Publishing, 2016 Search PubMed.
- C. M. Rost, E. Sachet, T. Borman, A. Moballegh, E. C. Dickey, D. Hou, J. L. Jones, S. Curtarolo and J. P. Maria, Nat. Commun., 2015, 6, 8485 CrossRef CAS PubMed.
- R. Liu, H. Chen, K. Zhao, Y. Qin, B. Jiang, T. Zhang, G. Sha, X. Shi, C. Uher, W. Zhang and L. Chen, Adv. Mater., 2017, 29(38), 1702712 CrossRef PubMed.
- R.-Z. Zhang, F. Gucci, H. Zhu, K. Chen and M. J. Reece, Inorg. Chem., 2018, 57(20), 13027–13033 CrossRef CAS PubMed.
- J. L. Braun, C. M. Rost, M. Lim, A. Giri, D. H. Olson, G. N. Kotsonis, G. Stan, D. W. Brenner, J.-P. Maria and P. E. Hopkins, Adv. Mater., 2018, 30(51), 1805004 CrossRef PubMed.
- V. Braic, A. Vladescu, M. Balaceanu, C. R. Luculescu and M. Braic, Surf. Coat. Technol., 2012, 211, 117–121 CrossRef CAS.
- M.-H. Hsieh, M.-H. Tsai, W.-J. Shen and J.-W. Yeh, Surf. Coat. Technol., 2013, 221, 118–123 CrossRef CAS.
- W. J. Shen, M. H. Tsai, K. Y. Tsai, C. C. Juan, C. W. Tsai, J. W. Yeh and Y. S. Chang, J. Electrochem. Soc., 2013, 160(11), C531–C535 CrossRef CAS.
- D. Bérardan, S. Franger, D. Dragoe, A. K. Meena and N. Dragoe, Phys. Status Solidi RRL, 2016, 10(4), 328–333 CrossRef.
- D. Bérardan, S. Franger, A. K. Meena and N. Dragoe, J. Mater. Chem. A, 2016, 4(24), 9536–9541 RSC.
- J. Gild, Y. Zhang, T. Harrington, S. Jiang, T. Hu, M. C. Quinn, W. M. Mellor, N. Zhou, K. Vecchio and J. Luo, Sci. Rep., 2016, 6, 37946 CrossRef CAS PubMed.
- J. Gild, J. Braun, K. Kaufmann, E. Marin, T. Harrington, P. Hopkins, K. Vecchio and J. Luo, Journal of Materiomics, 2019 DOI:10.1016/j.jmat.2019.03.002.
- J. Yan, F. Liu, G. Ma, B. Gong, J. Zhu, X. Wang, W. Ao, C. Zhang, Y. Li and J. Li, Scr. Mater., 2018, 157, 129–134 CrossRef CAS.
- S. Jiang, T. Hu, J. Gild, N. Zhou, J. Nie, M. Qin, T. Harrington, K. Vecchio and J. Luo, Scr. Mater., 2018, 142, 116–120 CrossRef CAS.
- J. Gild, M. Samiee, J. L. Braun, T. Harrington, H. Vega, P. E. Hopkins, K. Vecchio and J. Luo, J. Eur. Ceram. Soc., 2018, 38(10), 3578–3584 CrossRef CAS.
- W. Hume-Rothery, W. Mabbott Gilbert, K. M. Channel Evans and H. Carpenter Henry Cort, Philos. Trans. R. Soc., A, 1934, 233(721–730), 1–97 CrossRef CAS.
- P. Sarker, T. Harrington, C. Toher, C. Oses, M. Samiee, J.-P. Maria, D. W. Brenner, K. S. Vecchio and S. Curtarolo, Nat. Commun., 2018, 9(1), 4980 CrossRef PubMed.
- R. Ramprasad, R. Batra, G. Pilania, A. Mannodi-Kanakkithodi and C. Kim, npj Comput. Mater., 2017, 3(1), 54 CrossRef.
- L. M. Ghiringhelli, J. Vybiral, S. V. Levchenko, C. Draxl and M. Scheffler, Phys. Rev. Lett., 2015, 114(10), 105503 CrossRef PubMed.
- R. D. Shannon, Acta Crystallogr., Sect. A: Cryst. Phys., Diffr., Theor. Gen. Crystallogr., 1976, 32, 751 CrossRef.
- I. D. Brown, Struct. Bonding, 2013, 158, 11–58 CrossRef.
- A. Zunger, Phys. Rev. B: Condens. Matter Mater. Phys., 1980, 22(12), 5839–5872 CrossRef CAS.
- A. Abu-Odeh, E. Galvan, T. Kirk, H. Mao, Q. Chen, P. Mason, R. Malak and R. Arróyave, Acta Mater., 2018, 152, 41–57 CrossRef CAS.
- M. C. Gao, C. Zhang, P. Gao, F. Zhang, L. Z. Ouyang, M. Widom and J. A. Hawk, Curr. Opin. Solid State Mater. Sci., 2017, 21(5), 238–251 CrossRef CAS.
- M. Widom, J. Mater. Res., 2018, 33(19), 1–18 CrossRef.
- A. Sarkar, Q. Wang, A. Schiele, M. R. Chellali, S. S. Bhattacharya, D. Wang, T. Brezesinski, H. Hahn, L. Velasco and B. Breitung, Adv. Mater., 2019, 1806236 CrossRef PubMed.
- A. Zunger, S. Wei, L. G. Ferreira and J. E. Bernard, Phys. Rev. Lett., 1990, 65(3), 353–356 CrossRef CAS PubMed.
- H. Zhang, D. Hedman, P. Feng, G. Han and F. Akhtar, Dalton Trans., 2019, 48, 5161–5167 RSC.
- A. van de Walle, Calphad, 2009, 33(2), 266–278 CrossRef CAS.
- B. Ye, T. Wen, M. C. Nguyen, L. Hao, C.-Z. Wang and Y. Chu, Acta Mater., 2019, 170, 15–23 CrossRef CAS.
- P. Soven, Phys. Rev., 1967, 156(3), 809–813 CrossRef CAS.
- N. Saunders and A. P. Miodownik, CALPHAD (Calculation of Phase Diagrams): A Comprehensive Guide, Pergamon, 1998 Search PubMed.
- S. Gorsse and N. O. Senkov, Entropy, 2018, 20(12), 899 CrossRef CAS.
- R. K. Pathria and P. D. Beale, Statistical Mechanics, Elsevier, 2011 Search PubMed.
- J. M. Sanchez, Phys. Rev. B: Condens. Matter Mater. Phys., 2010, 81(22), 224202 CrossRef.
- J. M. Sanchez, Phys. Rev. B: Condens. Matter Mater. Phys., 1993, 48(18), 14013–14015 CrossRef CAS PubMed.
- D. Lerch, O. Wieckhorst, G. L. W. Hart, R. W. Forcade and S. Müller, Modell. Simul. Mater. Sci. Eng., 2009, 17(5), 055003 CrossRef.
- Y. Lederer, C. Toher, K. S. Vecchio and S. Curtarolo, Acta Mater., 2018, 159, 364–383 CrossRef CAS.
- E. Castle, T. Csanádi, S. Grasso, J. Dusza and M. Reece, Sci. Rep., 2018, 8(1), 8609 CrossRef PubMed.
- W. Hong, F. Chen, Q. Shen, Y.-H. Han, W. G. Fahrenholtz and L. Zhang, J. Am. Ceram. Soc., 2019, 102(4), 2228–2237 CrossRef CAS.
- A. Sarkar, R. Djenadic, N. J. Usharani, K. P. Sanghvi, V. S. K. Chakravadhanula, A. S. Gandhi, H. Hahn and S. S. Bhattacharya, J. Eur. Ceram. Soc., 2017, 37(2), 747–754 CrossRef CAS.
- M. Biesuz, L. Spiridigliozzi, G. Dell'Agli, M. Bortolotti and V. M. Sglavo, J. Mater. Sci., 2018, 53(11), 8074–8085 CrossRef CAS.
- A. Sarkar, L. Velasco, D. Wang, Q. Wang, G. Talasila, L. de Biasi, C. Kübel, T. Brezesinski, S. S. Bhattacharya, H. Hahn and B. Breitung, Nat. Commun., 2018, 9(1), 3400 CrossRef PubMed.
- H. Chen, J. Fu, P. Zhang, H. Peng, C. W. Abney, K. Jie, X. Liu, M. Chi and S. Dai, J. Mater. Chem. A, 2018, 6(24), 11129–11133 RSC.
- Q. Wang, A. Sarkar, D. Wang, L. Velasco, R. Azmi, S. S. Bhattacharya, T. Bergfeldt, A. Düvel, P. Heitjans, T. Brezesinski, H. Hahn and B. Breitung, Energy Environ. Sci., 2019 10.1039/C9EE00368A.
- A. Sarkar, C. Loho, L. Velasco, T. Thomas, S. S. Bhattacharya, H. Hahn and R. Djenadic, Dalton Trans., 2017, 46(36), 12167–12176 RSC.
- Z. Lei, X. Liu, R. Li, H. Wang, Y. Wu and Z. Lu, Scr. Mater., 2018, 146, 340–343 CrossRef CAS.
- Y. Sharma, B. L. Musico, X. Gao, C. Hua, A. F. May, A. Herklotz, A. Rastogi, D. Mandrus, J. Yan, H. N. Lee, M. F. Chisholm, V. Keppens and T. Z. Ward, Phys. Rev. Mater., 2018, 2(6), 060404 CrossRef CAS.
- P. B. Meisenheimer, T. J. Kratofil and J. T. Heron, Sci. Rep., 2017, 7(1), 13344 CrossRef CAS PubMed.
- L. E. Cross, Ferroelectrics, 1987, 76(1), 241–267 CrossRef CAS.
- C. J. Vineis, A. Shakouri, A. Majumdar and M. G. Kanatzidis, Adv. Mater., 2010, 36, 3970–3980 CrossRef PubMed.
- D. B. Miracle and O. N. Senkov, Acta Mater., 2017, 122, 448–511 CrossRef CAS.
- E. J. Pickering and N. G. Jones, Int. Mater. Rev., 2016, 61(3), 183–202 CrossRef CAS.
- B. Ye, T. Wen, K. Huang, C. Z. Wang and Y. Chu, J. Am. Ceram. Soc., 2019, 102(7), 4344–4352 CrossRef CAS.
- J. Zhou, J. Zhang, F. Zhang, B. Niu, L. Lei and W. Wang, Ceram. Int., 2018, 44(17), 22014–22018 CrossRef CAS.
- T. J. Harrington, J. Gild, P. Sarker, C. Toher, C. M. Rost, O. F. Dippo, C. McElfresh, K. Kaufmann, E. Marin, L. Borowski, P. E. Hopkins, J. Luo, S. Curtarolo, D. W. Brenner and K. S. Vecchio, Acta Mater., 2019, 166, 271–280 CrossRef CAS.
- J. Dusza, P. Švec, V. Girman, R. Sedlák, E. G. Castle, T. Csanádi, A. Kovalčíková and M. J. Reece, J. Eur. Ceram. Soc., 2018, 38(12), 4303–4307 CrossRef CAS.
- C. Peng, X. Gao, M. Wang, L. Wu, H. Tang, X. Li, Q. Zhang, Y. Ren, F. Zhang, Y. Wang, B. Zhang, B. Gao, Q. Zou, Y. Zhao, Q. Yang, D. Tian, H. Xiao, H. Gou, W. Yang, X. Bai, W. L. Mao and H.-k. Mao, Appl. Phys. Lett., 2019, 114(1), 011905 CrossRef.
- T. F. Kelly and D. J. Larson, Annu. Rev. Mater. Res., 2012, 42(1), 1–31 CrossRef CAS.
- M. R. Chellali, A. Sarkar, S. H. Nandam, S. S. Bhattacharya, B. Breitung, H. Hahn and L. Velasco, Scr. Mater., 2019, 166, 58–63 CrossRef CAS.
- C. M. Rost, Z. Rak, D. W. Brenner and J.-P. Maria, J. Am. Ceram. Soc., 2017, 100(6), 2732–2738 CrossRef CAS.
- D. A. Keen and A. L. Goodwin, Nature, 2015, 521, 303 CrossRef CAS PubMed.
- D. Berardan, A. K. Meena, S. Franger, C. Herrero and N. Dragoe, J. Alloys Compd., 2017, 704, 693–700 CrossRef CAS.
- Z. Rák, J. P. Maria and D. W. Brenner, Mater. Lett., 2018, 217, 300–303 CrossRef.
- G. Anand, A. P. Wynn, C. M. Handley and C. L. Freeman, Acta Mater., 2018, 146, 119–125 CrossRef CAS.
- Z. Rak, C. M. Rost, M. Lim, P. Sarker, C. Toher, S. Curtarolo, J. P. Maria and D. W. Brenner, J. Appl. Phys., 2016, 120(9), 095105 CrossRef.
- T. Csanadi, E. Castle, M. J. Reece and J. Dusza, Sci. Rep., 2019, 9(1), 10200 CrossRef PubMed.
- G. Tallarita, R. Licheri, S. Garroni, R. Orrù and G. Cao, Scr. Mater., 2019, 158, 100–104 CrossRef CAS.
- P. H. Mayrhofer, A. Kirnbauer, P. Ertelthaler and C. M. Koller, Scr. Mater., 2018, 149, 93–97 CrossRef CAS.
- Q.-W. Xing, S.-Q. Xia, X.-H. Yan and Y. Zhang, J. Mater. Res., 2018, 33(19), 3347–3354 CrossRef CAS.
- S. Zhai, J. Rojas, N. Ahlborg, K. Lim, M. F. Toney, H. Jin, W. C. Chueh and A. Majumdar, Energy Environ. Sci., 2018, 11(8), 2172–2178 RSC.
- M. P. Jimenez-Segura, T. Takayama, D. Bérardan, A. Hoser, M. Reehuis, H. Takagi and N. Dragoe, Appl. Phys. Lett., 2019, 114(12), 122401 CrossRef.
- R. Witte, A. Sarkar, R. Kruk, B. Eggert, R. A. Brand, H. Wende and H. Hahn, Phys. Rev. Mater., 2019, 3(3), 034406 CrossRef CAS.
- L. Hu, Y. Zhang, H. Wu, J. Li, Y. Li, M. McKenna, J. He, F. Liu, S. J. Pennycook and X. Zeng, Adv. Energy Mater., 2018, 8(29), 1802116 CrossRef.
- X. Yan, L. Constantin, Y. Lu, J.-F. Silvain, M. Nastasi and B. Cui, J. Am. Ceram. Soc., 2018, 101(10), 4486–4491 CrossRef CAS.
- M. M. Opeka, I. G. Talmy, E. J. Wuchina, J. A. Zaykoski and S. J. Causey, J. Eur. Ceram. Soc., 1999, 19(13), 2405–2414 CrossRef CAS.
- K. Chen, X. Pei, L. Tang, H. Cheng, Z. Li, C. Li, X. Zhang and L. An, J. Eur. Ceram. Soc., 2018, 38(11), 4161–4164 CrossRef CAS.
- P. G. Klemens, Proc. Phys. Soc., London, Sect. A, 1955, 68(12), 1113 CrossRef.
- J. Callaway and H. C. von Baeyer, Phys. Rev., 1960, 120(4), 1149 CrossRef CAS.
- B. Abeles, Phys. Rev., 1963, 131(5), 1906–1911 CrossRef.
- P. Chantrenne, in Microscale and Nanoscale Heat Transfer, 2007, vol. 107, pp. 155–180 Search PubMed.
- A. Giri, J. L. Braun and P. E. Hopkins, J. Appl. Phys., 2018, 123(1), 015106 CrossRef.
- A. Giri, J. L. Braun, C. M. Rost and P. E. Hopkins, Scr. Mater., 2017, 138, 134–138 CrossRef CAS.
- M. Lim, Z. Rak, J. L. Braun, C. M. Rost, G. N. Kotsonis, P. E. Hopkins, J. P. Maria and D. W. Brenner, J. Appl. Phys., 2019, 125(5), 055105 CrossRef.
- H. R. Seyf, L. Yates, T. L. Bougher, S. Graham, B. A. Cola, T. Detchprohm, M.-H. Ji, J. Kim, R. Dupuis, W. Lv and A. Henry, npj Comput. Mater., 2017, 3(1), 49 CrossRef.
- W. Li, J. Carrete, N. A. Katcho and N. Mingo, Comput. Phys. Commun., 2014, 185(6), 1747–1758 CrossRef CAS.
- M. Arrigoni, J. Carrete, N. Mingo and G. K. H. Madsen, Phys. Rev. B, 2018, 98(11), 115205 CrossRef CAS.
- L. Lindsay, C. Hua, X. L. Ruan and S. Lee, Materials Today Physics, 2018, 7, 106–120 CrossRef.
- F. DeAngelis, M. G. Muraleedharan, J. Moon, H. R. Seyf, A. J. Minnich, A. J. H. McGaughey and A. Henry, Nanoscale Microscale Thermophys. Eng., 2018, 23(2), 81–116 CrossRef.
- Z. Huang, S. A. Miller, B. Ge, M. Yan, S. Anand, T. Wu, P. Nan, Y. Zhu, W. Zhuang, G. J. Snyder, P. Jiang and X. Bao, Angew. Chem., Int. Ed., 2017, 56(45), 14113–14118 CrossRef CAS PubMed.
- S. Roychowdhury, T. Ghosh, R. Arora, U. V. Waghmare and K. Biswas, Angew. Chem., 2018, 130(46), 15387–15391 CrossRef.
- O. N. Senkov, J. M. Scott, S. V. Senkova, D. B. Miracle and C. F. Woodward, J. Alloys Compd., 2011, 509(20), 6043–6048 CrossRef CAS.
- N. De Leon, X.-x. Yu, H. Yu, C. R. Weinberger and G. B. Thompson, Phys. Rev. Lett., 2015, 114(16), 165502 CrossRef PubMed.
- S. Kiani, J.-M. Yang and S. Kodambaka, J. Am. Ceram. Soc., 2015, 98(8), 2313–2323 CrossRef CAS.
- F. R. Chien, X. J. Ning and A. H. Heuer, Acta Mater., 1996, 44(6), 2265–2283 CrossRef CAS.
- Y. Kumashiro, Y. Nagai, H. Katō, E. Sakuma, K. Watanabe and S. Misawa, J. Mater. Sci., 1981, 16(10), 2930–2933 CrossRef CAS.
- Y. Kumashiro, A. Itoh, T. Kinoshita and M. Sobajima, J. Mater. Sci., 1977, 12(3), 595–601 CrossRef CAS.
- D. J. Rowcliffe and G. E. Hollox, J. Mater. Sci., 1971, 6(10), 1261–1269 CrossRef CAS.
- D. W. Lee and J. S. Haggerty, J. Am. Ceram. Soc., 1969, 52(12), 641–647 CrossRef CAS.
- S. J. L. Billinge and I. Levin, Science, 2007, 316(5824), 561 CrossRef CAS PubMed.
- M. R. Mitchell, S. W. Reader, K. E. Johnston, C. J. Pickard, K. R. Whittle and S. E. Ashbrook, Phys. Chem. Chem. Phys., 2011, 13(2), 488–497 RSC.
- S. W. Reader, M. R. Mitchell, K. E. Johnston, C. J. Pickard, K. R. Whittle and S. E. Ashbrook, J. Phys. Chem. C, 2009, 113(43), 18874–18883 CrossRef CAS.
- S. E. Ashbrook and D. McKay, Chem. Commun., 2016, 52(45), 7186–7204 RSC.
- X. Lu and D. T. Morelli, Phys. Chem. Chem. Phys., 2013, 15(16), 5762–5766 RSC.
| This journal is © The Royal Society of Chemistry 2019 |

