 Open Access Article
Creative Commons Attribution 3.0 Unported Licence
TiO2 photoanodes with exposed {0 1 0} facets grown by aerosol-assisted chemical vapor deposition of a titanium oxo/alkoxy cluster†
Miriam
Regue
 ab,
Sandra
Sibby
b,
Ibbi Y.
Ahmet
 c,
Dennis
Friedrich
 c,
Fatwa F.
Abdi
 c,
Andrew L.
Johnson
 *ad and
Salvador
Eslava
 *ab
*ab
aCentre for Sustainable Chemical Technologies, University of Bath, Claverton Down, Bath, BA2 7AY, UK
bDepartment of Chemical Engineering, University of Bath, Claverton Down, Bath, BA2 7AY, UK. E-mail: s.eslava@bath.ac.uk
cHelmholtz-Zentrum Berlin für Materialien und Energie Gmbh, Institute for Solar Fuels, Hahn-Meitner-Platz 1, Berlin 14109, Germany
dDepartment of Chemistry, University of Bath, Claverton Down, Bath, BA2 7AY, UK. E-mail: a.l.johnson@bath.ac.uk
First published on 29th July 2019
Abstract
Photoelectrochemical water splitting is a promising technology for the development of solar fuels. Titanium dioxide (TiO2) is one of the most studied metal oxides in this field as a photoanode. Achieving its full potential requires controlling its morphology and crystallinity and especially the exposure of its most active crystal facets. Herein, we present the formation of nanostructured TiO2 photoanodes with anatase phase and high exposure of the {0 1 0} facet, the most active TiO2 phase and facet. TiO2 photoanodes were prepared from a Ti7O4(OEt)20 titanium oxo/alkoxy cluster solution using aerosol assisted chemical vapor deposition. Characterization techniques such as SEM and TEM reveal that these TiO2 photoanodes consist of morphologies resembling the crystals of gypsum, sand and water found in nature, also known as desert roses. Furthermore, TEM and XRD analysis also reveals that the metastable anatase TiO2 phase is maintained up to 1000 °C and exceeds the typical anatase-to-rutile phase-transition temperature of 500–750 °C, a feature that could be exploited in the smart ceramics industry. Photoelectrochemical measurements show that these desert-rose TiO2 photoanodes achieve excellent photocurrent densities with an incident photon-to-current efficiency of ∼100% at 350 nm and a faradaic efficiency for oxygen evolution of ∼90%.
Introduction
A key approach to reduce global warming is to change and decarbonize the current energy portfolio, highly based on fossil fuels, to a more sustainable one.1 The abundant solar energy reaching the Earth's surface (1.3 × 10⁵ TW year−1) provides a clean alternative and can be used to produce clean hydrogen from water via photoelectrochemical (PEC) water splitting. Among the different light harvesting materials used as photoanodes in PEC cells, TiO2 is the most studied material owing to its good properties such as chemical and thermal stability, low cost, electronic properties and long durability.2,3 Moreover, TiO2 also finds applications in the decomposition of organic pollutants, photovoltaics, self-cleaning coatings, electrochromic display devices, Li-ion batteries and biomedical devices.2,4 Nevertheless, it suffers from a few disadvantages, such as the large band-gap and fast recombination of electrons and holes, which can limit its practical application, especially in PEC devices.5 An approach to overcome some of these limitations is by designing nanostructured TiO2 crystals with most active facets exposed, since they can offer more available active surface area for the charge transfer process at the photocatalyst–electrolyte interface.6 Under equilibrium conditions, anatase TiO2 crystals typically grow with a majority of {1 0 1} facets exposed that have one of the lowest surface energy (0.44 J m−2) and poor PEC or photocatalytic activity.7 In this regard, there is a great scientific interest in growing anatase TiO2 crystals with high energy facets exposed, such as {0 1 0} and {0 0 1}, which are known to be the most active ones for photocatalytic or PEC applications, especially the {0 1 0} facet.8–11Nowadays, the hydrothermal method is the most employed method for the fabrication of nanostructured TiO2 photoanodes and a wide range of different morphologies have been achieved so far, such as nanotubes,12 nanorods,13 nanowires,14 nanobelts15 and even flower-like nanostructures.16 Chemical vapor deposition (CVD) is an alternative method for the preparation of nanostructured TiO2 films. This method allows the fabrication of robust films with a relatively low processing cost, facilitating the scaling up.17 Different variants of CVD have been used for TiO2 growth, such as aerosol-assisted CVD or metal–organic CVD (MOCVD). For instance, Gardecka et al. successfully synthesized nanostructured and dendritic TiO2 photoanodes using MOCVD and titanium tetraisopropoxide as the precursor.18 Other morphologies such as cauliflower-like structures, needle-like structures and compact domes with pyramidal features (doped with W) have also been successfully grown by AACVD using titanium isopropoxide and titanium ethoxide as TiO2 precursors.19–23
In this publication, we present the first formation of nanostructured anatase TiO2 having the appearance of crystals of gypsum, sand and water, typically known as “desert roses”, with a high exposure of one of the most photocatalytically-active TiO2 {0 1 0} facet. A similar morphology had only been produced before with rutile TiO2 phase using a hydrothermal method and MoO3 to stabilize {0 0 1} surfaces,24 but never with anatase TiO2 that is the most photocatalytically-active phase. The “desert rose”-like anatase TiO2 is grown by AACVD on different substrates using a sophisticated but inexpensive precursor – a titanium oxo/alkoxy cluster, also called cage, with formula Ti7O4(OEt)20. Upon deposition, the films are covered in carbon residue, but posterior calcination in air reveals the TiO2 {0 1 0} facet is predominant on the surface of the rose petals. When deposited on a conductive transparent support and tested in PEC cells for water oxidation, the resulting desert-rose TiO2 photoanodes exhibit high photocurrents and stability and 100% incident-to-photon efficiency (IPCE) performance at 350 nm. Therefore, the results herein presented reveal new strategies for the design and fabrication of nanostructured TiO2 photoanodes using the AACVD technology and metal oxo/alkoxy clusters.
Experimental
Materials
Titanium(IV) ethoxide Ti(OEt)4, anhydrous toluene (≥99.9%) and ethanol (<0.0003% water) were provided by Sigma Aldrich. Aluminoborosilicate glass (ABS) coated with a fluorine-doped tin oxide (FTO) transparent conductive layer (8 Ω sq−1) was provided by Solaronix SA, Switzerland. These FTO–ABS substrates withstand 800 °C heating in air, with no deterioration of the FTO conductivity.25 They were cleaned by ultrasonication in a 2% aqueous Hellmanex III solution, deionized water, acetone and isopropyl alcohol (each step for 3 min), followed by rinsing in deionized water and compressed-air drying and an oxygen plasma treatment for 20 min to enhance surface energy. Alumina substrates (100 mm × 100 mm × 1 mm) for high-temperature studies were provided by Almath and quartz substrates (25 mm × 12 mm) for time-resolved microwave conductivity measurements were provided by H. Baumbach & Co. Ltd.Synthesis of Ti7O4(OEt)20
Ti7O4(OEt)20 titanium oxo/ethoxy cluster was synthesized by a controlled hydrolysis in toluene as Eslava et al. previously described.26 Briefly, 0.34 mL of deionized water and 5.0 mL of anhydrous ethanol were added dropwise to a solution containing 7.0 mL of Ti(OEt)4 in anhydrous toluene (15 mL) under argon atmosphere. After overnight stirring, evaporation of the solvent resulted in the formation of a white/yellowish crystalline solid precipitate of Ti7O4(OEt)20.Preparation of TiO2-Rose and TiO2 photoanodes
Photoanodes were prepared using AACVD. The aerosol droplets were generated using a TSI Model 3076 Constant Output Atomiser, a 0.05 M solution of Ti7O4(OEt)20 in toluene, and nitrogen as a carrier gas at a constant flow rate of 1.5 L min−1. Depositions were carried out onto FTO–ABS, quartz or alumina substrates placed horizontally inside a tube furnace. Deposition times of 0.5, 1, 1.5 and 2 h at 500 °C and deposition temperatures of 400, 500, 600 and 700 °C for 1 h were performed to assess the growth mechanism and optimization. The optimal deposition conditions for PEC performance were found to be 500 °C and 1 h. At the end of the deposition, the substrate was left to cool down under nitrogen flow. The obtained films were further annealed in air at a heating rate of 10 °C min−1 up to 800 °C, kept at this temperature for 2 h, and then left to cool down in air. The obtained photoanodes at 500 °C with 1 h deposition conditions were denoted as TiO2-Rose-AD (as-deposited) and TiO2-Rose-800 (annealed). For comparison, TiO2 photoanodes were prepared following the same methodology but using 0.05 M Ti(OEt)4 (same precursor molar concentration) and 0.35 M Ti(OEt)4 (same Ti molar concentration) toluene solutions instead. The resultant photoanodes were accordingly denoted as TiO2-0.05M-AD, TiO2-0.35M-AD, TiO2-0.05M-800 and TiO2-0.35M-800.Characterization
Unit cell calculations were performed at 150 K in a RIGAKU SuperNova manufactured by Agilent Technologies. Field-emission scanning electron microscopy micrographs (FE-SEM) were acquired using a JEOL FESEM6301F instrument. X-ray photoelectron spectroscopy (XPS) was performed using a Thermo Fisher Scientific K-alpha+ spectrometer using a micro-focused monochromatic Al X-ray source (72 W). C 1s peak was used for internal charge correction. X-ray diffraction (XRD) patterns were collected from 10 to 80° (2θ) Bragg–Brentano with a Bruker AXS D8 Advance using Cu Kα (0.154 nm) radiation, 0.023° (2θ) steps and a total integration time of 960 s. The rutile TiO2 fraction in the films was calculated using the following equation:27 | (1) |
PEC measurements
PEC performance of photoanodes was evaluated using a CompactStat. potentiostat (Ivium Technologies). Photocurrents were measured under simulated sunlight (AM 1.5G, 100 mW cm−2) from a filtered 300 W xenon lamp source (Lot Quantum Design) or under UV illumination (365 nm, 3.6 mW cm−2) from a ModuLight IM3412 LED light (Ivium Technologies). PEC cells were prepared with a three-electrode configuration with Pt as the counter electrode, a silver chloride (Ag/AgCl/3.5 M KCl) reference electrode and as-prepared photoanodes as the working electrode. 1 M aqueous KOH (pH = 13.7) was used as the electrolyte solution. Illumination was directed towards the back of the FTO–ABS working electrode and a mask was placed on top of the photoelectrode to define the illuminated area. Photocurrent–time curves were measured at an applied bias of 1.23 V vs. the reversible hydrogen electrode (VRHE). Photocurrent–potential curves were recorded at a scan rate of 20 mV s−1. The measured Ag/AgCl potentials (EAg/AgCl) were converted to RHE potentials and vice versa using the Nernst equation.
PEC impedance spectroscopy (PEIS) was carried out under simulated sunlight (AM 1.5G, 100 mW cm−2) at the light open circuit potential (OCP) of the cell, at a frequency range of 105–0.1 Hz with an amplitude of 10 mV. EIS measurements at different potentials were also performed under dark conditions to obtain Mott–Schottky plots. These measurements were carried out at a fixed frequency of 500 and 1000 Hz, based on the following equation:34
 | (2) |
 | (3) |
Results and discussion
Structural characterization
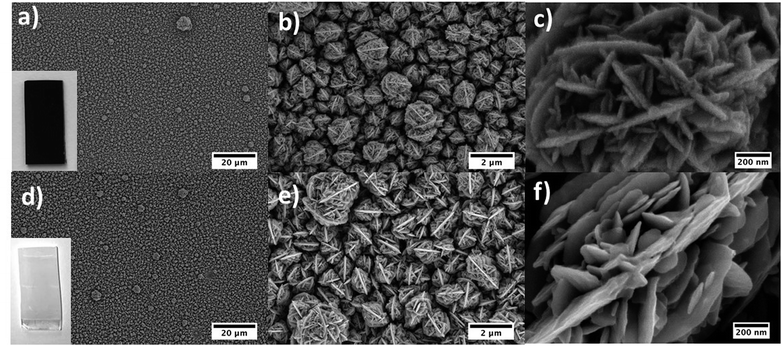
Titanium oxo/ethoxy cluster Ti7O4(OEt)20 (Fig. 1) was firstly reported in 1967 by K. Watenpaugh and C. N. Caughlan as one of the first hydrolysis products of Ti(OEt)4 in dry ethanol bubbled with partially-dried air.38 In this work, we successfully prepared it in gram scale following a controlled hydrolysis of Ti(OEt)4 with distilled water in anhydrous toluene. Unit cell calculations confirmed the successful synthesis of Ti7O4(OEt)20 with the unit cell parameters [a 13.806(8), b 20.223(12) and c 12.155(5)] Å matching the ones firstly reported by R. Schmid et al. (CDCC 169789).39 Its deposition by AACVD on FTO–ABS substrates resulted in black films due to carbon residues from the ethoxide groups and toluene solvent employed during the deposition (TiO2-Rose-AD, Fig. 2a inset). Annealing in air at 800 °C removed this carbon and films turned white (TiO2-Rose-800, Fig. 2d inset).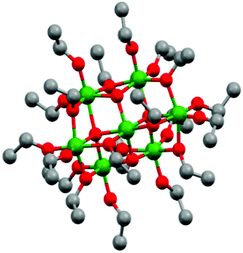 | ||
| Fig. 1 Ball and stick model of Ti7O4(OEt)20 represented from CDCC 169789.39 Ti: green, O: red and C: grey. Hydrogen atoms are omitted for clarity. | ||
Fig. 2a–f shows SEM micrographs of TiO2-Rose-AD and TiO2-Rose-800. Both exhibit almost the same morphology, with a structure resembling the crystals of gypsum, sand and water, typically known as “desert roses”. Such roses have a size of 1–1.5 μm and consist of many plate-like sheets resembling rose petals. They offer a good and homogeneous coverage of the FTO support. There are no significant structural changes between TiO2-Rose-AD (Fig. 2a–c) and TiO2-Rose-800 (Fig. 2d–f) at low magnifications. However, at highest magnification, TiO2-Rose-AD shows some surface roughness on the petals assigned to the carbon residues.
The deposition time during AACVD process was studied. Fig. 3 shows SEM cross-sectional micrographs of desert rose TiO2 photoanodes obtained at four different deposition times and all annealed at 800 °C. The thickness of the films increased from 0.77 (σ = 0.05) μm for 0.5 h to 2.6 (σ = 0.20), 2.8 (σ = 0.07), and 2.5 (σ = 0.26) μm for 1, 1.5 and 2 h, respectively (σ stands for std deviation). Desert-rose flowers grow perpendicular to the FTO substrate with plate-like petals emerging from the stem of the flower and achieving a good coverage of the support. Interestingly, after 1 h of deposition, the thickness of the films remains practically constant between 2.6 and 2.8 μm, although some random flowers grow as a second layer (see some roses in the background of the micrographs in Fig. 3c and d). This growth is confirmed by top-view SEM micrographs of the same photoanodes (Fig. S1†). A homogeneous first layer of similar-size roses is achieved at 0.5 and 1 h deposition time, but excessive time leads to some secondary larger flowers above the first layer. A deposition of 1 h was found to be optimal. The deposition temperature was also studied at 400, 600 and 700 °C for 1 h. Films did not grow at 400 °C but the higher deposition temperatures were successful (Fig. S2† SEM micrographs). Finer nanostructures were observed at higher temperatures, which are typical when precursor decomposition and/or chemical reactions mostly occur in the vapor phase, followed by surface adsorption and heterogeneous reactions.40 No plate-like “petal” morphologies were obtained at different temperatures, so 500 °C was confirmed to be optimal, together with 1 h deposition time. Following work was carried out using films deposited at these conditions. This optimization based on morphology was further confirmed by PEC measurements (results not shown).
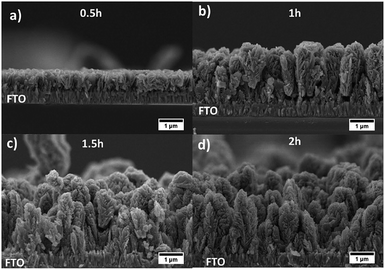 | ||
| Fig. 3 SEM cross-sectional micrographs of TiO2-Rose-800 photoanodes deposited for (a) 0.5, (b) 1, (c) 1.5 and (d) 2 h. | ||
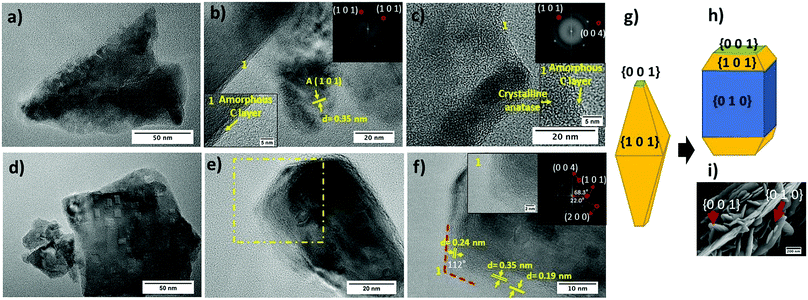
HR-TEM micrographs of both TiO2-Rose-AD and TiO2-Rose-800 film fragments are shown in Fig. 4. First, it is noteworthy to highlight the presence of a thin amorphous carbon layer at the crystallite interface of TiO2 particles for TiO2-Rose-AD (Fig. 4a–c). After annealing in air, TiO2-Rose-800 shows no distinguished amorphous carbon layer (Fig. 4d–f). TiO2-Rose-800 consists of well-defined faceted morphologies (Fig. 4d and e). Indexing of diffraction spots (Fig. 4f) from fast Fourier transformed (FFT) diffraction patterns correspond to (1 0 1), (0 0 4), and (2 0 0) (see insets in Fig. 4f) of anatase TiO2, suggesting exposure of {1 0 1}, {0 0 1} and {1 0 0}/{0 1 0} facets. The angles of 68.3, 22 and 90° highlighted in the Fig. 4f inset are consistent with the theoretical angles between {1 0 1} and {0 0 1}, {2 0 0} and {1 0 1}, and {1 0 0} and {0 0 1} of the anatase crystal, respectively. An equilibrium shape of anatase crystals according to the Wulff construction and the evolved shape with high exposure of {0 1 0} are shown in Fig. 4g and h, respectively.41,42Fig. 4f also shows a 112° angle assigned to the angle between {1 0 1} and {0 0 1} facets, revealing that the edges of the crystals consist of {0 0 1} and {1 0 1} facets, whereas their central part consist of {0 1 0} facets. Generally, anatase particles preferentially expose {1 0 1} facets as in Fig. 4g, but TiO2-Rose films bear a preferential exposure of TiO2 {0 1 0} facets (Fig. 4h). This assignment of facets is shown on a SEM micrograph in Fig. 4i.
The composition and chemical state of film surfaces were evaluated using XPS analysis (Table S1†). TiO2-Rose-AD possess a large amount of carbon on the surface, 55.7 at%, that agrees well with the black color appearance, HR-TEM micrographs and attributed deposited carbon. Conversely, TiO2-Rose-800 just shows 18.1 at% C, assigned to volatile organic compounds deposited during storage of samples. TGA in air on TiO2-Rose-AD sample (Fig. S3†) showed one single predominant step at ∼400 °C, indicating the temperature at which carbon deposits burn off in air.
Ti 2p high resolution XPS spectra are shown in Fig. 5a and corresponding binding energies listed in Table S2.† In both TiO2-Rose-AD and TiO2-Rose-800, the two characteristic peaks of Ti+4 in anatase TiO2 attributed to Ti 2p1/2 and Ti 2p3/2 are observed.43 Interestingly, a shift towards higher binding energies is observed for TiO2-Rose-AD, indicating the possibility of Ti–O–C bonds in the film.44 O 1s high resolution XPS spectra are shown in Fig. 5b and corresponding binding energies listed in Table S3.† Three peaks at different binding energies are observed. The main peak at lower binding energies corresponds to crystal lattice O–Ti4+ in the TiO2 lattice structure, whereas the smaller peaks at slightly higher energies are attributed to hydroxyl groups or adsorbed water on the surface.45 As observed for Ti 2p, a shift towards higher binding energies is observed for TiO2-Rose-AD, suggesting that crystal lattice oxygen is also attached to a non-anatase element, supporting the hypothesis of Ti–O–C bonds in the as-deposited samples.44 Finally, C 1s XPS spectra are shown in Fig. 5c. The main peak at 284.8 eV corresponds to C–C bonds whereas the smaller peaks at higher binding energies are assigned to different carbon environments, such as C–OH and C–O–C.46,47 Interestingly, no additional peaks at ∼281.5 eV corresponding to Ti–C are observed for TiO2-Rose-AD. Therefore, only C–O–Ti bonds are confirmed on TiO2-Rose-AD films.44,48 The smaller peaks at ∼293 and ∼295 eV mainly observed in TiO2-Rose-800 correspond to K 2p3/2 and K 2p1/2, respectively, impurities from the KOH electrolyte used during PEC measurements.49
 | ||
| Fig. 5 XPS spectra of (a) Ti 2p, (b) O 1s and (c) C 1s of TiO2-Rose-800 and TiO2-Rose-AD. Scattered points correspond to raw data acquired in the measurements and solid lines to the fitted values. | ||
Fig. 6a shows the XRD patterns of both TiO2-Rose-800 and TiO2-Rose-AD films on FTO–ABS substrates. All XRD patterns only show the characteristic peaks of tetragonal anatase TiO2 phase. In particular, the diffraction peaks at 25.2, 48.0, 55.1, 62.8, 75.0 and 76.0° (2θ) correspond to (1 0 1), (2 0 0), (2 1 1), (2 0 4), (2 1 5) and (3 0 1) diffraction planes (ICDD-JCPDS 75-1537). These diffraction planes agree with the ones observed in HRTEM micrographs. TC of (1 0 1) and (2 0 0) of TiO2-Rose samples are listed in Table 1. The TC101 is ∼0.55 whereas TC200 is ∼1.45 for both TiO2-Rose samples which indicates preferential growth orientation along (2 0 0) diffraction plane. This suggests dominant crystal growth along [0 1 0] direction and exposure of {0 1 0} facets.11,50,51 The crystal structure of anatase TiO2 highlighting the crystal planes is shown in Fig. S4.† The preferred orientation of TiO2-Rose agrees well with SEM (Fig. 2) and HRTEM (Fig. 4) micrographs where plate-like sheets and rectangular shape particles are observed, respectively. The diffraction planes together with the morphological analysis carried out in HRTEM micrographs confirm that the TiO2-Rose films are mainly exposed of {0 1 0} anatase TiO2 facets with some regions of {1 0 1} and {0 0 1} facets.11,41,52,53
| Sample | TC101 | TC200 |
|---|---|---|
| TiO2-Rose-800 | 0.51 | 1.49 |
| TiO2-Rose-AD | 0.61 | 1.39 |
None of the diffraction planes shown in Fig. 6a are indexed to rutile TiO2 phase despite annealing at 800 °C, above the typical anatase-to-rutile phase-transformation temperature, which is 600 °C for powders and expected to be slightly higher for substrate-constrained films (ca. 750 °C).54,55 To further investigate the maximum temperature at which the metastable but more photocatalytically active anatase phase is preserved, the Ti7O4(OEt)20 precursor was deposited by AACVD on top of alumina substrate at 500 °C and further annealed in air for 2 h at 900–1200 °C. The use of a different support did not affect the final morphology of TiO2 (Fig. S5†). The XRD patterns are shown in Fig. S6† and the percentage of each phase vs. temperature in Fig. 6b. TiO2-Rose shows presence of pure anatase TiO2 up to 900 °C and a gradual transformation to rutile phase for temperatures of 1000 °C and above (Fig. 6b). A high anatase percentage (22%) is obtained in the film at 1000 °C air annealing. These results reveal that these films achieved using AACVD would offer advantages when used as functional coatings on smart tiles with antibacterial and self-cleaning properties. The ceramics of tiles require temperatures above 900 °C for their preparation, which limits their coating to rutile phase which is less photocatalytically active than anatase.56
High-temperature-stable anatase TiO2 is typically achieved by doping TiO2 with metal and non-metal ions co-doping (combining both metal and non-metal ions) and by enriching with oxygen, which strengthens Ti–O–Ti bonds and thus delays the transformation to rutile phase.56 Recently, high-temperature anatase TiO2 photoanodes have also been synthesized by anodization of titanium foils followed by a solvothermal treatment, keeping stable anatase phase up to 900 °C.57 The authors attributed the anatase high temperature stability to a phonon confinement effect, typically observed in anatase TiO2 with small crystallite sizes (∼30 nm).58,59 Since neither doping treatment nor oxygen enrichment modifications were undertaken to our TiO2 samples, coherent crystal domain size calculations and Raman analysis were carried out to further investigate the possibility of this phonon confinement effect on our films.57,59
Table 2 shows the calculated anatase coherent crystal domain size of TiO2-Rose photoanodes annealed in air at different temperatures (patterns in Fig. S7†). The largest domain size is found in the as-deposited sample, 46.6 nm, most likely due to the presence of interstitial carbon in the anatase TiO2 lattice structure. Substitutional doping of C+4 with Ti+4 can be discarded owing to the large difference between their ionic radius, being 16 and 61 pm for C+4 and Ti+4, respectively.60 At annealing temperatures ranging from 600 to 800 °C, the domain size is significantly smaller, from 28 to 36 nm, and in the range where phonon confinement can occur.58,59 We attribute this reduction in size to the removal of interstitial carbon present in as-deposited samples. Moreover, the presence of amorphous carbon in the anatase TiO2 grain boundaries must also have limited the TiO2 domain sizes.60,61 Amorphous carbon in the interface of TiO2 crystals was confirmed in HRTEM micrographs of TiO2-Rose-AD (inset of Fig. 4e and f) and by XPS analysis, where Ti–O–C bonds were observed. Above 900 °C, grain boundary restrictions disappear and anatase TiO2 domain sizes grow up to ∼50 nm owing to sintering of crystals.62,63 This crystal domain growth is accompanied by a transformation from anatase to rutile (Fig. 6b).
Raman spectroscopy was carried out to further confirm the possibility of phonon confinement. As previously reported in literature a shift of the Eg Raman mode at 144 cm−1 of anatase TiO2 towards lower wavenumber supports the phonon confinement model of high-temperature anatase TiO2.57,59 Fig. S8† shows the Raman spectra of TiO2-Rose annealed at different temperatures (600 to 900 °C) confirming the shift towards lower wavenumber values when annealing temperature is increased. This Raman shift along with the calculated anatase coherent crystal domain size around 30 nm supports that high-temperature anatase TiO2 may be achieved through phonon confinement effects, in addition to substrate constraint effects.
Fig. S9† shows the Raman spectra of TiO2-Rose films. In all cases, only Raman bands ascribed to tetragonal anatase TiO2 are observed, in agreement with XRD patterns. Particularly, the sharp bands at ca. 144, 198, 400, 520 and 640 cm−1 correspond to Eg, Eg, B1g, B1g and Eg Raman vibration modes of anatase TiO2, respectively.64 Two additional bands at ca. 1340 and 1590 cm−1 appear for TiO2-Rose-AD only, assigned to D and G bands of graphitic carbon structures (Fig. S9b†).65 These results agree well with XPS and HRTEM, where Ti–O–C bonds and amorphous carbon layers were observed for TiO2-Rose-AD.
UV-Vis spectroscopy measurements for TiO2-Rose-800 and TiO2-Rose-AD are shown in Fig. S10.† As expected, a clear absorption edge at ∼400 nm is observed for TiO2-Rose-800, whereas lower transflectance values at higher wavelengths with no clear absorption edge is observed for TiO2-Rose-AD owing to carbon coverage.
Photoelectrochemical characterization
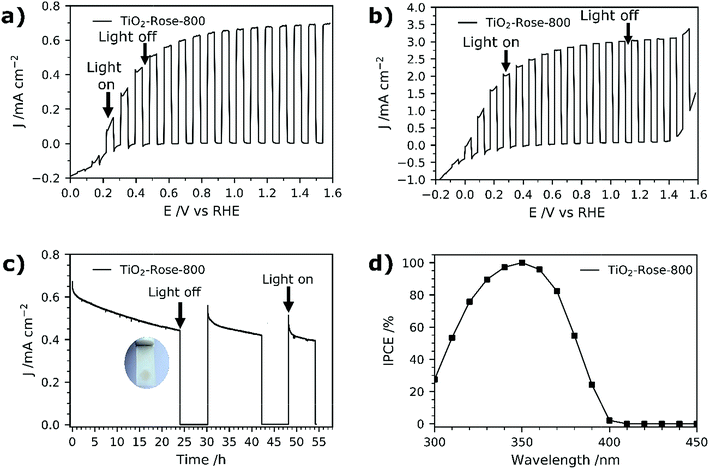
PEC performance of TiO2-Rose films on FTO–ABS substrates was evaluated. No PEC activity was observed for TiO2-Rose-AD when irradiated (Fig. S11†), which we ascribe to the carbon residues coverage and consequent light shielding. However, TiO2-Rose-800 shows high PEC response a photocurrent plateau of ∼0.67 mA cm−2 with simulated sunlight (Fig. 7a) and 3.0 mA cm−2 with UV light (365 nm, 3.6 mW cm−2, Fig. 7b). Photostability measurements for 2 days including some recovery periods in the dark are shown in Fig. 7c. After 24 h of continuous light irradiation, 70% of the total photocurrent is still maintained and a 6 h period in the dark recovers 15% of original photocurrent. The photocurrent decrease is assigned to photocorrosion with photogenerated electrons and holes trapped in the structure.66 Actually, during the irradiation time the TiO2 changed color from white to brownish, attributed to the reduction of Ti4+ to Ti3+ by trapped photogenerated electrons (Fig. 7c inset).66 During the recovery period in the dark, the TiO2 becomes white again, due to the back oxidation to Ti4+ with atmospheric oxygen, recovering some PEC activity.IPCE values for TiO2-Rose-800 start to increase from 400 nm and reach a remarkable 100% at 350 nm (Fig. 7d). Below 350 nm wavelengths IPCE values decrease due to FTO–ABS substrate light absorption, as confirmed by transmittance measurements on FTO–ABS substrates (Fig. S12†). The use of front-illumination avoids such decrease at wavelengths below 350 nm, but maximum IPCE values are then 67% due to a longer electron path where more electron–hole recombination can occur (Fig. S13†).67,68
Integrating the product of the IPCE curve (Fig. 7d) and the photon intensity in the AM 1.5G solar spectrum results in a photocurrent density value of 0.9 mA cm−2 at 1.23 VRHE, which is slightly higher than the 0.67 mA cm−2 obtained in J–V and J–time curves at 1.23 VRHE (Fig. 7a and d). This variation is attributed to a spectral mismatch between the simulated sunlight (filtered Xe source) used in the J–V and J–time measurements and the real AM 1.5G solar spectrum used in the IPCE integration.69 These high IPCE and integrated photocurrent values further confirm the excellent performance of these rose-like shaped photoanodes prepared using Ti7O4(OEt)20 oxo clusters.
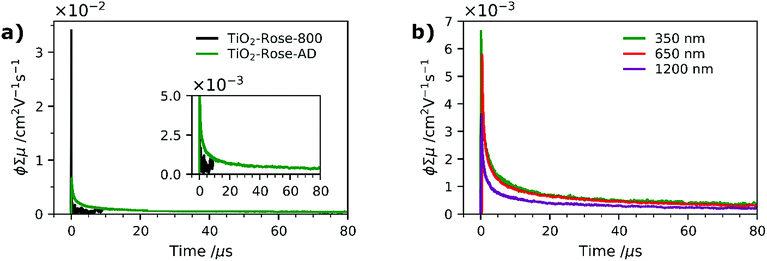
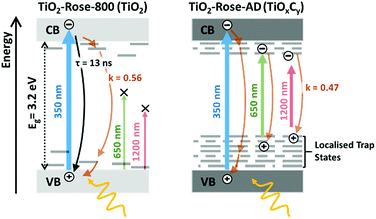
To further understand why the as-deposited dark TiO2 samples (TiO2-Rose-AD) show no PEC activity, as compared to those post annealed at 800 °C in air (TiO2-Rose-800), we investigated the charge carrier dynamics (i.e., mobility and lifetime) of these samples deposited onto quartz substrates, by TRMC. This technique probes the generation and decay of mobile charges upon pulsed irradiation at various wavelengths (350, 650 and 1200 nm). Fig. 8a shows the microwave conductance transients of TiO2-Rose-800 and TiO2-Rose-AD after a 3 ns laser pulse of 350 nm with a photon flux of 3.97 × 10¹³ photons pulse−1 cm−2, in which we are probing the charge dynamics for excitation energies above the band gap of anatase TiO2 (3.2 eV). It has been previously reported that the TRMC signal from TiO2 is predominately a measure of electron mobility and lifetime, since holes are rapidly trapped.30,70 A strong initial TRMC signal (φΣμ) for TiO2-Rose-800 (3.40 × 10⁻² cm2 V−1 s−1) indicates higher electron mobilities compared to the moderate signal of TiO2-Rose-AD (6.64 × 10⁻³ cm2 V−1 s−1) at equivalent photon flux. Interestingly, the TRMC signal decays for the two samples are different. As shown in Fig. S14a,† the TRMC signal for the TiO2-Rose-800 sample can be fitted with a combination of an exponential decay (<100 ns) with a time constant τ of 13 ns and a power law decay (>100 ns) with a decay exponent of ∼0.5. The exponential decay is assigned to band-to-band recombination pathways, while the power law decay can be attributed to trap-limited bimolecular recombination mechanism.71–74 In contrast, the TRMC signal for the TiO2-Rose-AD sample can be fitted with only a power law decay with a decay exponent of ∼0.5 (Fig. S14b†); only trap-limited bimolecular recombination occurs in this sample. This behavior is consistent with the relatively constant mobility and similar decay kinetics at various light intensities (Fig. S15†).
TRMC measurements were also performed at longer wavelengths of 650 and 1250 nm. Since these wavelength energies are lower than the bandgap of TiO2, these measurements effectively probe the photogenerated charges that can reside within the bandgap. Expectedly, no TRMC signal for TiO2-Rose-800 sample was observed at these excitation wavelengths. However, a clear TRMC transient signal for TiO2-Rose-AD (see Fig. 8b) was observed for both 650 and 1200 nm excitation wavelengths. The mobility slightly decreases with increasing wavelength (5.78 × 10⁻³ and 3.61 × 10⁻³ cm2 V−1 s−1 for the 650 and 1200 nm excitation, respectively), but the decay still follow the same power law mechanism (see Fig. S16†). We attribute this to the carbon impurities embedded in the un-annealed samples that introduce localized electron trapping states, delaying the electron and hole recombination, but also minimalizing charge mobility.75 These localized states sit at energetic positions deep within the band gap of anatase TiO2. Therefore, photogenerated charge carriers in the carbon doped TiOxCy (TiO2-Rose-AD) samples will not sit below the water oxidation potential, nor have a high enough photovoltage to achieve photoactivity for water splitting. This explains the absence of photocurrent from this sample (Fig. S11†).
Fig. 9 shows a schematic representation of the processes occurring in the two different samples. The main difference between the two is in the absence of band-to-band recombination for the TiO2-Rose-AD sample. This suggests that carriers, even after excitation beyond the bandgap, rapidly decay into the trap states, which later do not contribute to any photocurrent. Our observations are in agreement with surface photovoltage (SPV) measurements of carbon-doped titania which elucidated deep-isolated and catalytically-poor trap states.76,77
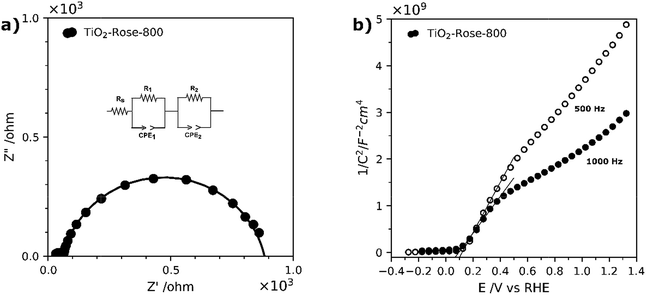
EIS measurements under simulated sunlight were carried out to understand charge transfer processes in the photoanodes. Fig. 10a shows Nyquist plots along with the equivalent circuit used, which include a R1/CPE1 pair which describes the semiconductor resistance and capacitance at the depletion layer and a second R2/CPE2 pair for the resistance and capacitance of the semiconductor at the interface between the electrolyte and photoanode (Helmholtz layer).78 Based on the obtained fitted results, TiO2-Rose-800 photoanode has resistance values of 35.6 Ω for R1 and 821 Ω for R2. The small resistance values suggest a better separation efficiency and faster transfer rate for photogenerated electrons and holes at the electrode/electrolyte interface.78,79 This good charge-transfer properties agree well with J–V curves, where high photocurrent performances are obtained for TiO2-Rose-800.
EIS measurements in the dark were carried out to characterize the intrinsic properties of the photoanodes, such as carrier densities (ND) and flat-band potentials. The EIS data were acquired in the form of Mott–Schottky plots at 500 and 1000 Hz, as shown in Fig. 10b. Plots indicate that the sample possess a positive slope, typical of n-type semiconductors.34 The flat-band potentials, obtained from the X-axis intercept of the Mott–Schottky plots, shows a very small variation of 0.02 V between the two frequencies, which indicates a very low frequency dispersion and true measured value for the flat-band potential.80 A flat-band potential of 0.12 VRHE and an electron carrier density of 6.43 × 1018 cm−3 were calculated at 500 Hz. Similar flat-band potential values have been previously reported in literature for nanostructured TiO2 photoanodes.34
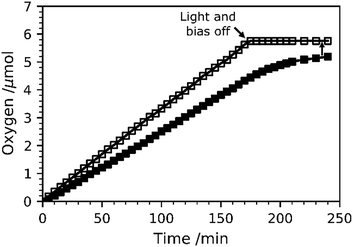
O2 evolution measurements at 1.23 VRHE were carried out for TiO2-Rose-800 and results are shown in Fig. 11. Fig. S17† shows the intensity–time curve obtained during the measurements. The amount of O2 gas evolved was accumulated inside the cell, and thus O2 content increased over time. The calculated faradaic efficiency for TiO2-Rose-800 photoanodes is ∼90% at the end of the oxygen measurement, providing further evidence that these photoanodes have high activity for oxygen evolution.
Precursor dependence
TiO2 photoanodes using Ti(OEt)4 as a starting precursor at two different concentrations have also been prepared for comparison. Fig. S18† shows SEM micrographs of both TiO2 photoanodes. Randomly distributed particles of irregular shape are observed for the 0.35 M deposition (TiO2-0.35M-800) while plate-like particles are observed for the 0.05 M deposition (TiO2-0.05M-800). As expected, thicker films were obtained when using a 0.35 M solution of Ti(OEt)4. Importantly, the desert-rose morphology is not achieved in any, which indicates that the desert rose morphology is unique to the use of Ti7O4(OEt)20 precursor. Their optical properties were compared. Fig. S19† shows the Kubelka–Munk function F(R) of diffuse reflectance UV-Vis spectra, related to the absorption coefficient (α).35 TiO2-Rose-800 shows the highest absorption coefficient at 350 nm, followed by TiO2-0.35M-800 and TiO2-0.05M-800. Therefore, the spectra indicate that the desert rose like films absorb the most light, ascribed to their higher film density and thickness. Their XRD patterns are shown in Fig. S20† showing anatase phase in all the cases. Importantly, the preferred orientation observed for TiO2-Rose-800 towards the (2 0 0) diffraction plane is no longer observed for TiO2-0.05M-800 and TiO2-0.35M-800 films, indicating again that the desert rose morphology with {0 1 0} facets exposed parallel to the FTO–ABS substrate is unique to the use of Ti7O4(OEt)20 clusters. Finally, PEC and IPCE performances are shown in Fig. S21–S22.† TiO2-Rose-800 exhibits the highest PEC performance at all applied voltages, but specially at low voltages, indicating a better potential onset which we assign to its unique morphology. Furthermore, TiO2-Rose-800 also has the highest IPCE performance at 1.23 VRHE (Fig. S21b†).The significant PEC performance of TiO2-Rose-800, which reaches 100% IPCE, is mainly attributed to the desert-rose morphology and exposure of {0 1 0} facets at multiple layers. Comparison to TiO2-0.05M-800 and TiO2-0.35M-800, which lacks {0 1 0} exposure supports this assignment as well as related literature on the activity of different TiO2 facets.8 As revealed by Pan et al., anatase crystals with larger exposure of {0 1 0} facets possess the highest photocatalytic activity owing to the combination of 100% coordinated Ti5c atoms on the surface and a more favorable CB position.8 The combination of these two factors allows all photogenerated electrons be efficiently transferred via surface Ti5c atoms, reducing the probability of electron–hole recombination and thus improving the PEC performance.8 Moreover, as revealed in the cross-sectional SEM micrographs of TiO2-Rose-800, each rose grows perpendicularly to the FTO–ABS substrate, leaving a small gap between each flower for the electrolyte to permeate while exposing multiple layers of TiO2 {0 1 0} facets per substrate area. This desert-rose characteristic morphology, with multiple plate-like sheets growing from the stem of the flower, also contribute to a superior light scattering and absorption in comparison to more irregular morphologies such as the ones found for TiO2-0.05M-800 and TiO2-0.35M-800 samples.4
It is believed that the formation of this specific desert-rose morphology arises from the different chemical structure of Ti7O4(OEt)20 in comparison to Ti(OEt)4 when used as AACVD precursor. For instance, Ti7O4(OEt)20 precursor has a condensation degree of 0.57 (O/Ti = 4/7) unlike 0 (nul) in Ti(OEt)4. It consists of seven TiO6 octahedra units that form a titanium oxo core which is surrounded by a large number of ethoxide groups, whereas the Ti(OEt)4 lacks such titanium oxo core.39 Such a different chemical structure might result in a completely different decomposition path during the AACVD deposition. To confirm the different decomposition, we carried out TGA analysis of Ti7O4(OEt)20. Fig. S23a† shows that the thermal decomposition of Ti7O4(OEt)20 occurs in three main steps at 224, 277 and 331 °C giving rise to a mass of 27.4% for the decomposition residue (TiO2). The biggest weight loss (51.1%) from ca. 100 to 225 °C corresponds mainly to decomposition of alkoxy ligands and formation of fragments containing titanium oxide species.81 In contrast, the TGA pattern of Ti(OEt)4 shows that decomposition occurs in one single step at ∼160 °C (Fig. S23b†).
Conclusions
We have demonstrated the growth of nanostructured TiO2 films having a morphology like the crystals of gypsum, sand and water found in nature, known as desert roses. This morphology was successfully grown by AACVD of Ti7O4(OEt)20 with N2 as a carrier. The desert-rose TiO2 consists of plate-like particles with preferential exposure of {0 1 0} anatase TiO2 facets, further confirmed by analyzing lattice fringes on the surface. Roses grow perpendicular to substrates such as FTO or alumina, offering an excellent substrate coverage with multiple layers of plate-like TiO2 per substrate area. In addition, desert-rose TiO2 show a high preservation of the metastable anatase phase despite annealing in air at very high temperatures, even 1000 °C. Rutile phase only appears above 900 °C, unlike typical 600 °C threshold. Such feature could be exploited in smart tiles with antibacterial and self-cleaning properties, whose ceramics require high temperature preparation. When desert-rose TiO2 films are deposited on FTO–ABS substrates and annealed in air, they offer excellent photoelectrochemical performance as photoanodes for oxygen evolution in aqueous electrolytes. Photocurrent plateaus of ∼0.67 mA cm−2 under simulated sunlight (100 mW cm−2) or 3.0 mA cm−2 under 365 nm UV light (3.6 mW cm−2) are achieved as well as an IPCE of ∼100% at 350 nm. Such remarkable performance is attributed to an excellent morphology, preferential exposure of {0 1 0} TiO2 facets and, upon calcination, the minimization of surface states that would otherwise trap photoinduced charge carriers. On balance, we have extended the use of metal oxo/alkoxy clusters to AACVD for functional coatings, discovering a novel and simple strategy to obtain a faceted semiconductor without the use of dopants. These results will trigger research in using metal oxo clusters in the preparation of efficient, nanostructured and stable photoelectrodes, as well as, other possible components of energy devices.Conflicts of interest
There are no conflicts to declare.Acknowledgements
The authors would like to acknowledge both EPSRC for funding the Centre for Doctoral Training in Sustainable Chemical Technologies at the University of Bath (EP/L016354/1) and the Material and Chemical Characterisation facility (MC2) at the University of Bath. SE would like to acknowledge the financial support from EPSRC (EP/P008097/1).References
- Intergovernmental panel on climate change, Summary for Policymakers of IPCC Special Report on Global Warming of 1.5 °C approved by governments, 2018.
- K. Nakata and A. Fujishima, J. Photochem. Photobiol., C, 2012, 13, 169–189 CrossRef CAS.
- M. Ni, M. K. H. Leung, D. Y. C. Leung and K. Sumathy, Renewable Sustainable Energy Rev., 2007, 11, 401–425 CrossRef CAS.
- M. Ge, C. Cao, J. Huang, S. Li, Z. Chen, K.-Q. Zhang, S. S. Al-Deyab and Y. Lai, J. Mater. Chem. A, 2016, 4, 6772–6801 RSC.
- J. Tian, Z. Zhao, A. Kumar, I. Boughton and H. Liu, Chem. Soc. Rev., 2014, 43, 6920–6937 RSC.
- F. E. Osterloh, Chem. Soc. Rev., 2013, 42, 2294–2320 RSC.
- G. Liu, H. G. Yang, J. Pan, Y. Q. Yang, G. Q. M. Lu and H. M. Cheng, Chem. Rev., 2014, 114, 9559–9612 CrossRef CAS PubMed.
- J. Pan, G. Liu, G. Q. Lu and H. M. Cheng, Angew. Chem., Int. Ed., 2011, 50, 2133–2137 CrossRef CAS PubMed.
- L. Liu, Y. Du, X. Niu, W. Li, J. Li, X. Yang and Q. Feng, ChemistrySelect, 2018, 3, 9953–9959 CrossRef CAS.
- P. Wen, H. Itoh, W. Tang and Q. Feng, Langmuir, 2007, 23, 11782–11790 CrossRef CAS PubMed.
- C. Chen, L. Xu, G. A. Sewvandi, T. Kusunose, Y. Tanaka, S. Nakanishi and Q. Feng, Cryst. Growth Des., 2014, 14, 5801–5811 CrossRef CAS.
- D. V Bavykin, V. N. Parmon, A. Lapkin and F. C. Walsh, J. Mater. Chem., 2004, 14, 3370–3377 RSC.
- Q. Liu, H. Lu, Z. Shi, F. Wu, J. Guo, K. Deng and L. Li, ACS Appl. Mater. Interfaces, 2014, 6, 17200–17207 CrossRef CAS PubMed.
- M. Xu, P. Da, H. Wu, D. Zhao and G. Zheng, Nano Lett., 2012, 12, 1503–1508 CrossRef CAS PubMed.
- H. Li, Y. Wang, G. Chen, Y. Sang, H. Jiang, J. He, X. Li and H. Liu, Nanoscale, 2016, 8, 6101–6109 RSC.
- G. Wu, J. Wang, D. F. Thomas and A. Chen, Langmuir, 2008, 24, 3503–3509 CrossRef CAS PubMed.
- K. L. Choy, Prog. Mater. Sci., 2003, 48, 57–170 CrossRef CAS.
- A. J. Gardecka, C. Bishop, D. Lee, S. Corby, I. P. Parkin, A. Kafizas and S. Krumdieck, Appl. Catal., B, 2018, 224, 904–911 CrossRef CAS.
- C. Edusi, G. Hyett, G. Sankar and I. P. Parkin, Chem. Vap. Deposition, 2011, 17, 30–36 CrossRef CAS.
- A. A. Tahir, T. A. N. Peiris and K. G. U. Wijayantha, Chem. Vap. Deposition, 2012, 18, 107–111 CrossRef CAS.
- S. Sathasivam, D. S. Bhachu, Y. Lu, N. Chadwick, S. A. Althabaiti, A. O. Alyoubi, S. N. Basahel, C. J. Carmalt and I. P. Parkin, Sci. Rep., 2015, 5, 10952 CrossRef CAS PubMed.
- C. Edusi, G. Sankar and I. P. Parkin, Chem. Vap. Deposition, 2012, 18, 126–132 CrossRef CAS.
- V. Diesen, C. W. Dunnill, J. C. Bear, S. Firth, M. Jonsson and I. P. Parkin, Chem. Vap. Deposition, 2014, 20, 91–97 CrossRef CAS.
- J. S. Chen and X. W. Lou, Chem. Sci., 2011, 2, 2219–2223 RSC.
- M. S. Park, D. Walsh, J. Zhang, J. H. Kim and S. Eslava, J. Power Sources, 2018, 404, 149–158 CrossRef CAS.
- S. Eslava, B. P. R. Goodwill, M. McPartlin and D. S. Wright, Inorg. Chem., 2011, 50, 5655–5662 CrossRef CAS PubMed.
- Y. Hu, C. Li, F. Gu and Y. Zhao, J. Alloys Compd., 2007, 432, 5–9 CrossRef.
- J. S. J. Hargreaves, Catal., Struct. React., 2016, 2, 33–37 CrossRef CAS.
- G. B. Harris, Philos. Mag., 1952, 43, 113–123 Search PubMed.
- J. E. Kroeze, T. J. Savenije and J. M. Warman, J. Am. Chem. Soc., 2004, 126, 7608–7618 CrossRef CAS PubMed.
- J. T. Carneiro, T. J. Savenije and G. Mul, Phys. Chem. Chem. Phys., 2009, 11, 2708–2714 RSC.
- F. F. Abdi, T. J. Savenije, M. M. May, B. Dam and R. van de Krol, J. Phys. Chem. Lett., 2013, 4, 2752–2757 CrossRef CAS.
- I. Oja, A. Mere, M. Krunks, R. Nisumaa, C. H. Solterbeck and M. Es-Souni, Thin Solid Films, 2006, 515, 674–677 CrossRef CAS.
- Z. Zhang and P. Wang, Energy Environ. Sci., 2012, 5, 6506–6512 RSC.
- Z. Chen, H. N. Dinh and E. Miller, Photoelectrochemical water splitting: standards, experimental methods, and protocols, Springer-VerlagNew York, 2013 Search PubMed.
- C. R. Lhermitte, J. Garret Verwer and B. M. Bartlett, J. Mater. Chem. A, 2016, 4, 2960–2968 RSC.
- H. Jia, J. Stark, L. Q. Zhou, C. Ling, T. Sekito and Z. Markin, RSC Adv., 2012, 2, 10874–10881 RSC.
- K. Watenpaugh and C. N. Caughlan, Chem. Commun., 1967, 76–77 RSC.
- R. Schmid, A. Mosset and J. Galy, J. Chem. Soc., Dalton Trans., 1991, 8, 1999–2005 RSC.
- X. Hou and K.-L. Choy, Chem. Vap. Deposition, 2006, 12, 583–596 CrossRef CAS.
- Z. Liu, Y. Zheng, T. Gao, J. Zhang, X. Sun and G. Zhou, Int. J. Hydrogen Energy, 2017, 42, 21775–21785 CrossRef CAS.
- L. Wang, L. Zang, J. Zhao and C. Wang, Chem. Commun., 2012, 48, 11736–11738 RSC.
- M. C. Biesinger, L. W. M. Lau, A. R. Gerson and R. S. C. Smart, Appl. Surf. Sci., 2010, 257, 887–898 CrossRef CAS.
- P. Georgios and S. M. Wolfgang, Solid State Phenom., 2010, 162, 163–177 CAS.
- J. Yan, G. Wu, N. Guan, L. Li, Z. Li and X. Cao, Phys. Chem. Chem. Phys., 2013, 15, 10978–10988 RSC.
- Q. Zhang, N. Bao, X. Wang, X. Hu, X. Miao, M. Chaker and D. Ma, Sci. Rep., 2016, 6, 1–15 CrossRef PubMed.
- D. Zhao, X. Yang, C. Chen and X. Wang, J. Colloid Interface Sci., 2013, 398, 234–239 CrossRef CAS PubMed.
- A. A. Galuska, J. C. Uht and N. Marquez, J. Vac. Sci. Technol., A, 1988, 6, 110–122 CrossRef CAS.
- H. Kolev, K. L. Kostov, G. Tyuliev and C. Christov, Nanosci. Nanotechnol., 2013, 13, 29–32 Search PubMed.
- G. A. Battiston, R. Gerbasi, M. Porchia and A. Marigo, Thin Solid Films, 1994, 239, 186–191 CrossRef CAS.
- L. Ye, J. Liu, L. Tian, T. Peng and L. Zan, Appl. Catal., B, 2013, 134–135, 60–65 CrossRef CAS.
- L. Pan, J.-J. Zou, S. Wang, X.-Y. Liu, X. Zhang and L. Wang, ACS Appl. Mater. Interfaces, 2012, 4, 1650–1655 CrossRef CAS PubMed.
- C. K. Nguyen, H. G. Cha and Y. S. Kang, Cryst. Growth Des., 2011, 11, 3947–3953 CrossRef CAS.
- D. A. H. Hanaor and C. C. Sorrell, J. Mater. Sci., 2011, 46, 855–874 CrossRef CAS.
- N. Avci, P. F. Smet, H. Poelman, N. Van De Velde, K. De Buysser, I. Van Driessche and D. Poelman, J. Sol-Gel Sci. Technol., 2009, 52, 424–431 CrossRef CAS.
- P. Periyat, B. Naufal and S. G. Ullattil, Mater. Sci. Forum, 2016, 855, 78–93 Search PubMed.
- B. M. Rao and S. C. Roy, RSC Adv., 2014, 4, 38133–38139 RSC.
- A. L. Castro, M. R. Nunes, A. P. Carvalho, F. M. Costa and M. H. Florêncio, Solid State Sci., 2008, 10, 602–606 CrossRef CAS.
- D. Bersani, P. P. Lottici and X.-Z. Ding, Appl. Phys. Lett., 1998, 72, 73–75 CrossRef CAS.
- S. Wang, L. Zhao, L. Bai, J. Yan, Q. Jiang and J. Lian, J. Mater. Chem. A, 2014, 2, 7439–7445 RSC.
- N. L. Wu, S. Y. Wang and I. A. Rusakova, Science, 1999, 285, 1375–1377 CrossRef CAS PubMed.
- W. Li, C. Ni, H. Lin, C. P. Huang and S. I. Shah, J. Appl. Phys., 2004, 96, 6663–6668 CrossRef CAS.
- Y. F. Chen, C. Y. Lee, M. Y. Yeng and H. T. Chiu, J. Cryst. Growth, 2003, 247, 363–370 CrossRef CAS.
- U. Balachandran and N. G. Eror, J. Solid State Chem., 1982, 42, 276–282 CrossRef CAS.
- S. A. El-Khodary, G. M. El-Enany, M. El-Okr and M. Ibrahim, Electrochim. Acta, 2014, 150, 269–278 CrossRef CAS.
- L. Bin Xiong, J. L. Li, B. Yang and Y. Yu, J. Nanomater., 2012, 2012, 1–13 Search PubMed.
- L. Zhou, Y. Yang, J. Zhang and P. M. Rao, ACS Appl. Mater. Interfaces, 2017, 9, 11356–11362 CrossRef CAS PubMed.
- W. H. Leng, P. R. F. Barnes, M. Juozapavicius, B. C. O'Regan and J. R. Durrant, J. Phys. Chem. Lett., 2010, 1, 967–972 CrossRef CAS.
- Y. Li, N. Guijarro, X. Zhang, M. S. Prévot, X. A. Jeanbourquin, K. Sivula, H. Chen and Y. Li, ACS Appl. Mater. Interfaces, 2015, 7, 16999–17007 CrossRef CAS PubMed.
- R. Katoh, A. Furube, K. I. Yamanaka and T. Morikawa, J. Phys. Chem. Lett., 2010, 1, 3261–3265 CrossRef CAS.
- J. Ravensbergen, F. F. Abdi, J. H. Van Santen, R. N. Frese, B. Dam, R. Van De Krol and J. T. M. Kennis, J. Phys. Chem. C, 2014, 118, 27793–27800 CrossRef CAS.
- M. Kuno, D. P. Fromm, H. F. Hamann, A. Gallagher and D. J. Nesbitt, J. Chem. Phys., 2002, 112, 3117–3120 CrossRef.
- J. Nelson and R. E. Chandler, Coord. Chem. Rev., 2004, 248, 1181–1194 CrossRef CAS.
- P. H. Sher, J. M. Smith, P. A. Dalgarno, R. J. Warburton, X. Chen, P. J. Dobson, S. M. Daniels, N. L. Pickett and P. O'Brien, Appl. Phys. Lett., 2008, 92, 101111 CrossRef.
- S. Nakajima and R. Katoh, J. Mater. Chem. A, 2015, 3, 15466–15472 RSC.
- B. Neumann, P. Bogdanoff, H. Tributsch, S. Sakthivel and H. Kisch, J. Phys. Chem. B, 2005, 109, 16579–16586 CrossRef CAS PubMed.
- T. Guminskaya, K. Ellmer, P. Bogdanoff, U. Koslowski, T. Dittrich and H. Tributsch, J. Vac. Sci. Technol., A, 2006, 24, 2199–2205 CrossRef.
- X. Wang, J. Xie and C. Ming Li, J. Mater. Chem. A, 2015, 3, 1235–1242 RSC.
- L. Sun, J. Cai, Q. Wu, P. Huang, Y. Su and C. Lin, Electrochim. Acta, 2013, 108, 525–531 CrossRef CAS.
- R. Beranek, Adv. Phys. Chem., 2011, 80–83 Search PubMed.
- P. Piszczek, M. Richert and A. Wojtczak, Polyhedron, 2008, 27, 602–608 CrossRef CAS.
Footnote |
| † Electronic supplementary information (ESI) available. See DOI: 10.1039/c9ta04482e |
| This journal is © The Royal Society of Chemistry 2019 |

