 Open Access Article
High-throughput single-particle detections using a dual-height-channel-integrated pore†
Wataru
Tonomura
*a,
Makusu
Tsutsui
 *a,
Akihide
Arima
 a,
Kazumichi
Yokota
ab,
Masateru
Taniguchi
a,
Takashi
Washio
a and
Tomoji
Kawai
*a
a,
Kazumichi
Yokota
ab,
Masateru
Taniguchi
a,
Takashi
Washio
a and
Tomoji
Kawai
*a
aThe Institute of Scientific and Industrial Research, Osaka University, Japan. E-mail: tonomura@sanken.osaka-u.ac.jp; tsutsui@sanken.osaka-u.ac.jp; kawai@sanken.osaka-u.ac.jp
bNational Institute of Advanced Industrial Science and Technology, Japan
First published on 25th March 2019
Abstract
We report a proof-of-principle demonstration of particle concentration to achieve high-throughput resistive pulse detections of bacteria using a microfluidic-channel-integrated micropore. We fabricated polymeric nanochannels to trap micrometer-sized bioparticles via a simple water pumping mechanism that allowed aggregation-free size-selective particle concentration with negligible loss. Single-bioparticle detections by ionic current measurements were then implemented through releasing and transporting the thus-collected analytes to the micropore. As a result, we attained two orders of magnitude enhancement in the detection throughput by virtue of an accumulation effect via hydrodynamic control. The device concept presented may be useful in developing nanopores and nanochannels for high-throughput single-particle and -molecule analyses.
Introduction
Solid-state nanopores and nanochannels have been used as a useful platform for single-particle and -molecule analyses.1–6 The working principle is based on measurements of the temporal change in the ionic current flowing through a conduit once an object passing through there.7 As larger particles tend to block more ions inside the channel, one can discriminate their size by comparing the height of the so-called resistive pulses recorded for each analyte translocated through the sensing zone.8,9 The ultrasensitive sensor capability of solid-state nanopores, however, generally comes at a price of degraded detection throughput. This is because of the fact that the channel is required to be comparable in size to that of the target of concern so as to obtain a large-enough ionic blockade current for single-particle detections.8,9 As such, only particles that exist very near a pore can be drawn and detected, the circumstance of which inevitably leads to a low throughput.10 The situation is akin to that in microscope technologies, wherein the observation area is traded-off with the magnification. Moreover, although pre-treatments such as centrifugation and PCR amplification can offer adequately high sample concentrations for nanopore measurements,11 aggregation often becomes a problem since pores are usually not so large to admit aggregated particles and molecules.In this context, extensive research efforts have been devoted to incorporating additional structures and probes to improve the particle detection efficiency of solid-state pore sensors. Multipore structures were reported to render increased detection throughput.12–14 The electric field,15,16 laser light,17 temperature gradient,18,19 and salt-gradient20 were also found to serve as effective driving forces to expedite the capture of analytes into nanopores. However, these concepts generally involve side effects on the ionic current blockade through cross-pore interactions and electric field cross-talk.14 In contrast, hydrodynamic control of water flow is a more direct and simple way of regulating mass transport outside the pores with little interference with the resistive pulse measurements.21 Here we report a nanochannel-integrated pore sensor for high-throughput single-particle detections. It uses a fluidic channel array to filter oversized particles in liquid via fluid flow manipulations that also enabled size-dependent and aggregation-free concentration with a negligible loss of analytes. By this, we demonstrate two orders of magnitude enhancement in the detection throughput for Escherichia coli in an electrolyte solution.
Experimental
Fabrication of dual-height fluidic channels
500 nm thick photo-resist SU-8 was spin-coated on a coated Si wafer. Arrays of 5 μm-wide lines were patterned with a 15 μm pitch by a light-emitting diode (LED) lithography process. Subsequently, 30 μm thick SU-8 was over-coated and a main channel and rest of the structure were delineated by LED lithography. After development, we obtained an SU-8 mold of dual-height fluidic channel structure. On the mold substrate, we cured polydimethylsiloxane (PDMS; Sylgard184, Dow Corning) which was baked at 100 degrees Celsius for 24 hours. By cutting into a 20 mm × 20 mm size and peeling-off, we obtained a PDMS block with dual-height channels formed on one side.Formation of Si3N4 micropores
A 300 μm-thick Si wafer, both sides coated with low-pressure chemical vapour deposition-grown 50 nm-thick Si3N4 layers, was diced into 25 mm × 25 mm pieces. On the Si chip, we placed a metal mask and etched-out the exposed Si3N4 of 1 mm × 1 mm area on one side. Then, the chip was immersed in a 25% KOH solution (Aldrich) heated at 80 degrees Celsius for deep etching of Si. By completely dissolving the Si layer, we formed a 100 μm × 100 μm sized Si3N4 membrane of approximately 40 nm thickness. On the membrane, we spin coated an electron beam resist (ZEP520A-7, Zeon) and drew a micropore by electron-beam lithography. After development, we opened the pore by reactive ion etching of Si3N4 using CHF3 as the etchant gas. Finally, the residual resist was removed by keeping the chip in N,N-dimethylformamide (Wako) overnight followed by rinsing in isopropanol, ethanol, and acetone.Integration of fluidic channels and a micropore
To the micropore chip, we adhered a piece of Kapton tape to protect a portion of the Si3N4 layer during the under-mentioned plasma treatment so as to keep the local region relatively hydrophobic to block water flow into the pore during the particle concentration through hydrodynamic control. Both the micropore chip and the PDMS block were exposed to oxygen plasma for surface activation. The surfaces were then put together for eternal bonding under an optical microscope to align both structures. In the PDMS block, several holes were punched that were used as solution inlets and outlets as well as a place to insert Ag/AgCl rods for the ionic current measurements.Hydrodynamic control
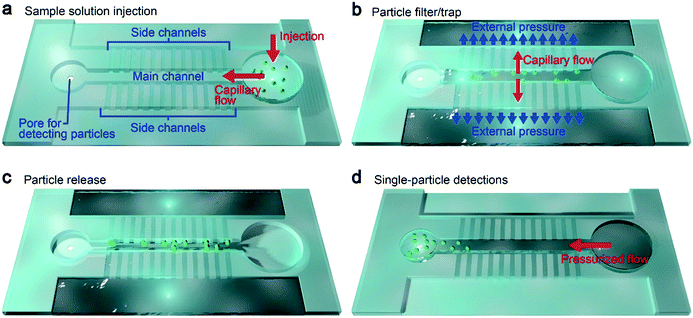
Teflon tubes were inserted into the inlet and outlet holes in the PDMS block, whose other ends were connected to a pressure control system (OB1, Elveflow). This device was arranged to quicken the draining of the particle-containing PBS buffer capillary-injected into the side channel array via the main channel at a negative hydro-pressure of −70 kPa during the particle concentration stage. After allowing the entire liquid to flow, we released the pressure to repel the trapped particles from the side channel openings. The particles were then transported to the micropore for resistive pulse detections.Ionic current measurements
Two Ag/AgCl electrodes were placed at the top and bottom of the micropore. A bias voltage of 0.1 V was applied to the membrane and the ionic current through the pore was recorded at a 1 MHz sampling rate by using a custom-built current amplifier and a fast digitizer (NI-5922, National Instruments).Finite element analysis
Pressure-driven water flow along with particle motions in the fluidic channels was simulated using COMSOL.17 We defined three-dimensional models of the 500 nm-high side channels of lengths 100 μm, 50 μm, and 30 μm connected to reservoirs. The pressure was set as −70 kPa and 0 kPa at the upper and the lower ends. The induced fluid speed was obtained through solving the Navier–Stokes equation under an assumption of lamellar flow. Bulk physical properties were used for material parameters.Results and discussion
Structure of a fluidic-channel-integrated micropore
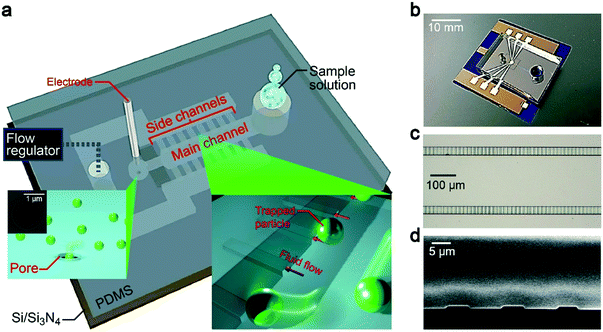
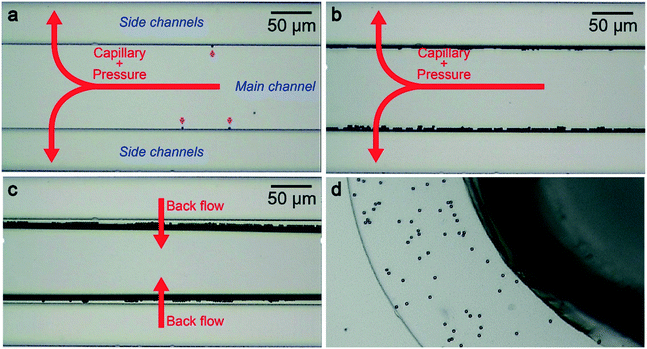
Our device concept is based on trapping oversized particles at shallow channels (Fig. 1a and b). Specifically, we employed 500 nm-thick and 5 μm-wide channel arrays, which we call side channels (Fig. 1c and d). Pressure-assisted capillary flow was induced through these conduits (Fig. 2a). When the solution contains objects larger than the height of the channels, they tend to be trapped at the entrance while smaller particles flow through with the fluid (Fig. 2b, see also Fig. 1a right inset). In this way, we can not only concentrate analytes but at the same time filter small contaminants by a simple hydrodynamic control.22 Here, an important design parameter is the length of the main and side channels. The former cannot be made too short so as to ensure that all the particles will be captured at the side channels, while the latter should be made short to mitigate the pressure loss for shortening the time to complete the concentration process. For this, we investigated the influence of the side channel length Ls on the particle trap efficiency while fixing the channel height to 500 nm (Fig. 1d). At the main channel downstream, there was a micropore of diameter dpore formed in a 50 nm-thick Si3N4 membrane (Fig. 1a, left inset). After releasing the trapped particles (Fig. 2c), they were transported via water flow control toward this micropore for single-particle detections by cross-pore ionic current measurements (Fig. 2d).Particle concentration via hydrodynamic control in a microchannel system
Using the nanochannel-micropore structure, we examined particle trapping-to-release via hydro-pressure control. For this, we prepared a dilute suspension of 6 μm-sized carboxylated polystyrene beads in 0.1× PBS at a concentration of 104 particles per mL. When a negative pressure P of −70 kPa was applied across the side channel, we observed fast-moving microbeads under an optical microscope that tend to approach and become immobilized at the entrance of one of the side channels (Fig. 3a, see also Movie S1†). The channel to be trapped seemed to be random, reflecting the stochastic nature of the particle dynamics. Meanwhile, there was an overall trend that particles initially moving close to (away from) the main channel center tend to be captured at a side channel at the back (front). Owing to this feature, the particles less frequently get in contact with each other indicating negligible aggregation.After draining the entire amount of solution, the particles were all trapped at the side channels with none of them left in the main channel which indicates 100% capture efficiency when ignoring the possibility of non-specific adhesion in non-observed regions such as the inlet hole and the Teflon tubes (Fig. 3b; see also Table S1†). To release the polymeric beads for post analysis, we subsequently turned-off the pressure and pushed the beads into the main channel (Fig. 3c). This was, however, found to be critically difficult in as-fabricated microchannels wherein we observed more than 86% of the particles being non-released due presumably to non-specific binding to the hydrophobic PDMS surface (ESI† Fig. S1).23 In stark contrast, the polystyrene beads became easily releasable when the channel surface was pre-treated with oxygen plasma (Fig. 3c; see also Movie S2†). It can be interpreted as a consequence of the created silanol group24,25 that not only offered hydrophilicity but also negative surface charges that contributed to induction of Coulomb repulsion against the negatively-charged polymeric microbeads.24,25 By this simple dry process, the particles eventually became completely removable leaving not a single bead unreleased at the side channels, which means 100% release efficiency. Finally, the released particles were sent to the micropore by flowing the buffer along the main channel (Fig. 3d, see also Movie S3†). These experiments prove the principle-of-operation of the nanochannel-integrated pore for aggregation-free size-selective particle concentration with negligible loss.
Rational design of side channels for rapid particle concentration
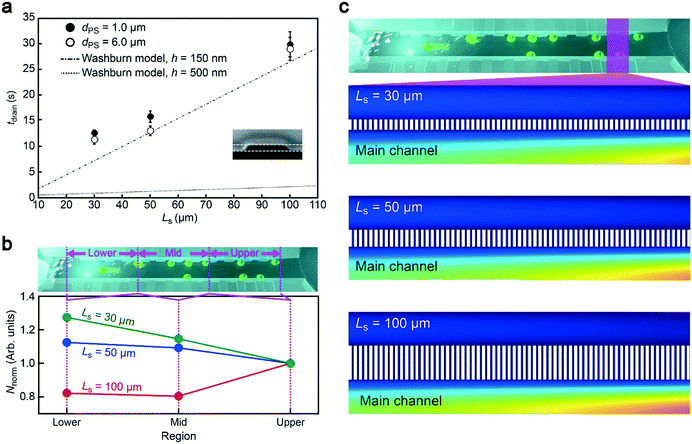
Having demonstrated the particle concentration capability, it is important to explore an optimal channel design for rapid particle concentration. As mentioned already, the length of the side channels Ls is a crucial parameter determining the flow rate under a constant P. Hence we fabricated the side channels of Ls = 30 μm, 50 μm, and 100 μm and recorded the time tdrain required to drain 30 μL of the particle solution. Here, we used particles of two different sizes, 6 μm and 1 μm in diameter, to verify the robustness of the method. As a result, we obtained a steady increase in tdrain with Ls irrespective of the polymeric beads employed, which is in qualitative accordance with the Washburn model26 predicting the position X of the moving meniscus at time t as X = (γ![[thin space (1/6-em)]](https://www.rsc.org/images/entities/char_2009.gif) cos
cos![[thin space (1/6-em)]](https://www.rsc.org/images/entities/char_2009.gif) θht/3μ)0.5, where γ is the surface tension of the liquid in air, θ is the contact angle of the liquid on the channel walls, h is the channel height and μ is the fluid viscosity (Fig. 4a). Specifically, from this equation, we calculated the time tch required for X to be increased to Ls, from which we deduced the flow speed vch as Ls/tch. Then, the flow rate was obtained as NchSvch where S is the cross-sectional area of the rectangular-shaped side channel and Nch = 660 is the number of side channels. The results illustrate the effectiveness of utilizing short side channels to accelerate the concentration process.
θht/3μ)0.5, where γ is the surface tension of the liquid in air, θ is the contact angle of the liquid on the channel walls, h is the channel height and μ is the fluid viscosity (Fig. 4a). Specifically, from this equation, we calculated the time tch required for X to be increased to Ls, from which we deduced the flow speed vch as Ls/tch. Then, the flow rate was obtained as NchSvch where S is the cross-sectional area of the rectangular-shaped side channel and Nch = 660 is the number of side channels. The results illustrate the effectiveness of utilizing short side channels to accelerate the concentration process.
Deformation of the elastic channel
Meanwhile, the drain time was found to be an order of magnitude longer than the theoretical expectation with h = 500 nm. On the other hand, the plots were close to the calculation when assuming much smaller channels of h = 150 nm (Fig. 4a). The lowered height most likely stems from the shrinkage of the conduit during the experiments due to mechanical deformation of ductile PDMS under the negative pressure.27 This could be resolved simply by replacing the rubber material with hard compounds such as glass28 and cyclo-olefin polymers.29 Nonetheless, these results serve as a guide to design appropriate side channels for completing the concentration process within tdrain under a given P.Particle trapping mechanism
The aggregation-free concentration is a key for post resistive pulse analysis,11 which can be implemented only when particles are sporadically trapped along the main channel (Fig. 3b). For this, the main channel dimension has been arranged to the present size so as to provide an appropriate amount of space for the analytes to move through the conduit before being drawn into a side channel via the drag force. Meanwhile, Ls is also anticipated to affect the particle trapping dynamics through changing the transverse fluid flow rates: too long (short) Ls would be expected a priori to result in more frequent capturing of particles at the back (front) side of the main channel. To shed light on the concentration mechanism, therefore, we counted the number of trapped particles in three different regions from the front (0 mm) to the back end (6 mm) of the main channel (Fig. 4b). Unexpectedly, by plotting the number of particles normalized by that at 0 to 2 mm, it was revealed that more particles tended to be trapped at the back (front) side with shorter (longer) side channels.To further study the counterintuitive Ls dependence of the trapped particle distributions, we performed numerical simulations of the fluid velocity vw from the main to the side channels in a framework of Navier–Stokes theory with an assumption of lamellar flow. The vw diagram illustrated faster convection at the main channel upstream in the case of longer Ls (Fig. 4c). The associated hydrodynamic drag is, therefore, anticipated to bring a higher number of particles at the upstream of the 100 μm-long side channels than the other shorter ones, which is in qualitative accordance with the experimental observations (Fig. 4b).
High-throughput single-bioparticle detections
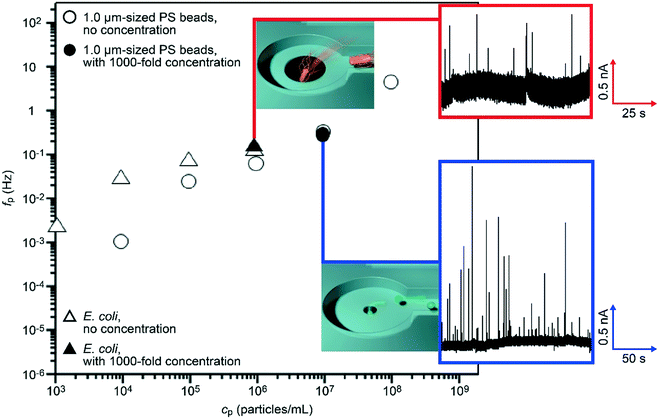
We evaluated the particle detection efficiency in the nanochannel-integrated micropores. We measured a dilute suspension of 1.0 μm-sized carboxylated polystyrene beads in 0.1× PBS at a concentration cp of 104 particles per mL with a micropore of dpore = 1.5 μm. After the hydro-pressure-driven concentration by a nominal factor of 1000 (30 μL of the particle solution was flowed through the side channels followed by transportation to the pore chamber with 0.03 μL buffer), we recorded the temporal change in the cross-pore ionic current Iion under a DC bias voltage of 0.1 V. The Iion traces showed a pulse-like change in the current which is suggestive of electrophoretic translocation of the negatively-charged polymeric beads through the micropore (Fig. 5, trace in blue square).30 The frequency fp used to observe an ionic spike per time, which is equivalent to the particle capture rate, was 0.31 Hz (Fig. 5, solid circle). This value was found to be considerably higher than that without the concentration showing the ionic spike-like signals at about 0.001 Hz at 104 particles per mL. Here, the enhancement ratio of 310 in fp by the pre-concentration process represents a fair agreement with the nominal degree of particle concentration.In order to verify the feasibility of the nanochannel-integrated-micropore sensor for bioanalytical applications, the resistive pulse measurements were extended to bacteria detections. We tested E. coli dispersed in 0.1× PBS at 103 cells per mL. After the 1000-fold concentration (see Movie S4 and S5† showing, respectively, E. coli being trapped and released from a side channel), we acquired resistive pulses from which we deduced the bacterial capture rate of about 0.14 Hz (Fig. 5, solid triangle). This value is to be compared to fp = 0.003 Hz at cp = 103 mL−1 without the concentration suggesting an increase by a factor of 46 in the single-bacteria detection throughput. The fact that the number is lower than 1000 would be attributed to the presence of non-released cells being strongly adhered to the channel wall due to the rather hydrophobic nature of their surface.31 Nonetheless, the loss of detectable bacteria can be said as marginal. More importantly, we were able to continue the single-bacteria detections for more than 10 minutes without any clogging of the micropore owing to the aggregation-free concentration mechanism. The present results offer a proof-of-concept of high-throughput single-bioparticle detections using a nanochannel-integrated micropore that would find wide applications such as in environmental monitoring of water32 and bacterial screening of food.33,34
Conclusions
We developed a nanochannel-integrated micropore for high-throughput single-particle analyses via resistive pulse measurements. Using the device, we demonstrated aggregation-free particle concentration by a hydro-pressure-controlled trap-and-release mechanism at arrays of sub-particle-sized channels. This enabled three orders of magnitude enhancement in the throughput of resistive pulse detections of synthetic particles as well as bacterial cells.Conflicts of interest
There are no conflicts to declare.Acknowledgements
This work was supported by the ImPACT Program of Council for Science, Technology, and Innovation (Cabinet Office, Government of Japan).Notes and references
- S. Iqbal and R. Bashir, Nanopores: Sensing and Fundamental Biological Interactions, Springer, 2011 Search PubMed.
- W. Shi, A. K. Friedman and L. A. Baker, Anal. Chem., 2016, 89, 157–188 CrossRef PubMed.
- L. Luo, S. R. German, W.-J. Lan, D. A. Holden, T. L. Mega and H. S. White, Annu. Rev. Anal. Chem., 2014, 7, 513–535 CrossRef CAS PubMed.
- D. Branton, D. W. Deamer, A. Marziali, H. Bayley, S. A. Benner, T. Butler, M. Di Ventra, S. Garaj, A. Hibbs, X. Huang, S. B. Jovanovich, P. S. Krstic, S. Lindsay, X. S. Ling, C. H. Mastrangelo, A. Meller, J. S. Oliver, Y. V. Pershin, J. M. Ramsey, R. Riehn, G. V. Soni, V. Tobard-Cossa, M. Wanunu, M. Wiggin and J. A. Schloss, Nat. Biotechnol., 2008, 26, 1146–1153 CrossRef CAS PubMed.
- S. Howorka and Z. Siwy, Chem. Soc. Rev., 2009, 38, 2360–2384 RSC.
- D. G. Haywood, A. Saha-Shah, L. A. Baker and S. C. Jacobson, Anal. Chem., 2011, 6, 615–624 Search PubMed.
- W. H. Coulter, US Pat., 2656508, 1953 Search PubMed.
- R. Vogel, G. Willmott, D. Kozak, S. Roberts, W. Anderson, L. Groenewegen, B. Glossop, A. Barnett, A. Turner and M. Trau, Anal. Chem., 2011, 83, 3499–3506 CrossRef CAS PubMed.
- H. Yasaki, T. Yasui, T. Yanagida, N. Kaji, M. Kanai, K. Nagashima, T. Kawai and Y. Baba, J. Am. Chem. Soc., 2017, 139, 14137–14142 CrossRef CAS PubMed.
- E. E. Sheehan and L. J. Whitman, Nano Lett., 2005, 5, 803–807 CrossRef PubMed.
- K. J. Freedman, M. Jurgens, A. Prabhu, C. W. Ahn, P. Jemth, J. B. Edel and M. J. Kim, Anal. Chem., 2011, 83, 5137–5144 CrossRef CAS PubMed.
- M. A. Edwards, S. R. German, J. E. Dick, A. J. Bard and H. White, ACS Nano, 2015, 9, 12274–12282 CrossRef CAS PubMed.
- R. Torre, J. Larkin, A. Singer and A. Meller, Nanotechnology, 2012, 23, 385308 CrossRef PubMed.
- M. Tsutsui, K. Yokota, T. Nakada, A. Arima, W. Tonomura, M. Taniguchi, T. Washio and T. Kawai, ACS Sens., 2018, 3, 2693–2701 CrossRef CAS PubMed.
- Y. He, M. Tsutsui, C. Fan, M. Taniguchi and T. Kawai, ACS Nano, 2011, 5, 8391–8397 CrossRef CAS PubMed.
- K. J. Freedman, L. M. Otto, A. P. Ivanov, A. Barik, S.-H. Oh and J. B. Edel, Nat. Commun., 2016, 7, 10217 CrossRef CAS PubMed.
- N. D. Fiori, A. Squires, D. Bar, T. Gilboa, T. D. Moustakas and A. Meller, Nat. Nanotechnol., 2013, 8, 946–951 CrossRef PubMed.
- Y. He, M. Tsutsui, R. H. Scheicher, F. Bai, M. Taniguchi and T. Kawai, ACS Nano, 2013, 7, 538–546 CrossRef CAS PubMed.
- M. Zhang, C. Ngampeerapong, D. Radin, A. Ahmadian, I. Sychugov and J. Linnros, ACS Sens., 2018, 12, 4574–4582 CrossRef CAS PubMed.
- M. Wanunu, W. Morrison, R. Rabin, A. Y. Grosberg and A. Meller, Nat. Nanotechnol., 2010, 5, 160–165 CrossRef CAS PubMed.
- J.-L. Fraikin, T. Teesalu, C. M. McKenney, E. Ruoslahti and A. N. Cleland, Nat. Nanotechnol., 2011, 6, 308–313 CrossRef CAS PubMed.
- M. N. Hamblin, J. Xuan, D. Maynes, H. D. Tolley, D. M. Belnap, A. T. Woolley, M. L. Lee and A. R. Hawkins, Lab Chip, 2010, 10, 173–178 RSC.
- D. T. Eddington, J. P. Puccinelli and D. J. Beebe, Sens. Actuators, B, 2006, 114, 170–172 CrossRef CAS.
- M. Mrra, E. Occhiello, R. Marola, F. Garbassi, P. Humphrey and D. Johnson, J. Colloid Interface Sci., 1990, 137, 11–24 CrossRef.
- S. Bhattacharaya, A. Datta, J. M. Berg and S. Gangopadhyay, J. Microelectromech. Syst., 2005, 14, 590–597 Search PubMed.
- E. W. Washburn, Phys. Rev., 1921, 17, 273–278 CrossRef.
- B.-Y. Xu, X.-N. Yan, J.-D. Zhang, J.-J. Xu and H.-Y. Chen, Lab Chip, 2012, 12, 381–386 RSC.
- P. Mao and J. Han, Lab Chip, 2005, 5, 837–844 RSC.
- L. Yi, W. Xiaodong and Y. Fan, J. Mater. Process. Technol., 2008, 208, 63–69 CrossRef.
- M. Tsutsui, Y. He, K. Yokota, A. Arima, S. Hongo, M. Taniguchi, T. Washio and T. Kawai, ACS Nano, 2016, 10, 803–809 CrossRef CAS PubMed.
- M. Rosenberg, D. Gutnick and E. Rosenberg, FEMS Microbiol. Lett., 1980, 9, 29–33 CrossRef CAS.
- J. E. Hobbie, R. J. Daley and S. Jasper, Appl. Environ. Microbiol., 1977, 33, 1225–1228 CAS.
- S. Tokonami, E. Shimizu, M. Tamura and T. Iida, Sci. Rep., 2017, 7, 16651 CrossRef PubMed.
- I. Percin, N. Idil, M. Bakhshpour, E. Yilmaz, B. Mattiasson and A. Denizli, Sensors, 2017, 17, 1375 CrossRef PubMed.
Footnote |
| † Electronic supplementary information (ESI) available: Fig. S1, Movie S1–S5. See DOI: 10.1039/c8lc01371c |
| This journal is © The Royal Society of Chemistry 2019 |

