 Open Access Article
Creative Commons Attribution 3.0 Unported Licence
Computational high-throughput screening of polymeric photocatalysts: exploring the effect of composition, sequence isomerism and conformational degrees of freedom†
Isabelle
Heath-Apostolopoulos
,
Liam
Wilbraham
 and
Martijn A.
Zwijnenburg
 *
*
Department of Chemistry, University College London, 20 Gordon Street, London WC1H 0AJ, UK. E-mail: m.zwijnenburg@ucl.ac.uk
First published on 13th December 2018
Abstract
We discuss a low-cost computational workflow for the high-throughput screening of polymeric photocatalysts and demonstrate its utility by applying it to a number of challenging problems that would be difficult to tackle otherwise. Specifically we show how having access to a low-cost method allows one to screen a vast chemical space, as well as to probe the effects of conformational degrees of freedom and sequence isomerism. Finally, we discuss both the opportunities of computational screening in the search for polymer photocatalysts, as well as the biggest challenges.
Introduction
Starting with the original work from Fujishima and Honda on the photoelectrolysis of water1 using a TiO2 photoanode, hydrogen evolution and water splitting photocatalysis generally involves the use of an inorganic semiconductor as a photoelectrode or photocatalyst. In the 1980s, other Japanese researchers2,3 demonstrated that conjugated polymers could drive the evolution of hydrogen from aqueous solutions containing various sacrificial electron donors. Carbon nitride was the first polymeric material reported to evolve both hydrogen and oxygen under illumination in the presence of a sacrificial electron/hole donor4 and was later shown to perform overall water splitting.5–7 Recently, conjugated polymer photoanodes were also shown to be able to oxidise water as part of a photoelectrochemical cell.8While a much less mature technology than use of inorganic semiconductors, organic polymer photocatalysts offer some very attractive features. In contrast to their inorganic counterparts, polymeric photocatalysts are generally based on the most abundant of elements, C, H, N, S, O; though some polymers are, for the moment, synthesised using less abundant metal catalysts. By way of co-polymerisation, the chemical space of possible polymers is also very large and, as a result, polymer properties are easily and systematically tuneable.9 A large number of polymers have now been reported to act as photocatalysts, including linear polymers9–14 quasi-amorphous polymer networks,12,15–25e.g. conjugated microporous polymers (CMPs), and crystalline polymer networks, e.g. crystalline organic frameworks (COFs).26–29 However, as yet only a minuscule fraction of the relevant chemical space has been explored. As an illustration, ∼600 distinct monomers for Suzuki or Stille coupling are readily commercially available, a number which could give rise to ∼600 linear homo-polymers, 360![[thin space (1/6-em)]](https://www.rsc.org/images/entities/char_2009.gif) 000 ordered binary co-polymers, 200
000 ordered binary co-polymers, 200![[thin space (1/6-em)]](https://www.rsc.org/images/entities/char_2009.gif) 000
000![[thin space (1/6-em)]](https://www.rsc.org/images/entities/char_2009.gif) 000 ordered ternary co-polymers etc. In contrast, probably only on the order of hundred linear polymers have as yet been studied as polymer photocatalysts in the open literature.
000 ordered ternary co-polymers etc. In contrast, probably only on the order of hundred linear polymers have as yet been studied as polymer photocatalysts in the open literature.
As the chemical space of potential polymers is orders of magnitude too large to explore by experiment alone, we have developed computational approaches to predict promising polymers to study in the lab, as well as to rationalise observed activities of synthesized polymers. Our original approach30 was based on density functional theory (DFT) calculations and allowed us to predict, amongst other things: the electron affinity (EA) of a polymer, which controls the thermodynamic driving force for proton reduction; a polymer’s ionisation potential (IP), which controls the thermodynamic driving force for water or sacrificial electron donor oxidation (see Fig. 1); as well as a polymer’s optical gap, which controls the wavelength below which light is absorbed. The polymer is modelled as a single-polymer strand embedded in a dielectric continuum that models the environment of the polymer, which, for polymers near the polymer–water interface, is dominated by water. We successfully used this approach to rationalise variation in activities for a significant number of polymers,9,10,14,18,24,29,31 including e.g. the effect of co-polymerisation,9 and successfully validated it against experimental IP/EA data from the literature.32
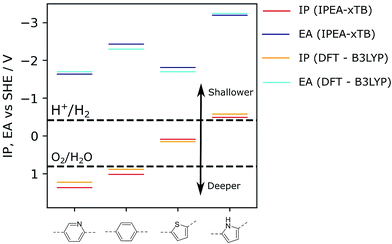 | ||
| Fig. 1 Examples of IP and EA values calculated for selected polymers. For comparison, values reported were obtained either via DFT (B3LYP) or the semi-empirical tight-binding approach used in this work as part of the high-throughput screening workflow (IPEA-xTB). For the ideal photocatalyst, the IP and EA values should straddle the water oxidation and hydrogen reduction potentials, respectively, which are reported here at pH = 7, such as for poly(pyridine) (left). B3LYP data taken from ref. 9 and 14. | ||
However, even DFT calculations are too slow to systematically explore chemical space. To address this issue, we recently developed an approach33 based on semiempirical tight-binding calculations using the (GFN/IPEA/sTDA)-xTB methods,34–36 which, after a calibration procedure, gives results that are comparable with DFT at a fraction of the computational cost.
Here we use a series of examples to illustrate the power of our new semiempirical approach. These include not only a small-scale example of the screening of a co-polymer chemical space for photocatalysts but also screens for the effect on the (co-)polymer properties of (i) different arrangements of monomeric units along the co-polymer chain, sequence isomerism, and (ii) conformerism. In a similar vein to composition, the large number of possible structures resulting from the different possible arrangements of monomeric units in co-polymers and conformation of long polymer chains renders DFT-based methodologies intractable and the sampling of such degrees of freedom is only possible, at this time, using the kind of semi-empirical approach discussed here.
Methodology & computational workflow
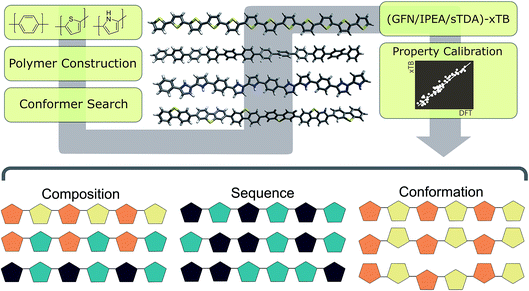
As outlined in Fig. 2, the workflow involves multiple steps. Starting from a simplified molecular-input line-entry system (SMILES)37 representation of each monomer unit, polymer structures were assembled using the Supramolecular Toolkit (stk),38,39 a python library, which takes base functionality from RDKit.40 We restrict polymer chain length in all cases to oligomers containing 12 aromatic rings along the polymer backbone. We have shown previously that oligomer models of this length provide approximately converged properties with respect to oligomer length.30Conformers for the different oligomer models are generated using a stochastic rather than systematic approach, sampling the conformational space of the polymer randomly using the Experimental-Torsion Distance Geometry with additional basic knowledge (ETKDG) method.41 Where a single, low-energy conformer is desired, we typically generate 500 conformers per polymer, which undergo a subsequent optimisation and energy ranking procedure using the Merck Molecular Force Field (MMFF)42 as implemented in RDKit. Where multiple conformers are required, we sample 500 conformers randomly, without energy ranking at the MMFF level. In either case the resulting conformers are subsequently re-optimised using GFN-xTB.34
For IP/EA calculations, we use an extension of the parent GFN-xTB method, IPEA-xTB,36 a differently-parameterised variant of GFN-xTB for the calculation of IP and EA values. For optical gaps, we use the simplified Tamm–Dancoff approach (sTDA)35,43 applied to orbitals and orbital eigenvalues obtained through xTB (sTDA-xTB).35 All GFN-xTB calculations were performed using the xtb code,44 while the sTDA results were obtained using the stda45 code. Non-sTDA calculations used the generalised Born surface area solvation model, with the default parameters for water distributed with the xtb code. In our previous work,33 we demonstrated that (TD-)DFT- and (GFN/sTDA)-xTB-derived IP, EA and optical gap values are very strongly, linearly correlated, with very low residual sum of squares values. As a result, we use the simple linear models fitted there to translate the xTB results such that they are maximally comparable to those obtained using our previous (TD-)DFT based approach.
A simple python script,46 exploiting combinatorics, was used to generate all possible co-polymer sequences at varying co-monomer ratios. For each of the three monomer compositions explored (phenylene–thiophene, phenylene–pyridine & pyridine–thiophene), we generate all possible co-polymer sequences for oligomer length of 12 monomer units and 5 different monomer ratios (e.g. phenylene![[thin space (1/6-em)]](https://www.rsc.org/images/entities/char_2009.gif) :
:![[thin space (1/6-em)]](https://www.rsc.org/images/entities/char_2009.gif) thiophene in ratios of 1
thiophene in ratios of 1![[thin space (1/6-em)]](https://www.rsc.org/images/entities/char_2009.gif) :
:![[thin space (1/6-em)]](https://www.rsc.org/images/entities/char_2009.gif) 3, 1
3, 1![[thin space (1/6-em)]](https://www.rsc.org/images/entities/char_2009.gif) :
:![[thin space (1/6-em)]](https://www.rsc.org/images/entities/char_2009.gif) 2, 1
2, 1![[thin space (1/6-em)]](https://www.rsc.org/images/entities/char_2009.gif) :
:![[thin space (1/6-em)]](https://www.rsc.org/images/entities/char_2009.gif) 1, 2
1, 2![[thin space (1/6-em)]](https://www.rsc.org/images/entities/char_2009.gif) :
:![[thin space (1/6-em)]](https://www.rsc.org/images/entities/char_2009.gif) 1 and 3
1 and 3![[thin space (1/6-em)]](https://www.rsc.org/images/entities/char_2009.gif) :
:![[thin space (1/6-em)]](https://www.rsc.org/images/entities/char_2009.gif) 1).
1).
Results and discussion
Conformational degrees of freedom
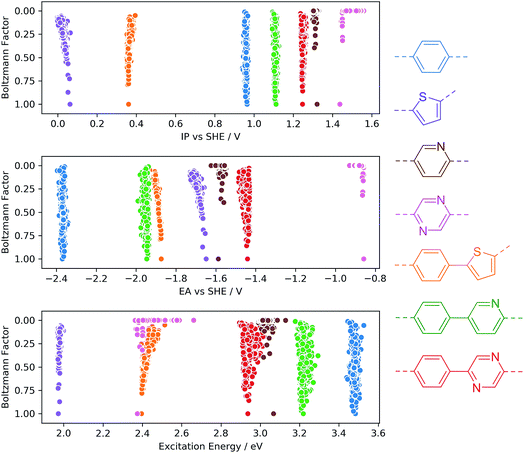
To investigate the sensitivity of the calculated properties to polymer conformation, we calculated IP, EA and optical gap values for 500 randomly generated conformers of four homo-polymers and three co-polymers. Each conformer was optimised using GFN-xTB, with the IP/EA and optical gap values calculated using IPEA-xTB and sTDA-xTB, respectively. Fig. 3 shows the calculated properties for each conformer of each polymer on the x-axis and the calculated Boltzmann factor relative to the lowest energy conformer on the y-axis. None of the properties calculated are found to be very sensitive to the polymer conformation. In line with previous work by us33 and others47 for polymers in the context of organic photovoltaics, the maximum variation of a given property with respect to conformation is generally of the order of 0.1 (e)V. Moreover, the variation for low-energy conformers (Boltzmann factors close to one) is even smaller. While we observe only a weak dependence of IP, EA and optical gap values on polymer conformation, it is possible (and, in some cases, likely) that certain other properties pertinent to photocatalytic water splitting (e.g. charge transport, hydrophilicity, absorption intensity) will show a stronger dependence.From a computational high-throughput screening perspective, the observed low sensitivity to the sampling of conformational degrees of freedom implies that the effect of not finding the true lowest energy conformer on the predicted thermodynamic driving force for proton reduction and water oxidation, as well as on the on-set of light absorption, is only very minor. Hence a minimal conformer search will generally suffice when screening for polymeric photocatalysts. The same weak dependence of IP, EA and optical gap values probably also means that in contrast to chain length and order/disorder in the case of random co-polymers (see below) conformational degrees of freedom do not result in large batch-to-batch variations.
Sequence isomerism and (dis)order
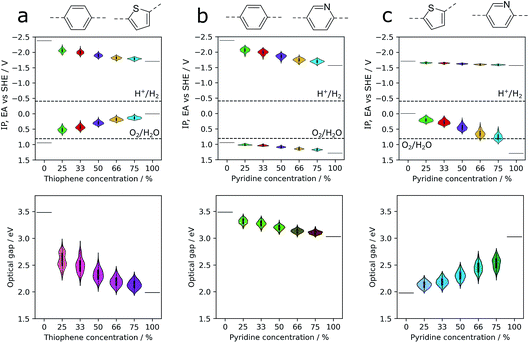
Co-polymers of a fixed overall composition can have a number of distinct sequence isomers, structures with the same overall composition but differing in how the co-monomers are distributed along the polymer chain, e.g. the alternating (AB)n and block AnBn isomers. Depending on the synthesis chemistry, either one well-defined sequence isomer or a random mixture is produced experimentally. Being able to predict the properties of one sequence-isomer relative to all others and/or those of a random-mixture is obviously attractive but computationally demanding because of the large number of possible sequence isomers. The calculations, discussed below in more detail, on all the sequence isomers of five different compositions of three potential co-polymer photocatalysts required on the order of 3500 single calculations, where a ‘single’ calculation involves the structural embedding, conformer search, structure optimisation and calculation of IP, EA and optical gap for each isomer. Hence without an efficient high-throughput procedure, like the one discussed here, this would be a computationally intractable task.Fig. 4 shows how distributions of properties of sequence isomers of phenylene–thiophene, phenylene–pyridine and pyridine–thiophene co-polymers vary with the co-polymer composition. For each co-monomer ratio, the properties of all combinatorially possible sequence isomers have been calculated, using a fixed oligomer length of 12 monomer units in total. Focussing in the first instance on the mean values of each of the properties (the white central dots in the centre of each of the violins in Fig. 4), we observe in the case of phenylene–thiophene co-polymers that, in line with our more limited sampling in previous work,9 increasing the thiophene content is predicted to result in progressively shallower IP, deeper EA (see Fig. 1) and lower optical gap values. For phenylene–pyridine co-polymers, increasing the pyridine content results in both deeper IP and deeper EA values, while optical gap values decrease as the fraction of pyridine is increased. When we apply the same analysis to co-polymers of pyridine and thiophene, we predict that, with increasing pyridine content, the IP values become deeper while the EA values remain largely unchanged and the optical gap increases. It should be noted that the change in the mean of a property distribution with composition can be strongly non-linear. For example, the change in the predicted mean optical gap when going from poly(phenylene) or poly(pyridine) to a co-polymer containing 25% thiophene is much larger than that predicted for going from a thiophene co-polymer containing 25% phenylene or pyridine to poly(thiophene).
Not surprisingly, the extent to which the mean IP, EA or optical gap values of the co-polymers change with composition appears to be linked to the difference in a given property between the corresponding homopolymers. When the difference is large the change in the mean value of that property with composition is also large for the corresponding co-polymer, see e.g. the change in optical gap value with composition for the phenylene–thiophene and pyridine–thiophene co-polymers. Conversely, when the difference in homopolymer properties is small the variation in the mean value of that property is also small, see e.g. the change with composition for the mean IP values of phenylene–pyridine and mean EA values of pyridine–thiophene co-polymers. More surprisingly, the difference in homopolymer properties also appears to control the overall variation in a given property for the different sequence isomers. For example, for phenylene–thiophene co-polymers, optical gap values can vary as much as 0.8 eV between different sequence isomers. In contrast, the small difference between the IP values of poly(phenylene) and poly(pyridine) leads to a variation of less than 0.1 V between sequence isomers of the corresponding co-polymer.
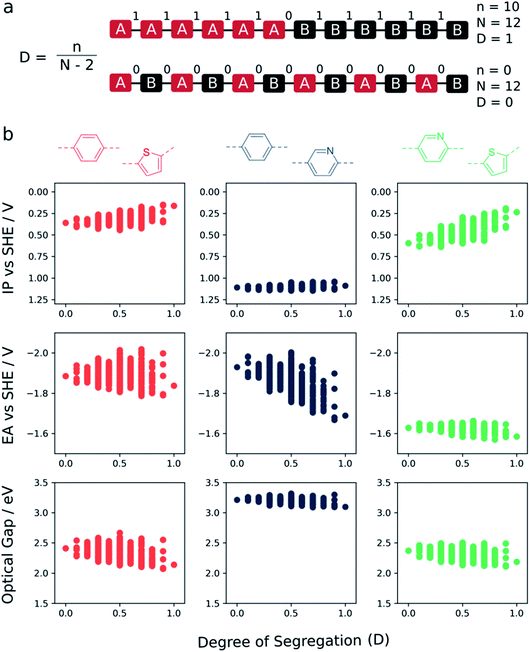
Fig. 5 shows how the ‘degree of segregation’ of co-monomers influences the overall co-polymer properties. Here we measure the ‘degree of segregation’ by considering the number of equivalent neighbouring monomeric units for a given sequence isomer. Specifically, this leads to a descriptor which lies between 0 (no identical neighbours, fully alternating) and 1 (only 2 monomers have a neighbour which is non-identical, fully segregated into a block of monomer A and a block of monomer B). For each property (IP, EA, and optical gap) we see that, when fully segregated, the properties of the co-polymer are most similar to those of the corresponding homopolymer with either the shallowest IP, deepest EA or lowest optical gap. Focussing in on the phenylene–thiophene system, finally, for which there is experimental data for (pseudo-)random 1![[thin space (1/6-em)]](https://www.rsc.org/images/entities/char_2009.gif) :
:![[thin space (1/6-em)]](https://www.rsc.org/images/entities/char_2009.gif) 1 co-polymers available in the literature,9 the fact that the perfectly alternating structure is predicted to have a larger optical gap than the mean value of the predicted optical gap distribution for this composition is in line with the fact that experimentally the (pseudo-)random materials have a smaller optical gap than their alternating counterpart.
1 co-polymers available in the literature,9 the fact that the perfectly alternating structure is predicted to have a larger optical gap than the mean value of the predicted optical gap distribution for this composition is in line with the fact that experimentally the (pseudo-)random materials have a smaller optical gap than their alternating counterpart.
In the context of photocatalytic water splitting, Fig. 4 and 5 make clear how the exact co-monomer sequence can influence the relevant properties of a co-polymer. Further, it illustrates how control over co-monomer sequence and hence the sequence isomer produced can be strongly beneficial, especially in terms of the optical gap, even if it cannot always be achieved experimentally.
Overall composition
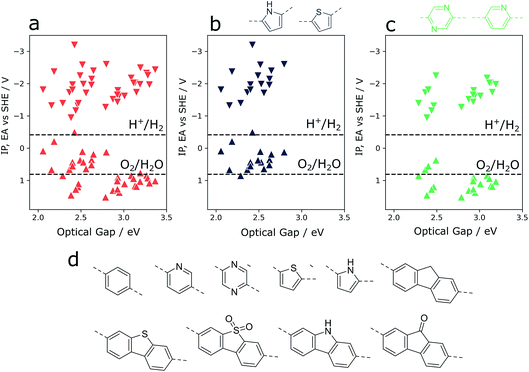
As an illustration of how our xTB semiempirical approach may be applied to exhaustively screen co-polymer compositions, a library of 10 simple monomer units was combined combinatorially to construct a library of 55 co-polymers (see Fig. 6). The monomer pool contains examples with significantly varying electronic properties, ranging from particularly electron-poor (e.g. pyridine, diazine) to electron-rich monomers (thiophene, pyrrole). Focussing in on co-polymers containing either thiophene or pyrrole (Fig. 6b), we observe that the incorporation of such electron-rich monomers is predicted to lead to co-polymers with inherently shallow IP and EA values. At the same time, the optical gap values of such materials are low compared to those of the total co-polymer population screened. While this latter property is conducive to water splitting applications – resulting in a greater rate of photon absorption – shallow IP values mean that the thermodynamic driving force for the oxidation of water and, to a lesser extent, sacrificial electron donors such as triethylamine, is largely absent. Conversely, co-polymers containing electron-poor monomeric units (pyridine, diazine, see Fig. 6d) are predicted to generally have deep(er) IPs – an attractive property for water oxidation – while retaining the necessary thermodynamic driving force for proton reduction. On the other hand, as a result of these significantly more positive IP potentials, many of these co-polymers also show the widest optical gaps of the overall co-polymer population. Essentially, these two extremes highlight the central challenge of optimising activity9,48 and high-throughput screening for water splitting photocatalysts – balancing the trade-off between adequate light absorption and thermodynamic reduction and oxidation driving forces. In this context, the high-throughput method described here provides a means of screening very large numbers of co-polymers – even beyond simple binary compositions – in a search for a material with an ideal balance between driving force and light absorption.Perspective
As demonstrated above using an xTB-based semi-empirical screening approach one can rapidly screen thousands to tens of thousands of (co-)polymers with an accuracy that is comparable to that which could be obtained using DFT. As such one can consider orders of magnitude more polymers than it is possible to screen experimentally, even using robotic synthesis and characterisation platforms. While not sufficient to sample even all possible binary co-polymers based on commercially available monomers, it does become possible, for example, to screen families of co-polymers that share a common monomer, and suggest the best hundred or so for experimental follow-up work – something we are currently actively pursuing together with our experimental collaborators. Studying larger search spaces probably still requires a transition from semi-empirical methods to a machine learning approach. Semi-empirical methods are still useful here in terms of generating the large amount of data required for training such models.The same considerations also apply when screening sequence isomers or conformers. As we have shown above, the former can be a useful tool to understand what could be achieved experimentally if one could control the exact polymer sequence. It can also be useful to understand the properties of true random co-polymers, especially if it could be combined with some weighting for how likely a particular sequence isomer is to form, e.g. by applying Boltzmann weighting using the GFN-xTB total energies.
Perhaps the biggest challenge will be to go beyond considering only IP, EA and optical gap values to also include, for example, transport properties, in the screening of overall composition space or sequence isomerism. While there is no fundamental constraint on doing so, and this indeed has been attempted before for hole transport in the context of polymers for organic photovoltaics,49 only intramolecular contributions to transport, which do not depend on knowing the intermolecular structure of materials, can be rapidly screened for. Related to this, if transport is indeed relevant it probably makes most sense to compare predictions for materials with experimentally similar particle sizes and hence similar path lengths for transport. Something that is probably difficult to realise in practice. Similar considerations also apply for other experimental variables, such as the concentration of intentionally-added metal co-catalyst and/or leftover noble metal content from polymer synthesis routes.
Conclusions
Besides successfully demonstrating the utility of our low-cost computational workflow for screening polymer photocatalysts, we also demonstrated that conformational degrees of freedom have little influence on optoelectronic properties of polymers that are pertinent to their photocatalytic activity. The ionisation potential and electron affinity of a polymer, which control the thermodynamic driving force for proton reduction and water oxidation, respectively, as well as the polymer’s optical gap are predicted to typically change by less than 0.1 (e)V in between low-energy conformers. We have also shown that sequence isomerism in (binary) co-polymers can lead to large variations in these properties between different sequence isomers. This is helpful in understanding the properties of random co-polymers relative to their ordered counterparts, as well as suggesting that synthetic control of the polymer sequence beyond simple alternating co-polymers might be beneficial in optimising a polymer’s photocatalytic activity. Finally, we found that, in line with what we knew from more limited previous work, introducing electron-rich co-monomers is predicted to consistently result in co-polymers with small optical gaps but low or negligible thermodynamic driving force for water oxidation, while introducing electron-poor co-monomers is predicted to have the opposite effect.Conflicts of interest
There are no conflicts to declare.Acknowledgements
We thank Catherine Aitchison, Yang Bai, Dr Enrico Berardo, Prof. Andrew I. Cooper, Dr Kim Jelfs, Dr Christian Meier, Dr Reiner Sebastian Sprick and Lucas Turcani for useful discussion. The UK Engineering and Physical Sciences Research Council (EPSRC) is acknowledged for funding (EP/N004884/1). I. H. A. thanks University College London for a PhD stipend.References
- A. Fujishima and K. Honda, Nature, 1972, 238, 37 CrossRef CAS PubMed.
- S. Yanagida, A. Kabumoto, K. Mizumoto, C. Pac and K. Yoshino, J. Chem. Soc., Chem. Commun., 1985, 474–475 RSC.
- T. Shibata, A. Kabumoto, T. Shiragami, O. Ishitani, C. Pac and S. Yanagida, J. Phys. Chem., 1990, 94, 2068–2076 CrossRef CAS.
- X. Wang, K. Maeda, A. Thomas, K. Takanabe, G. Xin, J. M. Carlsson, K. Domen and M. Antonietti, Nat. Mater., 2009, 8, 76–80 CrossRef CAS PubMed.
- Y. Sui, J. Liu, Y. Zhang, X. Tian and W. Chen, Nanoscale, 2013, 5, 9150–9155 RSC.
- J. Liu, Y. Liu, N. Liu, Y. Han, X. Zhang, H. Huang, Y. Lifshitz, S.-T. Lee, J. Zhong and Z. Kang, Science, 2015, 347, 970–974 CrossRef CAS PubMed.
- L. Lin, C. Wang, W. Ren, H. Ou, Y. Zhang and X. Wang, Chem. Sci., 2017, 8, 5506–5511 RSC.
- P. Bornoz, M. S. Prévot, X. Yu, N. Guijarro and K. Sivula, J. Am. Chem. Soc., 2015, 137, 15338–15341 CrossRef CAS PubMed.
- R. S. Sprick, C. M. Aitchison, E. Berardo, L. Turcani, L. Wilbraham, B. M. Alston, K. E. Jelfs, M. A. Zwijnenburg and A. I. Cooper, J. Mater. Chem. A, 2018, 6, 11994–12003 RSC.
- R. S. Sprick, B. Bonillo, R. Clowes, P. Guiglion, N. J. Brownbill, B. J. Slater, F. Blanc, M. A. Zwijnenburg, D. J. Adams and A. I. Cooper, Angew. Chem., Int. Ed., 2016, 55, 1792–1796 CrossRef CAS PubMed.
- D. J. Woods, R. S. Sprick, C. L. Smith, A. J. Cowan and A. I. Cooper, Adv. Energy Mater., 2017, 7, 1700479 CrossRef.
- C. Yang, B. C. Ma, L. Zhang, S. Lin, S. Ghasimi, K. Landfester, K. A. I. Zhang and X. Wang, Angew. Chem., Int. Ed., 2016, 55, 9202–9206 CrossRef CAS PubMed.
- X. Zong, X. Miao, S. Hua, L. An, X. Gao, W. Jiang, D. Qu, Z. Zhou, X. Liu and Z. Sun, Appl. Catal., B, 2017, 211, 98–105 CrossRef CAS.
- R. S. Sprick, L. Wilbraham, Y. Bai, P. Guiglion, A. Monti, R. Clowes, A. I. Cooper and M. A. Zwijnenburg, Chem. Mater., 2018, 30, 5733–5742 CrossRef CAS.
- Z. Zhang, J. Long, L. Yang, W. Chen, W. Dai, X. Fu and X. Wang, Chem. Sci., 2011, 2, 1826–1830 RSC.
- S. Chu, Y. Wang, Y. Guo, P. Zhou, H. Yu, L. Luo, F. Kong and Z. Zou, J. Mater. Chem., 2012, 22, 15519–15521 RSC.
- Z. A. Lan, Y. Fang, Y. Zhang and X. Wang, Angew. Chem., Int. Ed., 2018, 57, 470–474 CrossRef CAS PubMed.
- R. S. Sprick, J. X. Jiang, B. Bonillo, S. Ren, T. Ratvijitvech, P. Guiglion, M. A. Zwijnenburg, D. J. Adams and A. I. Cooper, J. Am. Chem. Soc., 2015, 137, 3265–3270 CrossRef CAS PubMed.
- J. Bi, W. Fang, L. Li, J. Wang, S. Liang, Y. He, M. Liu and L. Wu, Macromol. Rapid Commun., 2015, 36, 1799–1805 CrossRef CAS PubMed.
- K. Schwinghammer, S. Hug, M. B. Mesch, J. Senker and B. V. Lotsch, Energy Environ. Sci., 2015, 8, 3345–3353 RSC.
- R. S. Sprick, B. Bonillo, M. Sachs, R. Clowes, J. R. Durrant, D. J. Adams and A. I. Cooper, Chem. Commun., 2016, 52, 10008–10011 RSC.
- L. Li, W. Y. Lo, Z. Cai, N. Zhang and L. Yu, Macromolecules, 2016, 49, 6903–6909 CrossRef CAS.
- L. Li, Z. Cai, Q. Wu, W. Y. Lo, N. Zhang, L. X. Chen and L. Yu, J. Am. Chem. Soc., 2016, 138, 7681–7686 CrossRef CAS PubMed.
- C. B. Meier, R. S. Sprick, A. Monti, P. Guiglion, J. S. M. Lee, M. A. Zwijnenburg and A. I. Cooper, Polymer, 2017, 126, 283–290 CrossRef CAS.
- S. Kuecken, A. Acharjya, L. Zhi, M. Schwarze, R. Schomäcker and A. Thomas, Chem. Commun., 2017, 53, 5854–5857 RSC.
- L. Stegbauer, K. Schwinghammer and B. V. Lotsch, Chem. Sci., 2014, 5, 2789–2793 RSC.
- V. S. Vyas, F. Haase, L. Stegbauer, G. Savasci, F. Podjaski, C. Ochsenfeld and B. V. Lotsch, Nat. Commun., 2015, 6, 8508 CrossRef CAS PubMed.
- P. Pachfule, A. Acharjya, J. Roeser, T. Langenhahn, M. Schwarze, R. Schomäcker, A. Thomas and J. Schmidt, J. Am. Chem. Soc., 2018, 140, 1423–1427 CrossRef CAS PubMed.
- X. Wang, L. Chen, S. Y. Chong, M. A. Little, Y. Wu, W.-H. Zhu, R. Clowes, Y. Yan, M. A. Zwijnenburg, R. Sebastian Sprick and A. I. Cooper, Nat. Chem., 2018, 10, 1180–1189 CrossRef CAS PubMed.
- P. Guiglion, C. Butchosa and M. A. Zwijnenburg, J. Mater. Chem. A, 2014, 2, 11996–12004 RSC.
- C. Butchosa, P. Guiglion and M. A. Zwijnenburg, J. Phys. Chem. C, 2014, 118, 24833–24842 CrossRef CAS.
- P. Guiglion, A. Monti and M. A. Zwijnenburg, J. Phys. Chem. C, 2017, 121, 1498–1506 CrossRef CAS.
- L. Wilbraham, E. Berardo, L. Turcani, K. E. Jelfs and M. A. Zwijnenburg, J. Chem. Inf. Model., 2018, 28, 2450–2459 CrossRef PubMed.
- S. Grimme, C. Bannwarth and P. Shushkov, J. Chem. Theory Comput., 2017, 13, 1989–2009 CrossRef CAS PubMed.
- S. Grimme and C. Bannwarth, J. Chem. Phys., 2016, 145, 054103 CrossRef PubMed.
- V. Ásgeirsson, C. A. Bauer and S. Grimme, Chem. Sci., 2017, 8, 4879–4895 RSC.
- D. Weininger, J. Chem. Inf. Comput. Sci., 1988, 28, 31–36 CrossRef CAS.
- L. Turcani, E. Berardo and K. E. Jelfs, J. Comput. Chem., 2018, 39, 1931–1942 CrossRef CAS PubMed.
- Supramolecular-toolkit, https://github.com/supramolecular-toolkit/stk, accessed 30 October, 2018 Search PubMed.
- The RDKit Documentation, http://www.rdkit.org/docs/, accessed 30 October, 2018 Search PubMed.
- S. Riniker and G. A. Landrum, J. Chem. Inf. Model., 2015, 55, 2562–2574 CrossRef CAS PubMed.
- T. A. Halgren, J. Comput. Chem., 1996, 17, 490–519 CrossRef CAS.
- C. Bannwarth and S. Grimme, Comput. Theor. Chem., 2014, 1040–1041, 45–53 CrossRef CAS.
- xtb – An extended tight-binding semi-empirical program package, https://www.chemie.uni-bonn.de/pctc/mulliken-center/software/xtb/xtb, accessed 30 October, 2018 Search PubMed.
- sTDA – A simplified Tamm-Dancoff density functional approach for electronic excitation spectra, https://www.chemie.uni-bonn.de/pctc/mulliken-center/software/stda/stda, accessed 30 October 2018.
- Sequence-generator, https://github.com/ZwijnenburgGroup/sequence-generator, accessed 6 November 2018.
- N. E. Jackson, B. M. Savoie, K. L. Kohlstedt, T. J. Marks, L. X. Chen and M. A. Ratner, Macromolecules, 2014, 47, 987–992 CrossRef CAS.
- P. Guiglion, C. Butchosa and M. A. Zwijnenburg, Macromol. Chem. Phys., 2016, 217, 344–353 CrossRef CAS.
- N. M. O’Boyle, C. M. Campbell and G. R. Hutchison, J. Phys. Chem. C, 2011, 115, 16200–16210 CrossRef.
Footnote |
| † Electronic supplementary information (ESI) available. See DOI: 10.1039/c8fd00171e |
| This journal is © The Royal Society of Chemistry 2019 |

