Blue and red wavelength resolved impedance response of efficient perovskite solar cells†
Daniel
Prochowicz
a,
Mohammad Mahdi
Tavakoli
 bc,
Silver-Hamill
Turren-Cruz
 d,
Kavita
Pandey
e,
Michael
Saliba
 *d and
Pankaj
Yadav
 *f
*f
aInstitute of Physical Chemistry, Polish Academy of Sciences, Kasprzaka 44/52, 01-224 Warsaw, Poland
bDepartment of Electrical Engineering and Computer Science, Massachusetts Institute of Technology, Cambridge, MA 02139, USA
cDepartment of Materials Science and Engineering, Sharif University of Technology, 14588 Tehran, Iran
dAdolphe Merkle Institute, Chemins des Verdiers 4, CH-1700 Fribourg, Switzerland. E-mail: michael.saliba@unifr.ch
eInorganic Chemistry Laboratory, Department of Chemistry, University of Oxford, South Parks Road, Oxford OX1 3QR, UK
fDepartment of Solar Energy, School of Technology, Pandit Deendayal Petroleum University, Gandhinagar-382 007, Gujarat, India. E-mail: Pankaj.yadav@sse.pdpu.ac.in; pankajphd11@gmail.com
First published on 6th August 2018
Abstract
The identification of recombination centers in perovskite solar cells is highly challenging. Here, we demonstrate the red and blue excitation wavelength resolved impedance response in state-of-the-art perovskite solar cells (PSCs) providing insights into charge recombination and ion accumulation. To get insight into the interfacial electronic characteristics, we fabricated PSCs with a planar architecture containing state-of-the-art triple-cation perovskite materials as absorber layers. The capacitance–frequency response under various blue and red illumination conditions were used to investigate interfacial charge accumulations and found that under high energy photons irradiation maximum charge or ion accumulations at interface (ETL/perovskite) take place. Ideality factor of PSCs was also calculated from the obtained value of high frequency resistance equaling 2.1 and 1.8 for devices measured under blue and red excitation wavelength, respectively. Our study illustrates that EIS measurements at different excitation wavelengths, reveals information about charge or ion accumulation and also provides a tool to diagnose PSCs in a more localized way.
Introduction
Organic–inorganic halide perovskite semiconductor materials have attracted significant attention because of their wide absorption band, outstanding charge carrier mobility, and high diffusion length.1–3 These properties enabled spectacular advancement for perovskite solar cells (PSCs) with certified power conversion efficiencies (PCEs) exceeding 22%.4 Thus, there has been a particular focus on optimizing the perovskite composition,5,6 morphology7 and crystallization process of the absorber layer.8 However, the understanding of the processes occurring at the interfaces is becoming more and more important for further improvements.9 A typical PSC consists of a perovskite film sandwiched between an electron transport layer (ETL) and a hole transport layer (HTL) forming an ETL/perovskite and perovskite/HTL stack. Interfaces play a crucial role in determining the photovoltaic performance, device stability and hysteresis of PSCs.10 The latter effect is observed during current–voltage (J–V) measurements of PSCs and is attributed to the charge accumulation at the interface of the perovskite thin film, ion migration or ferroelectric polarization.11–13 The hysteresis depends also on the nature of charge selective contacts, scan rate, poling conditions and on the wavelength of the illumination.14–17 Recent work demonstrated that PSCs exhibit a higher hysteresis index when exposed to more energetic, blue wavelengths as compared to near band edge red wavelengths.18 This phenomenon was attributed to the thermally assisted generation of additional vacancies or ion movements.In this work, shedding more light on these observations, we report on the influence of red and blue excitation on PSCs characteristics using electrochemical impedance spectroscopical (EIS) analysis. To study the interfacial electronic characteristics, we fabricated PSCs with a planar architecture containing state-of-the-art triple-cation perovskite materials as absorber layers. Next, the capacitance–frequency analyses under blue and red illumination conditions were used to investigate interfacial charge accumulations. Our study illustrates that EIS measurements at different excitation wavelengths, reveals information about charge or ion accumulation and also provides a tool to diagnose PSCs in a more localized way.
Results and discussions
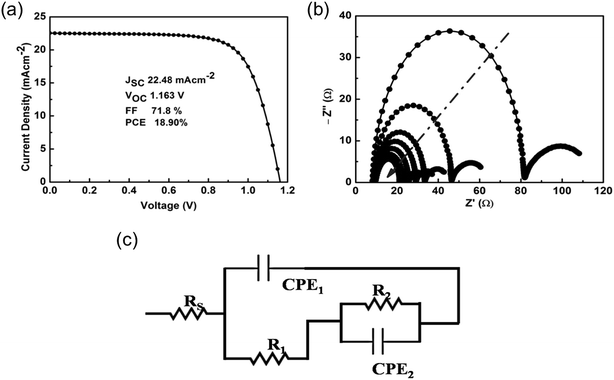
To understand the effect of different excitation wavelength on PSCs, we used the mixed-halide and mixed-cation formulation Cs5(MA0.17FA0.83)95Pb(I0.83Br0.17)3 (ref. 19 and 20) as a perovskite absorber layer sandwiched between a compact TiO2 electron transport layer (ETL) and spiro-OMeTAD as hole transport layer (HTL); see the Experimental section in the ESI† for full details. Fig. S1† shows the absorption and luminescence spectra for the resulted triple-cation thin film, which are consistent with the previously reported by Saliba et al.19 The current–voltage (J–V) characteristic of best performing device measured under 1 Sun illumination (Air Mass 1.5G) at 25 °C is shown in Fig. 1a. The device exhibits a PCE of 18.9% with an open-circuit voltage (Voc) of 1.16 V, short-circuit current (Jsc) of 22.48 mA cm−2 and a fill factor (FF) of 71.8%. A set of 5 devices with an average PCE of 18.5 ± 0.5% was used for electrical characterizations under different test conditions of light intensities and light excitation wavelengths using impedance spectroscopy. J–V measurements measured under forward and reverse scan direction at blue and red wavelength is shown in Fig. S2.†EIS spectra of PSCs were measured as a function of applied bias (0–1.1 V) in the frequency range of 100 kHz to 200 mHz with a perturbation voltage of 20 mV under blue and red light illuminations. Fig. 1b shows the typical EIS spectra as measured under white light as a function of light intensity (50 to 100 mW cm−2). The EIS spectra show two relaxation time with a transition frequency of 320 to 335 Hz range. We observed a decrease in the semicircle arc (for low and high frequency), with increase in illumination intensity. The resistive and capacitive elements associated with the bulk and interfaces of the device are obtained by the theoretical fitting of experimental data using electrical equivalent circuit as shown in Fig. 1c.21 The electrical circuit consists of series resistance (Rs), due to gold and FTO contacts. The high frequency spectra are fitted by R1 and constant phase element CPE1. The R1 can define the leakage current resistance in low forward bias, whereas it can also give information of recombination phenomena in case if it can satisfy the bias dependence criteria, generally found at high forward bias.21 CPE1 is due to the geometrical capacitance of PSCs. The low frequency spectra are fitted by R2 and CPE2, which are defined as recombination resistance and accumulation capacitance due to ions or charge accumulation processes, respectively. The CPE element is defined as ZCPE = Q/(jW)n where w is angular frequency, n is the exponent having a value in between 0 to 1.
In literature various electronic equivalent circuits were proposed over time with several modifications.17,21 These modifications were justified in literature by an improved understanding of the perovskite material itself and a better understanding of the general device physics. We found that the EIS measurements under illumination are more close to the finding of our J–V characteristics.
Capacitive elements and hysteresis in PSCs
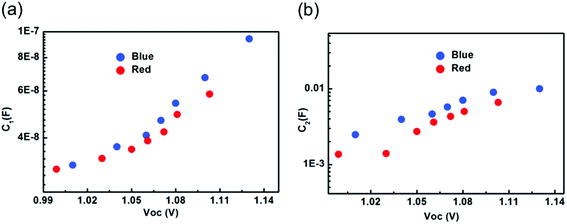
The capacitance corresponding to the high frequency spectra measured under blue and red light illumination was extracted from obtained Nyquist spectra (Fig. S3†) and shown in Fig. 2a. In both cases, the exponent n is close to 1. We found that illumination intensity and the kind of excitation wavelength have no significant impact on the magnitudes of the high frequency capacitance, which corresponds to geometrical capacitance. The geometrical capacitance is expressed as C = εoεrS/d, where εo is vacuum permittivity, εr is relative permittivity of perovskite absorber material, d is perovskite absorber layer thickness and S the cell surface area. Using the obtained value of C1 a value of εr = 32 is found. The dependence of high frequency capacitance on illumination intensity for mixed halide based solar cells was discussed by Wang et al.22 It is in agreement with the findings obtained for multi-cation perovskite absorber layers. This can suggest that the behavior of high frequency capacitance with illumination is independent of the nature of cations or halides but the magnitude may depend upon the cation or halides. | ||
| Fig. 2 The capacitance corresponding to (a) high frequency spectra and (b) low frequency spectra, measured under blue and red light illumination extracted from the Nyquist spectra. | ||
The low frequency constant phase element CPE2 measured under blue and red light at various intensities was used to extract capacitance C2, shown in Fig. 2b. The exponent n for fitting was calculated at 0.55–0.6. The capacitance values extracted from the low frequency arc are much higher in magnitude as compared to the capacitance values extracted from the high frequency arc due to the different source of origin.23 The values of C2 measured for blue and red light exhibit the same illumination dependence and increase with an increase in illumination intensity. However, the measured C2 under blue excitation wavelength is higher in magnitude as compared to red light illumination. We posit that this difference can be explained with the increased maximum absorption at the surface of perovskite absorber layer for blue light. This could lead to maximum charge or ion accumulations at interface (ETL/perovskite) and could also form the additional ion defects. The strong accumulation of electronic charges or ions under blue light drives the higher value of C2 that could lead to high discharge time. In contrast, red light is absorbed rather in the bulk of the perovskite, causing a more balanced ion and charge carrier distribution specifically in the bulk. Therefore, PSCs subjected to different excitation wavelengths not only informs about charge or ion accumulation, but can also provide a tool to diagnose the PSCs in a more localized way.
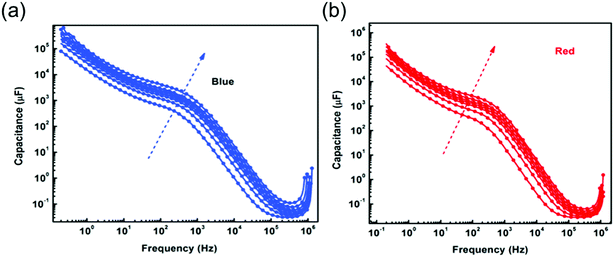
In our previous work, we demonstrated that PSCs subjected to red wavelength exhibit a lower hysteresis, while maximum hysteresis is observed under blue light illumination.18 A correlation between charge accumulations at interfaces (TiO2/perovskite) to the observed hysteresis index was reported previously.24 To further explore the observed hysteresis behaviour of devices subjected to different excitation wavelength, capacitance vs. frequency as a function of illumination at zero bias was measured (Fig. 3a). We found that under low illumination intensity the net capacitance values for both the wavelength are almost similar and equal (∼4–5 μF). However, with increased illumination, the low frequency capacitance value attains a maximum value under blue illumination. The capacitance at high frequency (above 103 Hz) shows almost wavelength independent behaviour. This means that higher energy photons activate ions or ionic defects.
Resistance and recombination in PSCs
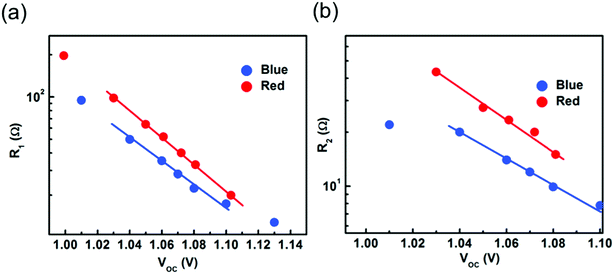
The high frequency resistance R1 is extracted by fitting the obtained Nyquist spectra by using an electrical equivalent circuit and plotted as a function of illumination induced Voc measured under blue and red wavelengths (Fig. 4a). A decrease in the values of R1 with illumination intensity is observed for both the wavelengths but with a different rate. A lower value of R1 is observed when device is subjected to blue illumination. A lower value can be expected from the higher accumulation of electronic charges or ions at interface or absorber layer. A similar behaviour of R1 with change in illumination intensity was previously observed by Wang et al.23 The exponential trend of R1 with illumination and voltage is described using the expression R = R0![[thin space (1/6-em)]](https://www.rsc.org/images/entities/char_2009.gif) exp(−qV/mKBT), where R0 is pre-exponential factor, q is electron charge, KB is the Boltzmann constant, m is the ideality factor, and T is the temperature. Using the above expression and the data in Fig. 4a, it is possible to identify the origin of recombination phenomena: for m = 1 band to band recombination mainly dominates; for m = 1.5 bulk recombination dominates; and for m = 2 recombination at space charge regions close to surface mainly dominates.25,26 An m value of 2.1 (blue) and 1.8 (red) was observed. This indicates that surface recombination mainly dominates in both the devices. However, the device exposed to blue illumination exhibits a higher m value suggesting that the high photons are absorbed near to surface and enhanced the recombination processes in PSCs. We believe that under high energy photons, the movable defects – like iodine vacancy – create recombination centers.
exp(−qV/mKBT), where R0 is pre-exponential factor, q is electron charge, KB is the Boltzmann constant, m is the ideality factor, and T is the temperature. Using the above expression and the data in Fig. 4a, it is possible to identify the origin of recombination phenomena: for m = 1 band to band recombination mainly dominates; for m = 1.5 bulk recombination dominates; and for m = 2 recombination at space charge regions close to surface mainly dominates.25,26 An m value of 2.1 (blue) and 1.8 (red) was observed. This indicates that surface recombination mainly dominates in both the devices. However, the device exposed to blue illumination exhibits a higher m value suggesting that the high photons are absorbed near to surface and enhanced the recombination processes in PSCs. We believe that under high energy photons, the movable defects – like iodine vacancy – create recombination centers.
 | ||
| Fig. 4 (a) The high frequency resistance and (b) the low frequency resistance, extracted by fitting the obtained Nyquist spectra as a function of illumination level for both blue and red light. | ||
The low frequency resistance R2 is extracted from the obtained Nyquist spectra using the electrical equivalent circuit and plotted as a function of illumination-induced Voc measured under blue and red wavelengths (Fig. 4b). Fig. 4b shows that with the increase in illumination level the value of R2 decreases. A similar behavior of low frequency resistance measured at Voc was observed by Zarazúa et al.27 The absolute magnitude of R2 is also termed as recombination resistance. A lower value of R2 was obtained for device exposed to blue light showing higher recombination. We note that the obtained recombination resistance and ideality factor values have no dependence on the microstructural property of absorber layer as all the analysis were performed on the same device. The time scale associated with the high and low frequency spectra are calculated and shown in Fig. S4a.† The high frequency time scale was obtained from the summation of the high frequency associated resistance and capacitance, i.e. R1 and C1. Device measured under blue light shows a high frequency time constant in a 3 to 1.2 μs range, whereas device measured under red light shows a time constant between 6 to 2 μs. The time scale associated with the low frequency is calculated from the summation of the low frequency resistance and capacitance, i.e. R2 and C2. Fig. S4b† shows the low frequency relaxation time, which lies in the second range measured under blue and red wavelength. In literature, the large time scale was attributed to the ionic movement, which occurs in a time scale of a few milliseconds to minutes.28 Surprisingly, we found that under blue wavelength excitation a higher time constant is observed and that may stem from the significantly lower value of the low frequency resistance and not from the ion accumulation. It is expected that the high energy wavelength leads to the formation of higher phonon modes, which enhances the ionic movement. Moreover, the enhanced ionic movement along with observed low frequency capacitance under blue illumination is well correlated with the hysteresis in PSCs.
The PSCs under the influence of the illumination was also studied by Zarazúa et al. and found that low-frequency capacitance increases proportional to the incident light intensity and charge accumulation at PSCs can easily monitored by low frequency capacitance.29 In the present study we also observed the same phenomena. However, under the influence of the wavelength it is possible to distinguish the interface and bulk capacitance that could help in further designing of efficient solar cells.
Conclusions
In this work, we have systematically studied the wavelength resolved impedance response of efficient PSCs. Impedance response of PSCs under different wavelengths of blue and red light was measured and fitted with the electrical equivalent circuit in order to define the working mechanism of devices. Under the influence of illumination intensity, a significant impact on the magnitudes of the high frequency capacitance was observed. However, a significant difference is observed in extracted low frequency capacitance. The ideality factor of PSCs was calculated from the obtained value of high frequency resistance equaling 2.1 and 1.8 for devices measured under blue and red excitation wavelength, respectively. This work also highlights that PSCs subjected to different excitation wavelengths not only depicts the charge or ion accumulations, but can also provide a tool to diagnose the PSCs in a more localized way, which could be beneficial for further PSCs optimization and analysis.Conflicts of interest
There are no conflicts to declare.References
- Q. Dong, Y. Fang, Y. Shao, P. Mulligan, J. Qiu, L. Cao and J. Huang, Science, 2015, 347, 967–970 CrossRef PubMed.
- S. D. Stranks, G. E. Eperon, G. Grancini, C. Menelaou, M. J. P. Alcocer, T. Leijtens, L. M. Herz, A. Petrozza and H. J. Snaith, Science, 2013, 342, 341–344 CrossRef PubMed.
- D. Shi, V. Adinolfi, R. Comin, M. Yuan, E. Alarousu, A. Buin, Y. Chen, S. Hoogland, A. Rothenberger, K. Katsiev, Y. Losovyj, X. Zhang, P. A. Dowben, O. F. Mohammed, E. H. Sargent and O. M. Bakr, Science, 2015, 347, 519–522 CrossRef PubMed.
- W. S. Yang, B.-W. Park, E. H. Jung, N. J. Jeon, Y. C. Kim, D. U. Lee, S. S. Shin, J. Seo, E. K. Kim, J. H. Noh and S. I. Seok, Science, 2017, 356, 1376–1379 CrossRef PubMed.
- S. I. Seok, M. Grätzel and N.-G. Park, Small, 2018, 1704177 CrossRef PubMed.
- D. Prochowicz, P. Yadav, M. Saliba, D. J. Kubicki, M. M. Tavakoli, S. M. Zakeeruddin, J. Lewiński, L. Emsley and M. Grätzel, Nano Energy, 2018, 49, 523–528 CrossRef.
- T.-B. Song, Q. Chen, H. Zhou, C. Jiang, H.-H. Wang, Y. Michael Yang, Y. Liu, J. You and Y. Yang, J. Mater. Chem. A, 2015, 3, 9032–9050 RSC.
- J. Liu, C. Gao, X. He, Q. Ye, L. Ouyang, D. Zhuang, C. Liao, J. Mei and W. Lau, ACS Appl. Mater. Interfaces, 2015, 7, 24008–24015 CrossRef PubMed.
- J. Shi, X. Xu, D. Li and Q. Meng, Small, 2015, 11, 2472–2486 CrossRef PubMed.
- Y. Bai, X. Meng and S. Yang, Adv. Energy Mater., 2018, 8, 1701883 CrossRef.
- B. Wu, K. Fu, N. Yantara, G. Xing, S. Sun, T. C. Sum and N. Mathews, Adv. Energy Mater., 2015, 5, 1500829 CrossRef.
- C. Li, S. Tscheuschner, F. Paulus, P. E. Hopkinson, J. Kießling, A. Köhler, Y. Vaynzof and S. Huettner, Adv. Mater., 2016, 28, 2446–2454 CrossRef PubMed.
- Y. Shao, Z. Xiao, C. Bi, Y. Yuan and J. Huang, Nat. Commun., 2015, 5, 5784 CrossRef PubMed.
- W. Tress, N. Marinova, T. Moehl, S. M. Zakeeruddin, M. K. Nazeeruddin and M. Grätzel, Energy Environ. Sci., 2015, 8, 995–1004 RSC.
- E. L. Unger, E. T. Hoke, C. D. Bailie, W. H. Nguyen, A. R. Bowring, T. Heumüller, M. G. Christoforo and M. D. McGehee, Energy Environ. Sci., 2014, 7, 3690–3698 RSC.
- G. Richardson, S. E. J. O'Kane, R. G. Niemann, T. A. Peltola, J. M. Foster, P. J. Cameron and A. B. Walker, Energy Environ. Sci., 2016, 9, 1476–1485 RSC.
- P. Yadav, S. H. Turren Cruz, D. Prochowicz, M. M. Tavakoli, K. Pandey, S. M. Zakeeruddin, M. Grätzel, A. Hagfeldt and M. Saliba, J. Phys. Chem. C, 2018, 122(27), 15149–15154 CrossRef.
- M. Pazoki, T. J. Jacobsson, S. H. T. Cruz, M. B. Johansson, R. Imani, J. Kullgren, A. Hagfeldt, E. M. J. Johansson, T. Edvinsson and G. Boschloo, J. Phys. Chem. C, 2017, 121, 26180–26187 CrossRef.
- M. Saliba, T. Matsui, J.-Y. Seo, K. Domanski, J.-P. Correa-Baena, M. K. Nazeeruddin, S. M. Zakeeruddin, W. Tress, A. Abate, A. Hagfeldt and M. Grätzel, Energy Environ. Sci., 2016, 9, 1989–1997 RSC.
- E. H. Anaraki, A. Kermanpur, L. Steier, K. Domanski, T. Matsui, W. Tress, M. Saliba, A. Abate, M. Grätzel, A. Hagfeldt and J.-P. Correa-Baena, Energy Environ. Sci., 2016, 9, 3128–3134 RSC.
- M. M. Tavakoli, P. Yadav, R. Tavakoli and J. Kong, Adv. Energy Mater., 2018, 1800794 CrossRef.
- Q. Wang, J. Phys. Chem. C, 2018, 122, 4822–4827 CrossRef.
- P. Wang, M. Ulfa and T. Pauporté, J. Phys. Chem. C, 2018, 122, 1973–1981 CrossRef.
- D.-Y. Son, S.-G. Kim, J.-Y. Seo, S.-H. Lee, H. Shin, D. Lee and N.-G. Park, J. Am. Chem. Soc., 2018, 140, 1358–1364 CrossRef PubMed.
- P. Yadav, M. H. Alotaibi, N. Arora, M. I. Dar, S. M. Zakeeruddin and M. Grätzel, Adv. Funct. Mater., 2018, 28, 1706073 CrossRef.
- P. Yadav, M. I. Dar, N. Arora, E. A. Alharbi, F. Giordano, S. M. Zakeeruddin and M. Grätzel, Adv. Mater., 2017, 29, 1701077 CrossRef PubMed.
- I. Zarazúa, S. Sidhik, T. Lopéz-Luke, D. Esparza, E. De la Rosa, J. Reyes-Gomez, I. Mora-Seró and G. Garcia-Belmonte, J. Phys. Chem. Lett., 2017, 8, 6073–6079 CrossRef PubMed.
- A. Pockett, G. E. Eperon, N. Sakai, H. J. Snaith, L. M. Peter and P. J. Cameron, Phys. Chem. Chem. Phys., 2017, 19, 5959–5970 RSC.
- I. Zarazua, J. Bisquert and G. G. Belmonte, J. Phys. Chem. Lett., 2016, 7(3), 525–528 CrossRef PubMed.
Footnote |
| † Electronic supplementary information (ESI) available. See DOI: 10.1039/c8se00280k |
| This journal is © The Royal Society of Chemistry 2018 |


