 Open Access Article
Ab initio prediction of the polymorph phase diagram for crystalline methanol†
Ctirad
Červinka
 a and
Gregory J. O.
Beran
 *b
*b
aDepartment of Physical Chemistry, University of Chemistry and Technology Prague, Technická 5, CZ-16628 Prague 6, Czech Republic. E-mail: cervinkc@vscht.cz
bDepartment of Chemistry, University of California, Riverside, California 92521, USA. E-mail: gregory.beran@ucr.edu
First published on 16th April 2018
Abstract
Organic crystals frequently adopt multiple distinct polymorphs exhibiting different properties. The ability to predict not only what crystal forms might occur, but under what experimental thermodynamic conditions those polymorphs are stable would be immensely valuable to the pharmaceutical industry and others. Starting only from knowledge of the experimental crystal structures, this study successfully predicts the methanol crystal polymorph phase diagram from first-principles quantum chemistry, mapping out the thermodynamic regions of stability for three polymorphs over the range 0–400 K and 0–6 GPa. The agreement between the predicted and experimental phase diagrams corresponds to predicting the relative polymorph free energies to within ∼0.5 kJ mol−1 accuracy, which is achieved by employing fragment-based second-order Møller–Plesset perturbation theory and coupled cluster theory plus a quasi-harmonic treatment of the phonons.
1 Introduction
Organic molecules can often pack in multiple distinct crystalline structures, or polymorphs, with sometimes substantial variations in physical properties. Given the need to identify pharmaceutical polymorphs with improved solubility or organic semiconductor materials with high carrier mobilities, for example, and the high cost of performing experimental solid-state screening, much research has focused on computational crystal structure prediction.1 While substantial progress in predicting possible crystal structures and their properties from first principles has been made,2–10 as evidenced by the recent blind tests of crystal structure prediction,11–13 actually predicting the thermodynamic conditions under which those polymorphs can be produced experimentally remains a tremendous challenge.14 Even small changes in the polymorph free energies can completely alter the predicted phase boundaries. The present study reports a large step forward by accurately predicting the phase diagram for three polymorphs of methanol over a range of 0–400 K and 0–6 GPa with ∼0.5 kJ mol−1 accuracy.Whereas computational chemistry often strives for “chemical accuracy” of 1 kcal mol−1, organic polymorphs are often separated by 1–2 kJ mol−1 or less in the Gibbs free energies,15,16 and those free energies can exhibit considerable dependence on temperature and pressure. Successful organic polymorph phase diagram prediction requires sub-kJ mol−1 accuracy. Such accuracy has been achieved for the benzene lattice energy at 0 K,17 but accomplishing the same for the polymorph free energies across a range of temperatures and pressures is even harder.
While one can sometimes predict high-pressure phase transitions from enthalpy alone, predicting phase boundaries at low pressures requires modeling how the phonons and thermal expansion of the crystal impact the Gibbs free energy. First-principles phase diagram predictions are relatively common in inorganic materials,21,22 where rigid structures and dense crystal packing can simplify the free energy landscapes, but they are rarer for organic crystals. Most organic polymorph phase predictions have focused on transitions occurring at a specific temperature/pressure using a hamonic model,15,23 the quasi-harmonic approximation,16,24,25 or molecular dynamics.26–29 Complete phase diagram predictions have been most successful at high pressures30 or when using empirically fitted potentials.31,32
Methanol is one of the simplest organic molecules, but the occurrence of several phases over a relatively narrow range of temperatures and pressures, substantial variations in molar volume (∼22–36 cm3 mol−1) across these thermodynamic conditions, and strong cooperative hydrogen bonding effects make its phase diagram challenging to predict. Four crystalline phases of methanol have been reported (Fig. 1 and 2a). The orthorhombic α phase (P212121)33 occurs at low temperatures up to medium pressures. The disordered orthorhombic β phase (Cmc21)33 occurs at higher temperatures, while the triclinic γ phase (P![[1 with combining macron]](https://www.rsc.org/images/entities/char_0031_0304.gif) )34 is stable at higher pressures and ambient temperatures. A high-pressure, low-temperature δ phase was recently reported,20 but its structure remains unknown.
)34 is stable at higher pressures and ambient temperatures. A high-pressure, low-temperature δ phase was recently reported,20 but its structure remains unknown.
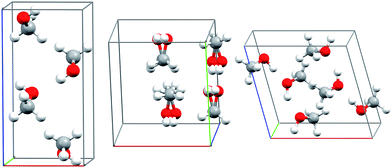 | ||
| Fig. 1 Experimental crystal structures for the α (left), disordered β (middle), and γ (right) polymorphs of methanol. | ||
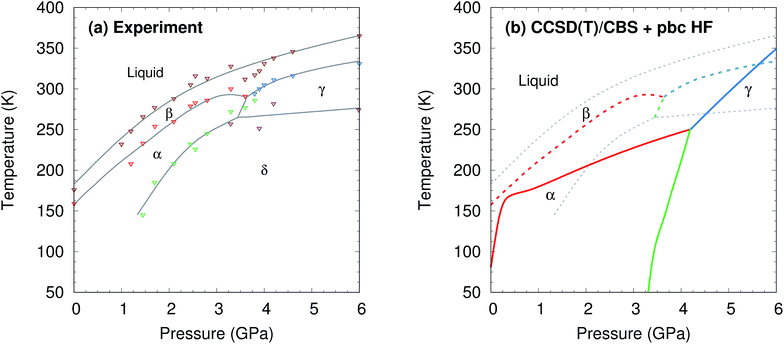 | ||
| Fig. 2 (a) Experimental phase diagram of methanol.18–20 See Section S1† for details. (b) Predicted phase diagram (solid lines) superimposed over the experimental one (dashed lines). | ||
The successful phase diagram prediction here is accomplished using fragment-based electronic structure methods coupled to a quasi-harmonic treatment35,36 of the Helmholtz vibrational free energy and thermal expansion. Specifically, the hybrid many-body interaction (HMBI) model partitions the crystal into molecules.37 The molecules and their short-range pairwise intermolecular interactions are computed quantum mechanically, while the long-range dimer and strong many-body interactions in methanol are approximated either with the AMOEBA polarizable force field38 or periodic Hartree–Fock (HF). Fragmenting allows the use of high-level electronic structure for the important monomer and dimer fragments, and lattice polarization effects are captured through the many-body treatment. The ability to converge crystal energetics with respect to the level of theory can be essential for resolving small polymorph energy differences.7,39 Quasi-harmonic fragment models can predict structural, thermochemical, and other molecular crystal properties in good agreement with experiment.25,40–43
2 Results and discussion
To predict the phase diagram, electronic energy versus volume curves were mapped out for the three polymorphs with known structures, starting from the experimental geometries and optimizing with the second-order Møller–Plesset perturbation theory (MP2) + AMOEBA level of theory (see Computational methods for details). For the disordered β form, the structure was taken as the average of the two possible methanol orientations. The energies along these curves were refined at the complete basis set coupled cluster singles, doubles and perturbative triples (CCSD(T)/CBS) + periodic HF level of theory. Gibbs free energy profiles were constructed by combining these curves with Helmholtz vibrational free energies from harmonic Γ-point phonon frequencies, as described in Section S2.†The calculations reproduce various experimental structural and thermochemical data well, as shown in Table 1 and Sections S3 and S4.† For example, they predict an α-phase 0 K sublimation enthalpy of 45.0 kJ mol−1, versus 45.7 ± 0.3 kJ mol−1 experimentally.44 That value improves upon earlier predictions by up to several kJ mol−1.42,45,46 The predicted change in enthalpy associated with the α → β transition at 157 K and ambient pressure is 0.41 kJ mol−1, versus 0.64 kJ mol−1 experimentally.47 The experimentally observed decrease in the isobaric heat capacity across the α–β phase transition47 is reproduced qualitatively, though the heat capacities themselves are underestimated by 10–20% (Fig. 3). The underestimation of the heat capacity likely stems from a mixture of overestimation of the lattice mode phonon frequencies, the neglect of anharmonicity in the intramolecular modes (particularly methyl rotations), and underestimation of the thermal expansivity.42
| Parameter | Experiment | Electronic CCSD(T)/CBS | Quasi-harmonic CCSD(T)/CBS |
|---|---|---|---|
| a METHOL04, ref. 33. b Ref. 44. c METHOL05, ref. 33. d METHOL03, ref. 34. | |||
| α-Methanol (Z = 4, P2 1 2 1 2 1 , 122 K) | |||
| V (Å3) | 207.04 | 191.80 | 208.26 |
| a (Å) | 4.65 | 4.50 | 4.55 |
| b (Å) | 4.93 | 4.80 | 5.00 |
| c (Å) | 9.04 | 8.88 | 9.15 |
| E lat (kJ mol−1) | — | 51.66 | 51.33 |
| ΔHsub (0 K) (kJ mol−1) | 45.7 ± 0.3b | 44.70 | 44.95 |
![[thin space (1/6-em)]](https://www.rsc.org/images/entities/char_2009.gif) |
|||
| β-Methanol (Z = 4, Cmc2 1 , 160 K) | |||
| V (Å3) | 214.76 | 199.00 | 227.48 |
| a (Å) | 6.40 | 6.06 | 6.68 |
| b (Å) | 7.22 | 7.28 | 7.39 |
| c (Å) | 4.65 | 4.51 | 4.61 |
| E lat (kJ mol−1) | — | 50.82 | 50.54 |
| ΔHsub (0 K) (kJ mol−1) | — | 44.43 | 44.71 |
![[thin space (1/6-em)]](https://www.rsc.org/images/entities/char_2009.gif) |
|||
γ-Methanol (Z = 6, P![[1 with combining macron]](https://www.rsc.org/images/entities/b_char_0031_0304.gif) , 298 K, 4.0 GPa) , 298 K, 4.0 GPa)
|
|||
| V (Å3) | 236.80 | 235.18 | 230.90 |
| a (Å) | 7.67 | 7.76 | 7.68 |
| b (Å) | 4.41 | 4.34 | 4.33 |
| c (Å) | 7.20 | 7.16 | 7.13 |
| α (Å) | 88.10 | 85.82 | 85.78 |
| β (Å) | 102.89 | 102.07 | 101.99 |
| γ (Å) | 93.85 | 93.85 | 93.58 |
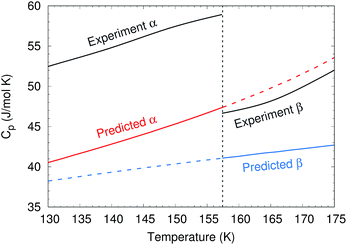 | ||
| Fig. 3 Comparison between predicted and experimental47 isobaric heat capacities near the experimental α–β phase transition at 157 K. | ||
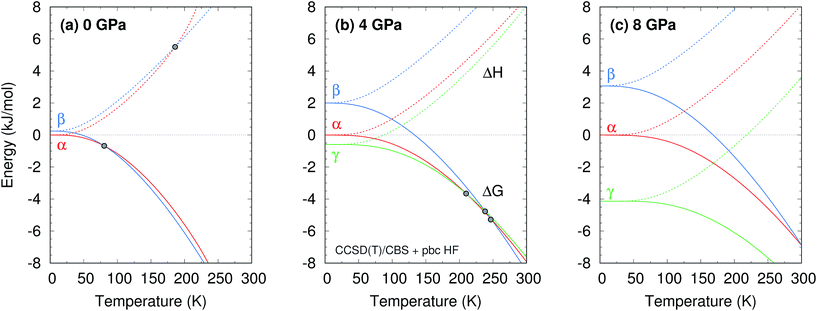
The phase diagram was constructed by computing G(T,p) for each phase over a range of temperatures and pressures and interpolating to find the phase equilibrium conditions. Fig. 4 plots sample free energy profiles at selected pressures. Fig. 2b overlays the predicted α, β, and γ coexistence curves onto the experimental phase diagram. Phase boundaries involving the unknown δ form were not computed. The predicted phase boundaries broadly reproduce the thermodynamic stability regions for the three polymorphs. The predictions underestimate the α–β transition temperature by ∼80 K near ambient pressure and ∼50 K or less at higher pressures. The α–γ transition pressure is predicted to within a fraction of a gigapascal. The predicted triple point for the three polymorphs occurs at 4.2 GPa and 250 K, versus 3.6 GPa and 290 K experimentally (errors of 0.6 GPa and 40 K).
For comparison, predictions of the methanol phase diagram with empirical force fields found no region of phase stability for the β phase whatsoever and predicted that the α–γ transition occurs above 10 GPa, instead of near 3.6 GPa.48,49 A carbon dioxide phase diagram predicted from density functional theory with the Perdew–Burke–Ernzerhof (PBE) functional underestimated the temperature-dependent phase transition in the 5–10 GPa regime by ∼200 K,30versus only ∼25 K errors for methanol in the same pressure regime here.
Further perspective on the quality of the predicted transition temperatures can be gleaned from sensitivity analysis (Fig. 5 and Section S5†). At ambient pressure, the α and β phases lie extremely close in free energy (ΔG = 0.24 kJ mol−1 at 0 K), and their free energies vary similarly with temperature (Fig. 4a). This translates to extreme sensitivity of the predicted phase transition temperature to small changes in the model. Increasing the predicted α–β phase transition temperature at ambient pressure from the current 81 K to the experimental 157 K would require stabilizing the α phase Gibbs free energy by a mere 0.4 kJ mol−1 relative to β. Similarly, a 0.5 kJ mol−1 change in the relative α–γ free energies would shift that coexistence curve to near-perfect agreement with experiment. In other words, the predicted phase boundaries here correspond to ∼0.5 kJ mol−1 accuracy or better in the relative free energies. At higher pressures, the increased importance of crystal packing density and diminished impact of thermal expansion make phase transitions easier to predict by reducing the sensitivity to small changes in the energies (Fig. 4c).
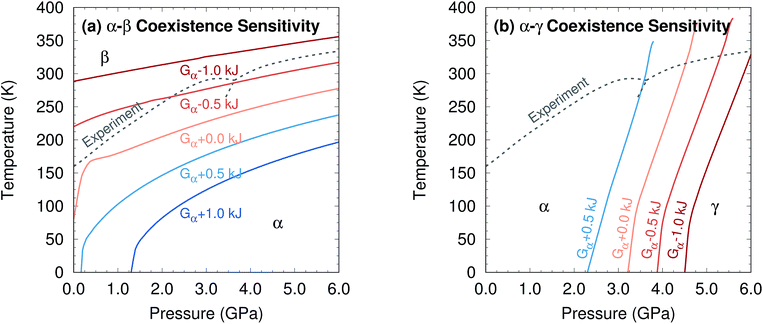 | ||
| Fig. 5 Sensitivity of two phase coexistence curves to shifting the α-phase free energy by a small amount. | ||
Additional sensitivity analysis described in Section S5† reveals that the errors in the predicted transition temperatures stem largely from errors in the relative stabilities of the phases, while problems in the coexistence curve slopes arise from subtle variations in the curvatures of the electronic energy wells. The phase diagram is slightly less sensitive to errors in the phonons, though quasi-harmonic treatment of thermal expansion is key to reproducing the phase diagram even qualitatively.
The calculations here represent the disordered β phase via a single dynamically averaged structure. This is probably a reasonable approximation for the enthalpy, since experimental evidence33,50–56 largely points toward a thermally averaged structure and MP2 + AMOEBA calculations indicate that the disordered structures with out-of-plane distortion lie ∼1.5 kJ mol−1 higher than the averaged structure. On the other hand, the modeling approach may underestimate the entropic contribution from the disorder. For a static disorder with two possible orientations for each of the four molecules in the cell, one might simplistically estimate a configurational entropy stabilization for β methanol as Sconfig = R![[thin space (1/6-em)]](https://www.rsc.org/images/entities/char_2009.gif) ln
ln![[thin space (1/6-em)]](https://www.rsc.org/images/entities/char_2009.gif) 24 per cell, or 5.8 J mol−1 K−1 per molecule. That entropic stabilization would lower the α–β transition temperature by an additional ∼50 K at ambient pressure. Alternatively, the dynamically disordered scenario suggested by experiments and our calculations would manifest instead as a highly anharmonic motion that would not be captured by the quasi-harmonic phonon model here. See Section S4.2† for more details. A more careful treatment of the disorder28,57,58 would be a worthwhile future investigation.
24 per cell, or 5.8 J mol−1 K−1 per molecule. That entropic stabilization would lower the α–β transition temperature by an additional ∼50 K at ambient pressure. Alternatively, the dynamically disordered scenario suggested by experiments and our calculations would manifest instead as a highly anharmonic motion that would not be captured by the quasi-harmonic phonon model here. See Section S4.2† for more details. A more careful treatment of the disorder28,57,58 would be a worthwhile future investigation.
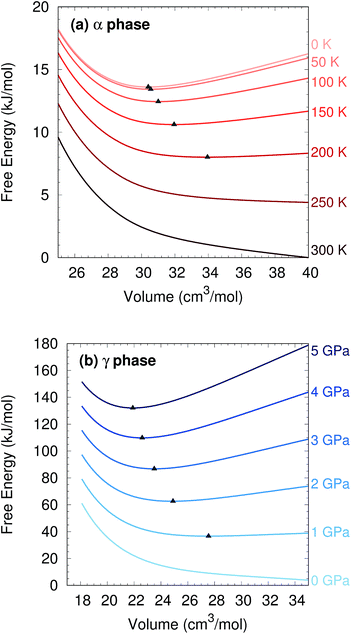
Two other notable observations emerge from this study. First, it is common in crystal structure prediction to include Gibbs free energy estimates only in the final energy ranking steps. However, as shown in Fig. 6, the α phase exhibits a minimum on the free energy surface only below ∼240 K. Similarly, the γ phase only occurs at pressures above ∼1 GPa. These examples highlight how the potential and free energy landscapes can differ qualitatively, and that the thermodynamic conditions employed in crystal structure prediction can impact the structures that will be identified. Second, a candidate structure was recently proposed for the δ phase from crystal structure prediction.59 Calculations on this proposed structure predict its Gibbs free energy lies several kJ mol−1 above those of the α and γ phases throughout the relevant temperature and pressure ranges (Section S7†), suggesting that the proposed structure cannot account for the experimentally observed δ phase.
3 Conclusions
How feasible are such polymorph phase diagrams predictions for more complex organic crystals? Computing the methanol phase diagram required a few hundred thousand CPU hours. Using more approximate levels of theory to optimize geometries and compute phonons,43,60 could potentially make such calculations computationally feasible for small-molecule pharmaceuticals. However, whether such techniques can retain the sub-kJ mol−1 accuracy required for phase diagram prediction remains to be seen, especially when conformational flexibility is involved.Discussing the future of chemistry in 1950, Robert Heinlein wrote “When chemistry becomes a discipline, mathematical chemists will design new materials, predict their properties, and tell engineers how to make them—without entering the laboratory. We've got a long way to go on that one.”61 Heinlein's third goal has proved particularly challenging for simulation, but the ability to predict a phase diagram ab initio represents a significant step toward the day when computation will be able to both predict what crystal structures might form and tell laboratory scientists how to make them.
4. Computational methods
Experimental crystal structures for the α (Ref Code METHOL04),33 β (METHOL05),33 and γ phases of methanol (METHOL03)34 were taken from the Cambridge Crystal Structure Database. Because the β phase structure exhibits disorder with two possible conformations for each methanol molecule, an averaged structure was generated for subsequent calculations.As described in our recent study of α methanol,42 the crystal structures were relaxed using the hybrid many-body interaction (HMBI) fragment approach,37 employing density-fitted MP2 in the aug-cc-pVTZ basis set62 (Molpro 2012.1 (ref. 63)) for the one-body and short-range two-body terms and the AMOEBA force field38 (Tinker 6.2 (ref. 64)) for the long-range (>9–10 Å) pairwise and many-body contributions. Because the γ phase involves a larger unit cell (Z = 6) and low P![[1 with combining macron]](https://www.rsc.org/images/entities/char_0031_0304.gif) symmetry, it was optimized in the smaller aug-cc-pVDZ basis set. Counterpoise corrections were applied for the dimer interactions throughout.
symmetry, it was optimized in the smaller aug-cc-pVDZ basis set. Counterpoise corrections were applied for the dimer interactions throughout.
To evaluate the quasi-harmonic free energies, electronic energy vs. volume curves were mapped out for each polymorph, as shown in Fig. S2.† These curves were based on 15 structure optimizations each: the original optimization plus six more at positive pressures (compression branch) and eight more at negative pressures (expansion branch) using HMBI MP2/aug-cc-pVTZ + AMOEBA. The application of positive/negative pressure allows the crystals to expand or contract anisotropically.42 Single-point energies on these structures were then refined by replacing the AMOEBA many-body contributions with ones evaluated from periodic HF/pob-TZVP65 using CRYSTAL09 (ref. 66) (see Section S3†).
In addition, the impact of monomer and dimer correlation treatment at the MP2/aug-cc-pVTZ, MP2/CBS, and CCSD(T)/CBS levels of theory was considered (again using Molpro). Complete-basis set results were obtained from two-point aug-cc-pVTZ and aug-cc-pVQZ extrapolation.67,68
The resulting energy versus volume curves for each polymorph were fitted to a double Murnaghan equation of state—that is fitting the compression and expansion branches separately to the Murnaghan equation of state,
 | (1) |
Next, harmonic Γ-point phonons were computed at several different volumes at the HMBI MP2/aug-cc-pVTZ + AMOEBA level of theory (aug-cc-pVDZ for γ methanol). At each volume, the Helmholtz vibrational free energy is computed as a function of temperature according to
 | (2) |
The total Helmholtz free energy of the crystal is given as A(T,V) = E(V) + Avib(T,V). Using the thermodynamic relationship  , the Gibbs free energy is evaluated as
 | (3) |
Examples of the resulting free energy curves are shown in Fig. 6. After mapping out the Gibbs free energies over a grid of temperatures and pressures, the coexistence curves (where ΔG = 0 between two phases) were identified via interpolation. See ref. 42 for further details.
Conflicts of interest
There are no conflicts to declare.Acknowledgements
Funding for C. Č. from the Czech Science Foundation (GACR 17-03875S) and Fulbright Commission Czech Republic, along with computing resources from the National Grid Infrastructure MetaCentrum (LM2010005) and CERIT Scientific Cloud (CZ.1.05/3.2.00/08.0144) is highly appreciated. G. B. acknowledges funding from the National Science Foundation (CHE-1665212) and computing resources from XSEDE (TG-CHE110064).References
- S. L. Price, D. E. Braun and S. M. Reutzel-Edens, Chem. Commun., 2016, 52, 7065–7077 RSC.
- S. L. Price, Chem. Soc. Rev., 2014, 43, 2098–2111 RSC.
- E. Zurek, Discovering New Materials via A Priori Crystal Structure Prediction, in Reviews in Computational Chemistry, ed. K. B. Lipkowitz, Wiley, New York, 2016, vol. 29, pp. 274–326. Search PubMed.
- M. Baias, J.-N. Dumez, P. H. Svensson, S. Schantz, G. M. Day and L. Emsley, J. Am. Chem. Soc., 2013, 135, 17501–17507 CrossRef CAS PubMed.
- M. A. Neumann, J. van de Streek, F. P. A. Fabbiani, P. Hidber and O. Grassmann, Nat. Commun., 2015, 6, 7793 CrossRef CAS PubMed.
- A. Pulido, et al. , Nature, 2017, 543, 657–664 CrossRef CAS PubMed.
- G. J. O. Beran, Chem. Rev., 2016, 116, 5567–5613 CrossRef CAS PubMed.
- J. Hoja, A. M. Reilly and A. Tkatchenko, WIREs Comput. Mol. Sci., 2017, 7, e1294 CrossRef.
- S. Grimme, A. Hansen, J. G. Brandenburg and C. Bannwarth, Chem. Rev., 2016, 116, 5105–5154 CrossRef CAS PubMed.
- J. G. Brandenburg and S. Grimme, J. Phys. Chem. Lett., 2014, 5, 1785–1789 CrossRef CAS PubMed.
- G. M. Day, T. G. Cooper, A. J. Cruz-Cabeza, K. E. Hejczyk, H. L. Ammon, S. X. M. Boerrigter, J. S. Tan, R. G. Della Valle, E. Venuti, J. Jose, S. R. Gadre, G. R. Desiraju, T. S. Thakur, B. P. van Eijck, J. C. Facelli, V. E. Bazterra, M. B. Ferraro, D. W. M. Hofmann, M. A. Neumann, F. J. J. Leusen, J. Kendrick, S. L. Price, A. J. Misquitta, P. G. Karamertzanis, G. W. A. Welch, H. A. Scheraga, Y. A. Arnautova, M. U. Schmidt, J. van de Streek, A. K. Wolf and B. Schweizer, Acta Crystallogr., Sect. B: Struct. Sci., 2009, 65, 107–125 CAS.
- D. A. Bardwell, C. S. Adjiman, Y. A. Arnautova, E. Bartashevich, S. X. M. Boerrigter, D. E. Braun, A. J. Cruz-Cabeza, G. M. Day, R. G. Della Valle, G. R. Desiraju, B. P. van Eijck, J. C. Facelli, M. B. Ferraro, D. Grillo, M. Habgood, D. W. M. Hofmann, F. Hofmann, K. V. J. Jose, P. G. Karamertzanis, A. V. Kazantsev, J. Kendrick, L. N. Kuleshova, F. J. J. Leusen, A. V. Maleev, A. J. Misquitta, S. Mohamed, R. J. Needs, M. A. Neumann, D. Nikylov, A. M. Orendt, R. Pal, C. C. Pantelides, C. J. Pickard, L. S. Price, S. L. Price, H. A. Scheraga, J. van de Streek, T. S. Thakur, S. Tiwari, E. Venuti and I. K. Zhitkov, Acta Crystallogr., Sect. B: Struct. Sci., 2011, 67, 535–551 CAS.
- A. M. Reilly, R. I. Cooper, C. S. Adjiman, S. Bhattacharya, A. D. Boese, J. G. Brandenburg, P. J. Bygrave, R. Bylsma, J. E. Campbell, R. Car, D. H. Case, R. Chadha, J. C. Cole, K. Cosburn, H. M. Cuppen, F. Curtis, G. M. Day, R. A. DiStasio Jr, A. Dzyabchenko, B. P. van Eijck, D. M. Elking, J. A. van den Ende, J. C. Facelli, M. B. Ferraro, L. Fusti-Molnar, C.-A. Gatsiou, T. S. Gee, R. de Gelder, L. M. Ghiringhelli, H. Goto, S. Grimme, R. Guo, D. W. M. Hofmann, J. Hoja, R. K. Hylton, L. Iuzzolino, W. Jankiewicz, D. T. de Jong, J. Kendrick, N. J. J. de Klerk, H.-Y. Ko, L. N. Kuleshova, X. Li, S. Lohani, F. J. J. Leusen, A. M. Lund, J. Lv, Y. Ma, N. Marom, A. E. Masunov, P. McCabe, D. P. McMahon, H. Meekes, M. P. Metz, A. J. Misquitta, S. Mohamed, B. Monserrat, R. J. Needs, M. A. Neumann, J. Nyman, S. Obata, H. Oberhofer, A. R. Oganov, A. M. Orendt, G. I. Pagola, C. C. Pantelides, C. J. Pickard, R. Podeszwa, L. S. Price, S. L. Price, A. Pulido, M. G. Read, K. Reuter, E. Schneider, C. Schober, G. P. Shields, P. Singh, I. J. Sugden, K. Szalewicz, C. R. Taylor, A. Tkatchenko, M. E. Tuckerman, F. Vacarro, M. Vasileiadis, A. Vazquez-Mayagoitia, L. Vogt, Y. Wang, R. E. Watson, G. A. de Wijs, J. Yang, Q. Zhu and C. R. Groom, Acta Crystallogr., Sect. B: Struct. Sci., Cryst. Eng. Mater., 2016, 72, 439–459 CAS.
- G. J. O. Beran, Nat. Mater., 2017, 16, 602–604 CrossRef CAS PubMed.
- J. Nyman and G. M. Day, CrystEngComm, 2015, 17, 5154–5165 RSC.
- J. Nyman and G. M. Day, Phys. Chem. Chem. Phys., 2016, 18, 31132–31143 RSC.
- J. Yang, W. Hu, D. Usvyat, D. Matthews, M. Schutz and G. K.-L. Chan, Science, 2014, 345, 640–643 CrossRef CAS PubMed.
- A. Würflinger and R. Landau, J. Phys. Chem. Solids, 1977, 38, 811–814 CrossRef.
- E. L. Gromnitskaya, O. V. Stal'gorova, O. F. Yagafarov, V. V. Brazhkin, A. G. Lyapin and S. V. Popova, J. Exp. Theor. Phys. Lett., 2004, 80, 597–601 CrossRef CAS.
- M. V. Kondrin, A. A. Pronin, Y. B. Lebed and V. V. Brazhkin, J. Chem. Phys., 2013, 139, 084510 CrossRef CAS PubMed.
- J. C. Schön and M. Jansen, Int. J. Mater. Res., 2009, 100, 135–152 CrossRef.
- B. C. Revard, W. W. Tipton and R. G. Hennig, Top. Curr. Chem., 2014, 345, 181–222 CrossRef CAS PubMed.
- B. Schatschneider, J.-J. Liang, S. Jezowski and A. Tkatchenko, CrystEngComm, 2012, 14, 4656–4663 RSC.
- G. I. Griffiths, A. J. Misquitta, A. D. Fortes, C. J. Pickard and R. J. Needs, J. Chem. Phys., 2012, 137, 064506 CrossRef PubMed.
- Y. N. Heit, K. D. Nanda and G. J. O. Beran, Chem. Sci., 2016, 7, 246–255 RSC.
- P. Raiteri, R. Martonák and M. Parrinello, Angew. Chem., Int. Ed., 2005, 44, 3769–3773 CrossRef CAS PubMed.
- E. Schneider, L. Vogt and M. E. Tuckerman, Acta Crystallogr., Sect. B: Struct. Sci., Cryst. Eng. Mater., 2016, 72, 542–550 CAS.
- E. C. Dybeck, N. S. Abraham, N. P. Schieber and M. R. Shirts, Cryst. Growth Des., 2017, 17, 1775–1787 CAS.
- N. P. Schieber, E. C. Dybeck and M. R. Shirts, J. Chem. Phys., 2018, 148, 144104 CrossRef PubMed.
- S. A. Bonev, F. Gygi, T. Ogitsu and G. Galli, Phys. Rev. Lett., 2003, 91, 065501 CrossRef CAS PubMed.
- C. Vega, J. L. F. Abascal, E. Sanz, L. G. MacDowell and C. McBride, J. Phys.: Condens. Matter, 2005, 17, S3283–S3288 CrossRef CAS.
- L.-P. Wang, T. Head-Gordon, J. W. Ponder, P. Ren, J. D. Chodera, P. K. Eastman, T. J. Martinez and V. S. Pande, J. Phys. Chem. B, 2013, 117, 9956–9972 CrossRef CAS PubMed.
- M. T. Kirchner, D. Das and R. Boese, Cryst. Growth Des., 2008, 8, 763–765 CAS.
- D. R. Allan, S. J. Clark, M. J. P. Brugmans, G. J. Ackland and W. L. Vos, Phys. Rev. B, 1998, 58, R11809–R11812 CrossRef CAS.
- R. P. Stoffel, C. Wessel, M.-W. Lumey and R. Dronskowski, Angew. Chem., Int. Ed., 2010, 49, 5242–5266 CrossRef CAS PubMed.
- C. Červinka, M. Fulem, R. P. Stoffel and R. Dronskowski, J. Phys. Chem. A, 2016, 120, 2022–2034 CrossRef PubMed.
- G. J. O. Beran and K. Nanda, J. Phys. Chem. Lett., 2010, 1, 3480–3487 CrossRef CAS.
- P. Ren, C. Wu and J. W. Ponder, J. Chem. Theory Comput., 2011, 7, 3143–3161 CrossRef CAS PubMed.
- S. Wen and G. J. O. Beran, J. Chem. Theory Comput., 2012, 8, 2698–2705 CrossRef CAS PubMed.
- Y. N. Heit and G. J. O. Beran, Acta Crystallogr., Sect. B: Struct. Sci., Cryst. Eng. Mater., 2016, 72, 514–529 CAS.
- W. Sontising, Y. N. Heit, J. L. McKinley and G. J. O. Beran, Chem. Sci., 2017, 8, 7374–7382 RSC.
- C. Červinka and G. J. O. Beran, Phys. Chem. Chem. Phys., 2017, 19, 29940–29953 RSC.
- J. L. McKinley and G. J. O. Beran, Faraday Discuss., 2018 10.1039/c8fd00048d.
- C. Červinka and M. Fulem, J. Chem. Theory Comput., 2017, 13, 2840–2850 CrossRef PubMed.
- K. Nagayoshi, K. Kitaura, S. Koseki, S. Re, K. Kobayashi, Y.-K. Choe and S. Nagase, Chem. Phys. Lett., 2003, 369, 597–604 CrossRef CAS.
- C. Červinka, M. Fulem and K. Růžička, J. Chem. Phys., 2016, 144, 064505 CrossRef PubMed.
- H. G. Carlson and E. F. Westrum, J. Chem. Phys., 1971, 54, 1464–1471 CrossRef CAS.
- D. Gonzalez Salgado and C. Vega, J. Chem. Phys., 2010, 132, 094505 CrossRef CAS PubMed.
- D. Gonzalez-Salgado, A. Dopazo-Paz, P. Gomez-Alvarez, J. M. Miguez and C. Vega, J. Phys. Chem. B, 2011, 115, 3522–3530 CrossRef CAS PubMed.
- K. J. Tauer and W. N. Lipscomb, Acta Crystallogr., 1952, 5, 606–612 CrossRef CAS.
- J. R. Durig, C. B. Pate, Y. S. Li and D. J. Antion, J. Chem. Phys., 1971, 54, 4863 CrossRef CAS.
- A. Anderson, B. Andrews, E. M. Meiering and B. H. Torrie, J. Raman Spectrosc., 1988, 19, 85–89 CrossRef CAS.
- B. Torrie, S.-X. Weng and B. Powell, Mol. Phys., 1989, 67, 575–581 CrossRef CAS.
- R. Tycko and G. Dabbagh, J. Am. Chem. Soc., 1991, 113, 3592–3593 CrossRef CAS.
- P. Robyr, B. H. Meier, P. Fischer and R. R. Ernst, J. Am. Chem. Soc., 1994, 116, 5315–5323 CrossRef CAS.
- B. H. Torrie, O. S. Binbrek, M. Strauss and I. P. Swainson, J. Solid State Chem., 2002, 166, 415–420 CrossRef CAS.
- M. Habgood, R. Grau-Crespo and S. L. Price, Phys. Chem. Chem. Phys., 2011, 13, 9590–9600 RSC.
- C. Muller and D. Spangberg, J. Comput. Chem., 2015, 36, 1420–1427 CrossRef PubMed.
- T.-J. Lin, C.-R. Hsing, C.-M. Wei and J.-L. Kuo, Phys. Chem. Chem. Phys., 2016, 18, 2736–2746 RSC.
- J. G. Brandenburg, J. Potticary, H. A. Sparkes, S. L. Price and S. R. Hall, J. Phys. Chem. Lett., 2017, 8, 4319–4324 CrossRef CAS PubMed.
- R. A. Heinlein, “Where To?” in Expanded Universe, Ace Science Fiction, New York, 1980, p. 348 Search PubMed.
- T. H. Dunning, J. Chem. Phys., 1989, 90, 1007–1023 CrossRef CAS.
- H.-J. Werner, P. J. Knowles, G. Knizia, F. R. Manby, M. Schütz, P. Celani, T. Korona, R. Lindh, A. Mitrushenkov, G. Rauhut, K. R. Shamasundar, T. B. Adler, R. D. Amos, A. Bernhardsson, A. Berning, D. L. Cooper, M. J. O. Deegan, A. J. Dobbyn, F. Eckert, E. Goll, C. Hampel, A. Hesselmann, G. Hetzer, T. Hrenar, G. Jansen, C. Köppl, Y. Liu, A. W. Lloyd, R. A. Mata, A. J. May, S. J. McNicholas, W. Meyer, M. E. Mura, A. Nicklass, D. P. O'Neill, P. Palmieri, D. Peng, K. Pflüger, R. Pitzer, M. Reiher, T. Shiozaki, H. Stoll, A. J. Stone, R. Tarroni, T. Thorsteinsson, and M. Wang, MOLPRO, version 1, a package of ab initio programs, 2012, see http://www.molpro.net Search PubMed.
- J. W. Ponder, TINKER v6.2, http://dasher.wustl.edu/tinker/, accessed May 15, 2014 Search PubMed.
- M. F. Peintinger, D. V. Oliveira and T. Bredow, J. Comput. Chem., 2013, 34, 451–459 CrossRef CAS PubMed.
- R. Dovesi, R. Orlando, B. Civalleri, C. Roetti, V. R. Saunders and C. M. Zicovich-Wilson, Z. Kristallogr., 2005, 220, 571–573 CAS.
- A. Karton and J. M. L. Martin, Theor. Chem. Acc., 2006, 115, 330–333 CrossRef CAS.
- T. Helgaker, W. Klopper, H. Koch and J. Noga, J. Chem. Phys., 1997, 106, 9639–9646 CrossRef CAS.
Footnote |
| † Electronic Supplementary Information (ESI) available: Discussion of the experimental uncertainties, additional modeling details, structure overlays, sensitivity analysis, and investigation of the δ phase structure. See DOI: 10.1039/c8sc01237g |
| This journal is © The Royal Society of Chemistry 2018 |

