 Open Access Article
Closed-loop feedback control for microfluidic systems through automated capacitive fluid height sensing†
L. R.
Soenksen
 *ab,
T.
Kassis
 bc,
M.
Noh
 ab,
L. G.
Griffith
ac and
D. L.
Trumper
*ab
aDepartment of Mechanical Engineering, MIT, Cambridge, MA, USA. E-mail: soenksen@mit.edu
bResearch Laboratory of Electronics, MIT, Cambridge, MA, USA
cDepartment of Biological Engineering, MIT, Cambridge, MA, USA
First published on 5th February 2018
Abstract
Precise fluid height sensing in open-channel microfluidics has long been a desirable feature for a wide range of applications. However, performing accurate measurements of the fluid level in small-scale reservoirs (<1 mL) has proven to be an elusive goal, especially if direct fluid-sensor contact needs to be avoided. In particular, gravity-driven systems used in several microfluidic applications to establish pressure gradients and impose flow remain open-loop and largely unmonitored due to these sensing limitations. Here we present an optimized self-shielded coplanar capacitive sensor design and automated control system to provide submillimeter fluid-height resolution (∼250 μm) and control of small-scale open reservoirs without the need for direct fluid contact. Results from testing and validation of our optimized sensor and system also suggest that accurate fluid height information can be used to robustly characterize, calibrate and dynamically control a range of microfluidic systems with complex pumping mechanisms, even in cell culture conditions. Capacitive sensing technology provides a scalable and cost-effective way to enable continuous monitoring and closed-loop feedback control of fluid volumes in small-scale gravity-dominated wells in a variety of microfluidic applications.
I. Introduction
Devices for precise fluid handling at the micro- and mesoscale, with characteristic lengths (λ) < 10 cm, are becoming increasingly common across a variety of fields, including biological, pharmaceutical and medical research.1 Most microfluidic systems require at least one pump to produce flow, as well as open- or closed-channels or reservoirs to supply, store and collect fluid. Such devices can be categorized in terms of their primary pumping action as mechanical, chemical, surface-, force-field and mixed systems.1–3 Examples of mechanical pumping at these scales include syringe-pumps, microelectromechanical (MEM) pumps,4 magnetically actuated pumps,5,6 vacuum or pressure-driven pumps, peristaltic pumps and centrifugal pumps.1,7,8 Chemically-induced flow can be seen in osmotic and effervescence pumps, as well as systems using electrochemical reactions.1,9–11 Surface-effect pumps include all devices making use of spontaneous capillary forces and substrate wicking to passively induce fluid flow.12 Further, force-field pumps are usually defined as non-mechanical including electro-osmotic,3,13 electrowetting,14 poroelastic,15 electrodynamic, thermocapillary and gravity-driven pumps.1,3,16,17Common metrics for performance comparison in microfluidic applications include: operational fluid volumes, flow rates, directionality, persistence time, flow pattern control, fluid capacity, recirculation, optical accessibility, power requirements, heat transfer, and cost of implementation.1 Furthermore, criteria such as imposing minimal mechanical, chemical and electrical stress during cell or particle handling, as well as providing material/surface stability against fouling or analyte absorption may also be important to consider.1 Understanding the expected performance and inherent limitations associated with each fluid handling and pumping scheme is essential. For example, mechanical pumps connected to open wells or channels do not usually deliver robust steady-state flows for long periods of time as they are bounded by a specific input volume (e.g. syringe pumps), rely on pulsatile flow (e.g. peristaltic, pneumatic and MEM-based pumps),11,12,18–21 are transient in nature (e.g. gravity-driven,22 capillary-driven12 and centrifugal pumps23), or are prone to performance variation (e.g. fabrication errors, use-induced stress). Thus, it remains desirable to identify novel approaches to provide robust, scalable and cost-effective monitoring and control of both pumping performance and fluid volume allocation in microfluidic devices.
Among the most attractive targets for improved microfluidic pumping control and volume tracking, we find a variety of open-channel systems such as multi-well cell-culture plates and organ-on-chip platforms.24,25 In these systems, open wells are usually intended to maintain constant fluid volumes while driven by passive or active recirculation and media oxygenation circuits that extract and replenish fluid from the system.25 Variations in input and output pumping performance, as well as unpredictable variations in evaporation rates often lead to significant errors in desired fluid heights over relevant experimental timescales. In the particular case of cell culture applications where high flow-rates are required, fluid height errors in the order of millimeters may render otherwise healthy cultures nonviable after just a few hours of operation.26 Moreover, if testing for drug toxicity and other effects related to compound concentration in such experiments, tight fluid volume tracking becomes an absolutely necessity for analysis, which is something largely absent in open-channel fluidic devices used for this purpose.27 Indeed, accurate fluid level monitoring capabilities at these scales has been a challenging goal, with current solutions being mostly incompatible with sterile or contact-sensitive applications, or requiring bulky and expensive instrumentation to achieve.28 This situation has not only limited the reproducibility of experiments performed in a variety of microfluidic platforms, but has also hindered the use of feedback control to improve the robustness of these systems.
Traditional fluid-level sensing technologies such as mechanical floaters, displacers, bubblers, magnetic level gauges, magnetostrictive level transmitters and ultrasonic distance sensors are all currently inadequate or unreliable at the scale of most micro- and mesofluidic devices.29 More recent options such as in-line flow sensors and differential pressure transducers have become increasingly smaller and sensitive over the past years, and are now used in several microfluidic applications.30–32 Nonetheless, these and other available sensing techniques are limited in that they require some degree of fluid contact, which may be undesirable in many sterile biological applications. Non-contact fluid-level sensing technologies; on the other hand, have only become popular in a limited number of large-scale industrial applications including monitoring and handling of large volumes of hazardous fluids. From direct visualization of fluid height (e.g. using optical monitoring through translucent windows), to time-of-flight (TOF) measurements (e.g. ultrasonic, laser and radar transmitters), and capacitive fluid sensing;33 non-contact fluid-level sensors are now an increasingly common strategy to control macrofluidic systems where relevant height changes happen in the order of tens of centimeters. From these non-contact options, capacitive fluid sensing is perhaps the most attractive due to scalability and low cost. In the case of microfluidic applications, several groups have previously demonstrated the use of capacitive sensing for binary detection of droplets34 and droplet volume quantification.17,35 Furthermore, other research groups have used this technology to develop contact-based in-line pressure sensors,35 assess composition of liquids36 and even small-scale flow directionality sensors.37 While these developments show the general versatility and ease of integration of capacitive sensing in fluidic systems; to our knowledge, the use of capacitive fluid level-sensing for the control of open-well chambers in microfluidics has yet to be demonstrated. Here we present an optimized non-contact capacitive fluid level-sensing technology with submillimeter resolution to provide closed-loop control of a gravity-driven pump for cell culture as a proof-of-concept to show its use in a range of microfluidic systems.
II. Materials and methods
II.a Feedback-controlled gravity-driven pump setup
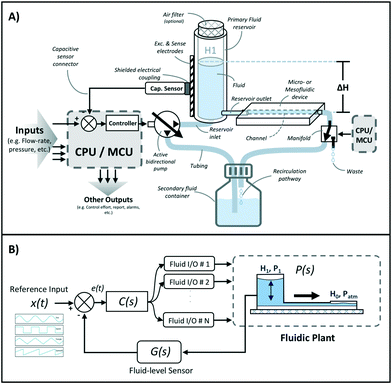
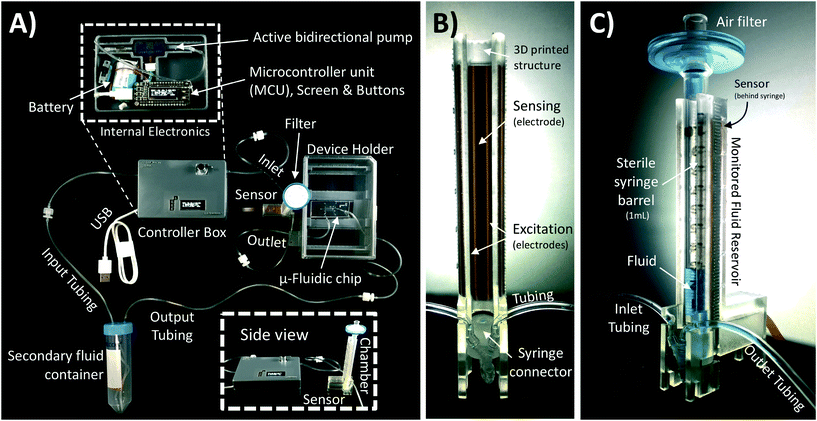
A schematic of the assembled testing setup developed to demonstrate the capabilities of our capacitive fluid-level sensor can be seen in Fig. 1A. The elements depicted in this system include a capacitive-fluid sensor, a hydrostatic chamber, a microcontroller unit, a bidirectional pump, a microfluidic device and a recirculation container, as well as tubing and connectors. In this testing setup, the fluid level in the primary fluid reservoir is set to the desired position (H1) to act as a hydrostatic chamber, which drives gravity-driven flow through a meso- and/or microfluidic chip. This chip is located inside a device holder to be connected to the fluidic circuit via standard tubing and microfluidic connectors. The height difference (ΔH) with respect to the chamber outlet produces a hydrostatic pressure (Pin) at the inlet of the connected microfluidic channel such that Pin = ρgΔH; where ρ ≈ 1 g cm−3 (fluid density for water) and g ≈ 9.81 m s−2. The flow rate imposed through the microfluidic device (Q) is then related to the pressure gradient between the inlet and outlet of the microfluidic channel (ΔP) as well as its fluidic resistance (R) such that Q = ΔP/R. During operation, the fluid level in this primary reservoir is continuously monitored using the non-contact fluid-level sensor. The recorded fluid level is then fed to a microcontroller unit (MCU) implementing a closed-loop algorithm (Fig. 1B).This system takes a user-defined reference input signal x(t) (i.e. height, pressure, flow rate) and compares it to the measured state to produce an error signal e(t). The generated error feeds a control law that actuates a bidirectional pump capable of actively increasing or decreasing the fluid height in the primary fluid reservoir to track the reference input x(t). Standard tubing, connectors and a secondary container complete the fluidic circuit, all of which allow for stand-alone operation. A prototype of this system, including required electronic components and other structural elements (e.g. controller box, sensor/chamber holder, microfluidic device holder) can be seen in Fig. 2A. More detail on the design and fabrication of each of the components and modules is presented in further sections.
Gravity-driven flow is determined by the height of the fluid column and the downstream resistance of the system. The microfluidic device is connected using standard tubing and located within the device holder (Fig. 2A) to reliably control its vertical position with respect to the bottom of the fluid column. The non-contact capacitive fluid-level sensor is in close proximity to the fluid (∼2 mm) in the 3D printed structure (Fig. 2B) so as to monitor fluid height. Additional details on the components used for the assembly of this monitored hydrostatic chamber can be found in Fig. S1 of the ESI.†
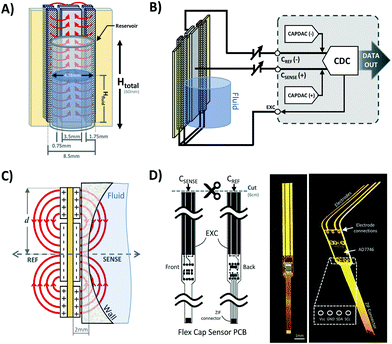
Two symmetrical gaps separate the excitation electrodes from the central sensing electrodes. The gap length is a parameter that is affects the penetration depth of the most sensitive fringing pathways in other types of capacitive sensors using coplanar electrode arrangements.38 Thus, Lgap can be iteratively adjusted to achieve optimal sensing in other applications with different fluid-sensor wall thicknesses. For our hydrostatic chamber prototype in Fig. 3A, Lgap = 0.75 mm was heuristically determined (from several design iterations) as sufficiently small to allow for capacitive sensing using our electrode geometry.
The AD7746 chip is connected to the front sensing electrode via the Csense(+) terminal, while the back sensing electrode is connected to the reference terminal Cref(−) to allow for differential measurements. The excitation electrodes of both sensing and reference planes are connected to the same excitation (EXC) terminal. The differential mode of the AD7746 chip was selected to maximize the robustness of capacitance measurements, while the addition of a symmetrical reference arrangement at the back of the sensing layout was designed to maximize signal-to-noise ratio. This effect can be explained by referring to the expected fringing capacitance pathways on the presented mirrored electrode design (Fig. 3A), which shows a self-shielding effect within the sensor.
In commonly used capacitive sensing instruments, the region separating the electrodes from a target fluid is usually made of materials with low electrical permittivity (ε) such as plastic, glass or air.39 This renders the capacitance due to plastic structures and air small as along as εAir <εPlastic ≪ εFluid is maintained. Thus, in our system the capacitance attributable to the region next to the fluid can be approximated to the total capacitance detected at the Csense(+) terminal. Furthermore, in previously described coplanar sensor designs,39 the reference electrodes are usually situated in the same plane as the main sensing electrode (next to a region constantly filled with fluid). This traditional configuration simplifies the sensor compensation for different kinds of fluids and temperature changes, but it also brings several limitations in terms of footprint, minimum detectable fluid volume and achievable signal-to-noise ratio.
Our sensor prototype is implemented using a 3-layer flexible printed circuit board (Flex-PCB) with total thickness of 0.2 mm. Electrodes are defined as 0.5 oz copper layers with 17.5 μm thickness, while a 55 μm polyimide film was used as dielectric. A layer of dielectric film lies between the mirrored electrodes, as well as at the top and bottom of the sensor to protect the conductive material from corrosion (Fig. 3D). Connection traces between sensing circuit and electrodes use 0.127 mm traces. The electrodes are made with an original length Ltotal = 20 cm, and then are cut at the top end to fit the 6 cm fluid reservoir. This design allows for use of the sensor in longer hydrostatic chambers with minimum modification of the sensor design. The separation of the mirrored reference electrode from the main sensing plane was achieved using a 75 μm adhesive-polyimide-adhesive dielectric layer. Since increasing the distance between the central electrode and the fluid is expected to reduce sensitivity of the capacitive sensor, we aimed to reduce this separation considering the minimal resin thickness achievable with our 3D printing equipment without producing significant wall defects (∼0.45 mm). This structural separation, in addition to the sensor's outer polyimide dielectric layer (55 μm), and the 1 mL syringe's wall thickness added to a minimum electrode-fluid separation for our testing setup of approximately 2 mm (shown in Fig. 3C). As with other capacitive sensing systems, the materials separating the electrodes from the fluid (e.g. syringe wall) are not expected to significant effects on the sensor's performance as long as the electrical permittivity of these materials are at least one order of magnitude less than that of the used fluid (εPlastic ≪ εFluid). Many other potential sources of variability affecting the performance of our capacitive sensor, such as electrode positioning, temperature changes, defects in structural materials and properties of the handled fluid, can all be automatically accounted for using an initial calibration routine and by performing differential measurements.
The charge distribution imposed by this design directs the fringing fields of the sensing electrode plane preferably towards the fluid, while directing the fields of the reference electrode plane towards the back of the sensor. This configuration is more compact than traditional coplanar capacitive sensors, and enables the detection of smaller increases in fluid height and more effective compensation of external parasitic capacitances (e.g. user's movement). For this configuration, the capacitance associated with the sensing and reference coplanar electrodes can be approximated as:40
 | (1) |
 | (2) |
 | (3) |
II.b System testing and validation
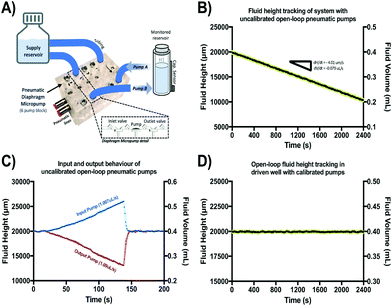
In a subsequent experiment, this height-based flow-rate tracking methodology was used to characterize and calibrate two presumably identical open-loop pneumatic diaphragm micropumps. These micropumps were set to supply and extract fluid from the same monitored reservoir at 1 μL s−1. These pumps were fabricated in acrylic using a CNC mill and a thin polyurethane membrane according to a previously reported protocol.43 Both pumps were actuated for 40 min at 1 Hz (stroke volume = 1 μL) under 37 °C and 95% humidity to observe fluid-height drift (in triplicate). After confirming adequate operation of both pumps, any observed volume drift in the monitored reservoir is assumed to be caused by small differences in input/output pumping performance attributable to fabrication variations or head pressure effects. After combined drift characterization, flow-rates were independently tracked in triplicate for each pump to recalibrate their actuation frequency and adjust for errors. After calibration, fluid-height drift was again characterized for 40 min and compared against uncalibrated behavior (n = 3) as shown in Fig. 6.
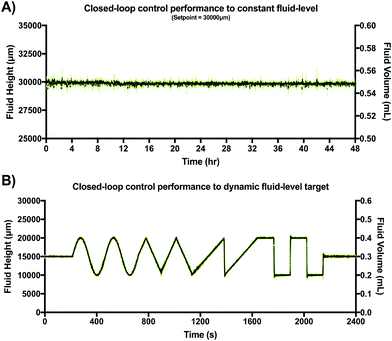
After verifying adequate closed-loop performance for a constant fluid-level set-point, a dynamic fluid-level target experiment was conducted under similar experimental conditions. However, in this case the target was pre-programmed to be a dynamic fluid-level profile stored in non-volatile memory of the MCU. This profile was a 40 min sequence including constant, sine, triangular, saw tooth and step waveforms (two periods each). This experiment was also conducted in triplicate within an incubator (37 °C at 95% humidity) using video recordings to verify location of the fluid front. Results are shown in Fig. 7A.
where μ is the dynamic viscosity of media which was assumed to be close to that of water (6.94 × 10⁻⁴ Pa s at 37 °C), L is the length of the channel, w is the width and h is the height. For the tubing, which has a circular cross-sectional area with inner diameter 1/32 inch and total length of 20 cm, the fluidic resistance can be calculated as:45
where r is the inner radius of the tubing, L is the length of the tubing, μ is the dynamic viscosity of media which was assumed to be close to that of water (6.94 × 10⁻⁴ Pa s at 37 °C). Using this information, we calculated the flow rate Q to be 2.64 × 10⁻⁸ m3 s−1 or 1.59 mL min−1 at this specific height. The wall shear stress, τ, imposed on the endothelial cells under this flow rate can be calculated as:47
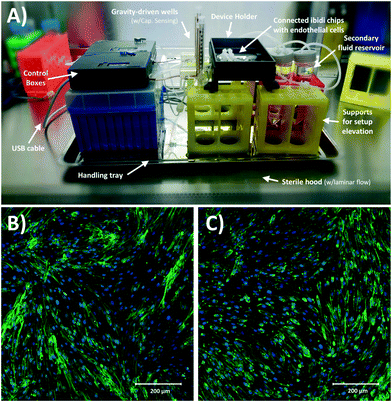
here τ is in dyne per cm2, μ is in poise, Q is in cm3 s−1 and h and w are in cm and are the height and width of the IBIDI channel respectively. After 24 hours of culture, cells were fixed with 4% PFA, stained with DAPI and rhodamine and imaged under an EVOS inverted microscope (Life Technologies, Woburn MA, USA) with a 20× objective.
II.c Statistical analysis
All validation experiments were conducted in triplicates. Error bars represent standard deviation in all figures. Calculations and plots were generated with Graphpad Prism 7 (GraphPad Software Inc.; La Jolla, USA).III. Results & discussion
III.a Accurate capacitance fluid sensing and fluid tracking
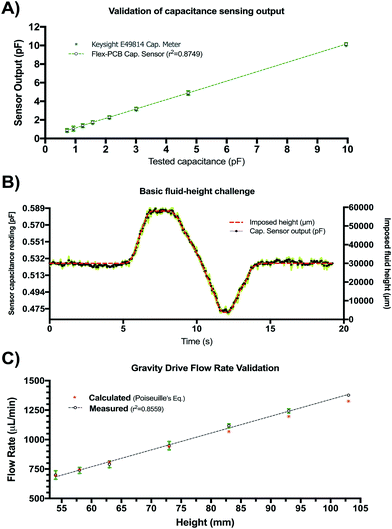
The results of the initial characterization experiments used to assess the accuracy of capacitance readings and basic fluid level tracking capabilities of our sensing circuit are shown in Fig. 4. Measured values of known capacitors directly connected to the Csense(+) and CEXC terminals in our sensing circuit appear to match those of the E4981A capacitance meter within <0.1 pF error (Fig. 4A). Readings from the capacitive sensing circuit also appear to be linearly related to those obtained from the calibrated reference meter suggesting appropriate implementation of the sensor at the PCB level. Fig. 4B shows the aggregated results for three basic fluid-level tracking challenges using the fluid chamber with our proposed excitation-sensing-excitation inter-digitating capacitive sensor arrangement (ESE-ID) as depicted in Fig. 2C. The dashed red profile in Fig. 4B is the known fluid-height as imposed by the calibrated syringe pump. Black data points refer to the averaged capacitive sensor output for the three replicates at each time point. The average standard deviation across all samples in this experiment was <250 μm when compared to the fluid height imposed by the calibrated syringe pump. Fig. 4C shows both measured and estimated flow-rates in our gravity-driven pump as a function of set fluid height. While experimental measurements appear to closely follow the theoretical values predicted by Poiseuille's equation, there also seems to be a slight overestimation of flow rate near the most upper level of the capacitive electrodes. While not fully explored in this work, such effect appears to be caused by an unmolded fringing capacitance at this boundary, which may be further corrected via software using a linear calibration curve. Fig. 4C shows an apparent minimum fluid height of 54 mm for this specific test; nonetheless, this included a 53 mm offset from the measuring outlet as described in section II.b.3. Considering this offset, it can be recognized that the actual minimum fluid height controlled for this test corresponded to approximately 1 mm. Despite the fact that our capacitive sensor was able to detect complete emptying of the fluid chamber, we selected this minimum fluid level in order to avoid partial emptying or significant meniscus effects such as edge pinning during this test. Error bars are shown in green for all measurements in Fig. 4. If further error reduction is required, averaging techniques and low-pass filtering may also be implemented in longer experimental time scales.III.b Capacitance readings depend on fluid conductivity
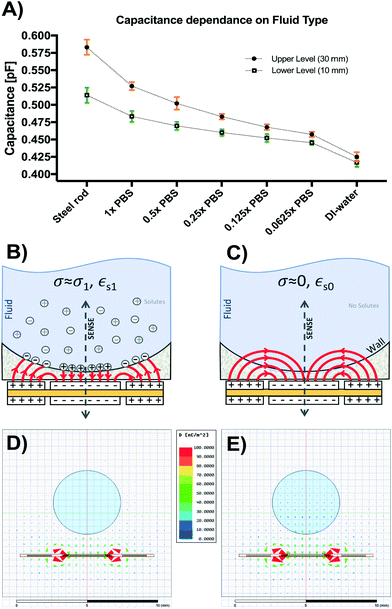
Fig. 5A shows the results from the titration experiments conducted to characterize performance of our capacitive sensor based on fluid conductivity. Capacitance readings for upper (H1 = 30 mm) and lower (H0 = 10 mm) levels were smallest and closest together for deionized (DI) water and increased as electrolyte concentration increased to 1× PBS (conductivity @25 °C = 1.6 S m−1). Small steel rods of both lengths were also placed inside the monitored reservoir to assess signal in the presence of a known perfect conductor. Higher dilutions (0.5× to 0.0625× PBS) led to a range reduction and lower absolute capacitance, reaching a minimum in DI-water lacking solutes (conductivity @25 °C = 0.055 μS cm−1).This behavior can be explained by the model shown in Fig. 5B and C. In the case of water with dissolved solutes forming free ions (Fig. 5B), a large number of sensing fringing paths become terminated near the fluid-reservoir boundary leading to higher capacitance measurements. Conversely, in the case of pure water (Fig. 5C), fringing capacitance takes longer uninterrupted paths through the bulk of the fluid, generating smaller capacitance measurements. Fig. 5D shows the simulated displacement flux density around the 1× PBS solution (εr,PBS = 80, σPBS = 1.45 S m−1). The charge relaxation time of the 1× PBS solution is τPBS = εr,PBSε0/σPBS = 488 ps, which corresponds to a break frequency fPBS = 2.04 GHz. This break frequency is orders of magnitude higher than the 32 kHz sensor excitation frequency used for the sensor.
Since fPBS ≫ fEXT, the 1× PBS solution behaves like a conductor, accumulating free charges on its surface and increasing the apparent capacitance seen from the sensor electrodes. The induced surface charges terminate the flux density vectors, and therefore the flux density vectors are invisible inside the 1× PBS solution in Fig. 5D. For the case of DI-water (εr,DI = 80, σDI = 5.5 μS m−1), Fig. 5C shows the field lines schematically, while Fig. 5E shows the simulated flux density field. The charge relaxation time of the DI-water is τDI = εr,DIε0/σDI = 129 μs, which corresponds to a break frequency fDI = 7.76 kHz. Since fDI < fEXT, the DI-water behaves like an insulator, which explains why the flux density vectors induced inside the DI-water follows the pattern shown in Fig. 5C and E. These results show that calibration is required to adjust for potential differences in fluid conductivity. Further sections of this work make use of sensors calibrated for 1× PBS and culture media.
III.c Accurate flow-rate tracking and calibration of external pneumatic micropumps
Fig. S3 of the ESI† shows the results of an extended series of experiments carried out to verify if accurate flow-rate calculations were achievable from analyzing fluid-height changes over time using our capacitive sensor. From these experiments, it was confirmed that a variety of flow-rate conditions can be inferred based on this sensor's output and that these values correspond to the programmed settings in the calibrated syringe pump used to impose flow. Fig. 6 shows the results of the characterization and calibration experiment of two open-loop pneumatic diaphragm micropumps (Fig. 6A) feeding and extracting fluid from the same monitored reservoir at a nominal rate of 1 μL s−1. Over the course of 40 min, a 0.2 mL decrease in fluid volume was observed in the monitored reservoir (Fig. 6B), showing that the output pump flow-rate was slightly greater than the input pump flow rate despite being actuated at the same frequency.Independent flow-rate characterization of each of these micropumps using our capacitive sensor revealed an 8.3% mismatch between the output and input micropump flow rates. This difference explains the observed decreasing height drift and is well within the 10–15% expected error usually reported for these type of pumping systems.24 After recalibration of the actuation frequency for both micropumps based on these readings, fluid-height drift appeared to be corrected for the same 40 min period as compared to the uncalibrated behavior. In general, long-term drift is expected to be present for a wide range of open-loop micropumps, due to back pressure, use-induced stress or solute deposition may sporadically change stroke volume. Thus, our sensor could be a valuable addition to open-channel microfluidic systems requiring accurate flow control, or as a new way to assess flow-rates and perform pump calibrations on demand.
III.d Reliable closed-loop control of gravity driven pump
From available approaches for fluid handling in micro- and mesofluidic devices, gravity-driven systems have historically been considered among the most robust, simple and convenient to use.13 Reservoirs acting as gravity-driven pumps are relatively low-cost, can achieve a wide range of flow-rates, rarely lead to bubble stagnation and usually do not require external power to impose flow.13,48 However, traditional gravity-driven pumps (with vertically positioned reservoirs) can only produce unidirectional transient flows as the liquid level in the reservoir decreases.13,16,22 This situation leads to a time-dependent reduction in achievable flow rate proportional to the decline in hydrostatic pressure. This transient mode of operation is a key limitation of most gravity-driven systems, especially in long-term cell culture applications.22Recent modifications of gravity-driven systems have been reported to provide nearly constant flow rates either through the use of horizontal reservoirs (setting a deterministic internal fluid height) or through the use of a large vertical reservoir (maintaining fluid heights nearly constant during limited operation times).49–51 Despite the advantages that these modifications may provide, most currently reported gravity-driven microfluidic devices still remain open-loop in nature, are cumbersome to continuously monitor and cannot deliver bidirectional, smooth, reconfigurable flow over long periods of time. Without closed-loop feedback control, the emptying time for an initial 30 mm fluid column at the hydrostatic chamber in connection with the used single-channel microfluidic chip was approximately 265 s.
Fig. 7 shows the typical closed-loop response provided by our gravity-driven microfluidic setup to a static (Fig. 7A) and dynamic (Fig. 7B) target. Both graphs show the aggregated height measurements for three experimental replicates as a function of time. Capacitive readouts were acquired every 10 ms, but were continuously averaged over 10 samples (T = 100 ms) in both cases to feed the control algorithm. The maximum standard deviation across the entire 48 h testing period for the constant target set point (ΔH = 30 mm) was 0.65 mm, with a calculated drift of <1%. Fig. 7B, shows the results obtained over a 40 min period using a dynamic pre-programmed set point.
The constant, sine, triangular, saw tooth and step waveforms were all recognizable and accurately followed with less than 5% error. Overshooting decaying oscillations were observable at the high-frequency transitions for both step-like cycles, which is characteristic of many second order systems using closed-loop feedback control as it reflects the control loop dynamics. In our augmented gravity-driven setup, fluid height appears to be a useful target variable allowing us to accurately control both pressure and flow-rate in this system. While these variables are commonly measured and used to control large-scale gravity-dominated fluidic systems (volumes > 10 L),52,53 this is the first time, to our knowledge, that capacitive sensing has been adapted to control such parameters in an open-well microfluidic system. Thus, we believe that previous limitations associated with sensing accuracy, miniaturization, ease of use and cost of implementation, may be addressed by our proposed sensor design.
III.e Biocompatibility for continuous cell culture
Finally, Fig. 8A shows the assembled and sterilized gravity driven setup used for our cell culture proof-of-concept. Optical analysis of both static (Fig. 8B) and gravity-driven (Fig. 8C) cultures confirmed viability. No differences in endothelial growth was observed in the test samples compared to the control, which suggests adequate biocompatibility of the designed fluidic circuit, as expected due to the use of inert materials in the system's fluidic pathways. Given the low shear stress we exposed the cells to (1.8 dyne per cm2), we did not expect alignment in the direction of flow as such response for endothelial cells typically requires a shear >10 dyne per cm2 and in previous characterization of iPSC-derived endothelial cells a 20 dyne per cm2 shear stress was used.54Conclusions
Previous to this work, accurate measurement of fluid-height in open reservoirs for microfluidic devices had been considered a challenging task, especially in applications using total volumes below 1 mL. To our knowledge we are the first group to use this type of sensing technology to perform continuous measurements of fluid height changes in open micro- and mesofluidic reservoirs at submillimeter spatial resolution and millisecond temporal resolution to provide closed-loop control of pressure gradients and flow through a gravity driven system.Though limited in some ways (e.g. dependent on fluid properties and requiring non-conducting fluid chambers) we believe the design principles presented here can be used to adapt such sensors to a wide range of open-channel microfluidic devices. In particular, we believe this technology may allow for continuous fluid height monitoring in high throughput microtiter plates and cell culture platforms with the help of robotic liquid handlers, or even in the monitoring of gravity driven chambers to measure permeability of small porous materials such as scaffolds and hydrogels.
Conflicts of interest
The authors confirm that there are no conflicts to declare.Acknowledgements
The authors would like to thank the microfluidics community who have provided both direct and indirect input for the design specifications the presented sensor and system. This work was funded under the Defense Advanced Projects Agency (DARPA) Microphysiological Systems Program (W911NF-12-2-0039).References
- S. K. Vashist, P. B. Luppa, L. Y. Yeo, A. Ozcan and J. H. Luong, Emerging technologies for next-generation point-of-care testing, Trends Biotechnol., 2015, 33(11), 692–705 CrossRef CAS PubMed.
- C. K. Byun, K. Abi-Samra, Y. K. Cho and S. Takayama, Pumps for microfluidic cell culture, Electrophoresis, 2014, 35(2–3), 245–257 CrossRef CAS PubMed.
- L. Chen, S. Lee, J. Choo and E. K. Lee, Continuous dynamic flow micropumps for microfluid manipulation, J. Micromech. Microeng., 2007, 18(1), 013001 CrossRef.
- D. K. Abeywardana, A. P. Hu and Z. Salcic, Pulse Controlled Microfluidic Actuators with Ultra Low Energy Consumption, Sens. Actuators, A, 2017, 263, 8–22 CrossRef CAS.
- A. T. Al-Halhouli, M. I. Kilani and S. Büttgenbach, Development of a novel electromagnetic pump for biomedical applications, Sens. Actuators, A, 2010, 162(2), 172–176 CrossRef CAS.
- C. H. Ahn and M. G. Allen, Fluid micropumps based on rotary magnetic actuators, in Proceedings of MEMS, 1995, vol. 95, pp. 408–412) Search PubMed.
- X. Huang and T. K. Chuan, MEMS-micropumps: a review, in Journal of Fluids Engineering-Transactions of the ASME, 2002 Search PubMed.
- T. Satoh, G. Narazaki, R. Sugita, H. Kobayashi, S. Sugiura and T. Kanamori, A pneumatic pressure-driven multi-throughput microfluidic circulation culture system, Lab Chip, 2016, 16(12), 2339–2348 RSC.
- J. Gross, Chemically driven liquid delivery pumping device, US Pat. 5871125, Elan Medical Technologies Limited, 1999.
- Z. R. Xu, C. G. Yang, C. H. Liu, Z. Zhou, J. Fang and J. H. Wang, An osmotic micro-pump integrated on a microfluidic chip for perfusion cell culture, Talanta, 2010, 80(3), 1088–1093 CrossRef CAS PubMed.
- B. D. Iverson and S. V. Garimella, Recent advances in microscale pumping technologies: a review and evaluation, Microfluid. Nanofluid., 2008, 5(2), 145–174 CrossRef CAS.
- B. Weigl, G. Domingo, P. LaBarre and J. Gerlach, Towards non-and minimally instrumented, microfluidics-based diagnostic devices, Lab Chip, 2008, 8(12), 1999–2014 RSC.
- J. Y. Chang, S. Wang, J. S. Allen, S. H. Lee, S. T. Chang, Y. K. Choi, C. Friedrich and C. K. Choi, A novel miniature dynamic microfluidic cell culture platform using electro-osmosis diode pumping, Biomicrofluidics, 2014, 8(4), 044116 Search PubMed.
- W. C. Nelson and C. J. C. Kim, Droplet actuation by electrowetting-on-dielectric (EWOD): A review, J. Adhes. Sci. Technol., 2012, 26(12–17), 1747–1771 CAS.
- D. R. Hewitt, J. A. Neufeld and N. J. Balmforth, Shallow, gravity-driven flow in a poro-elastic layer, J. Fluid Mech., 2015, 778, 335–360 CrossRef.
- M. Marimuthu and S. Kim, Pumpless steady-flow microfluidic chip for cell culture, Anal. Biochem., 2013, 437(2), 161–163 CrossRef CAS PubMed.
- T. Kim and Y. H. Cho, A pumpless cell culture chip with the constant medium perfusion-rate maintained by balanced droplet dispensing, Lab Chip, 2011, 11(10), 1825–1830 RSC.
- N. Nam-Trung, H. Xiaoyang and T. K. Chuan, Mems-micropumps: a review, Trans. ASME, 2002, 124, 384–392 Search PubMed.
- C. Y. Lee, H. T. Chang and C. Y. Wen, A MEMS-based valveless impedance pump utilizing electromagnetic actuation, J. Micromech. Microeng., 2008, 18(3), 035–044 Search PubMed.
- V. Tandon, W. S. Kang, T. A. Robbins, A. J. Spencer, E. S. Kim, M. J. McKenna, S. G. Kujawa, J. Fiering, E. E. Pararas, M. J. Mescher and W. F. Sewell, Microfabricated reciprocating micropump for intracochlear drug delivery with integrated drug/fluid storage and electronically controlled dosing, Lab Chip, 2016, 16(5), 829–846 RSC.
- C. Yamahata, C. Lotto, E. Al-Assaf and M. A. M. Gijs, A PMMA valveless micropump using electromagnetic actuation, Microfluid. Nanofluid., 2005, 1(3), 197–207 CrossRef.
- A. J. Mäki, S. Hemmilä, J. Hirvonen, N. N. Girish, J. Kreutzer, J. Hyttinen and P. Kallio, Modeling and experimental characterization of pressure drop in gravity-driven microfluidic systems, J. Fluids Eng., 2015, 137(2), 021105 CrossRef.
- R. Gorkin, J. Park, J. Siegrist, M. Amasia, B. S. Lee, J. M. Park, J. Kim, H. Kim, M. Madou and Y. K. Cho, Centrifugal microfluidics for biomedical applications, Lab Chip, 2010, 10(14), 1758–1773 RSC.
- K. Domansky, W. Inman, J. Serdy, A. Dash, M. H. Lim and L. G. Griffith, Perfused multiwell plate for 3D liver tissue engineering, Lab Chip, 2010, 10(1), 51–58 RSC.
- C. Y. Chan, P. H. Huang, F. Guo, X. Ding, V. Kapur, J. D. Mai, P. K. Yuen and T. J. Huang, Accelerating drug discovery via organs-on-chips, Lab Chip, 2013, 13(24), 4697–4710 RSC.
- Y. S. Heo, L. M. Cabrera, J. W. Song, N. Futai, Y. C. Tung, G. D. Smith and S. Takayama, Characterization and resolution of evaporation-mediated osmolality shifts that constrain microfluidic cell culture in poly (dimethylsiloxane) devices, Anal. Chem., 2007, 79(3), 1126–1134 CrossRef CAS PubMed.
- J. F. Lo, E. Sinkala and D. T. Eddington, Oxygen gradients for open well cellular cultures via microfluidic substrates, Lab Chip, 2010, 10(18), 2394–2401 RSC.
- E. Ghafar-Zadeh, M. Sawan, E. Ghafar-Zadeh and M. Sawan, CMOS capacitive sensors for lab-on-chip applications, Springer, 2010, pp. 25–34 Search PubMed.
- D. C. Stillinger, M. J. Head, K. N. Helland and C. W. Van Atta, A closed-loop gravity-driven water channel for density-stratified shear flows, J. Fluid Mech., 1983, 131, 73–89 CrossRef.
- N. T. Nguyen, Micromachined flow sensors—a review, Flow Meas. Instrum., 1997, 8(1), 7–16 CrossRef.
- B. Kuczenski, P. R. LeDuc and W. C. Messner, Pressure-driven spatiotemporal control of the laminar flow interface in a microfluidic network, Lab Chip, 2007, 7(5), 647–649 RSC.
- M. F. A. Rahman, A. A. Manaf and M. R. Arshad, Capacitive effect of coplanar electrodes partially outside the microchannel region for underwater microfluidic-based sensor, 2013 Search PubMed.
- P. Wells, Capacitive fluid level sensor, US Pat. 5042299, IIMorrow, Inc., 1991.
- C. Elbuken, T. Glawdel, D. Chan and C. L. Ren, Detection of microdroplet size and speed using capacitive sensors, Sens. Actuators, A, 2011, 171(2), 55–62 CrossRef CAS.
- J. Shih, J. Xie and Y. C. Tai, Surface micromachined and integrated capacitive sensors for microfluidic applications, in TRANSDUCERS, Solid-State Sensors, Actuators and Microsystems, 12th International Conference, IEEE, 2003, vol. 1, pp. 388–391 Search PubMed.
- E. Ghafar-Zadeh and M. Sawan, A hybrid microfluidic/CMOS capacitive sensor dedicated to lab-on-chip applications, IEEE Trans. Biomed. Circuits Syst., 2007, 1(4), 270–277 CrossRef CAS PubMed.
- Z. W. Wei, M. Qin and Q. A. Huang, A Novel 2-D Capacitive Silicon Flow Sensor, in Sensors, 2007 IEEE, IEEE, 2007, pp. 888–891 Search PubMed.
- X. B. Li, S. D. Larson, A. S. Zyuzin and A. V. Mamishev, Design principles for multichannel fringing electric field sensors, IEEE Sens. J., 2006, 6(2), 434–440 CrossRef.
- C. S. Walker, Capacitance, inductance, and crosstalk analysis, Artech House, 1990 Search PubMed.
- J. Wang, Liquid level sensing using capacitive-to-digital converters, Analog Dialogue, 2015, 49(4), 1–3 CrossRef.
- C. S. Walker, Capacitance, Inductance and Crosstalk Analysis, Artech House, 1990, ISBN: 978-0890063927 Search PubMed.
- T. Kassis, P. M. Perez, C. J. W. Yang, L. R. Soenksen, D. L. Trumper and L. G. Griffith, MICCS: A Fully Programmable Multipurpose Integrated Cell Culture System, bioRxiv 192047, DOI:10.1101/192047.
- W. Inman, K. Domansky, J. Serdy, B. Owens, D. Trumper and L. G. Griffith, Design, modeling and fabrication of a constant flow pneumatic micropump, J. Micromech. Microeng., 2007, 17(5), 891 CrossRef.
- L. A. Godwin, K. S. Deal, L. D. Hoepfner, L. A. Jackson and C. J. Easley, Measurement of microchannel fluidic resistance with a standard voltage meter, Anal. Chim. Acta, 2013, 758, 101–107 CrossRef CAS PubMed.
- S. Attiya, et al., Design of an interface to allow microfluidic electrophoresis chips to drink from the fire hose of the external environment, Electrophoresis, 2001, 22, 318–327 CrossRef CAS PubMed.
- D. Kim, N. C. Chesler and D. J. Beebe, A method for dynamic system characterization using hydraulic series resistance, Lab Chip, 2006, 6, 639 RSC.
- H. J. Kim, D. Huh, G. Hamilton and D. E. Ingber, Human gut-on-a-chip inhabited by microbial flora that experiences intestinal peristalsis-like motions and flow, Lab Chip, 2012, 12, 2165–2174 RSC.
- P. Buchling and S. Kandlikar, Enhanced flow boiling of ethanol in open microchannels with tapered manifolds in a gravity-driven flow, J. Heat Transfer, 2016, 138(3), 031503 CrossRef.
- S. Takayama, J. Chang, D. Huh, X. Zhu, B. Cho and G. D. Smith, Microfluidic gravity pump with constant flow rate, US Pat. 7704728, The University of Michigan, 2010.
- S. J. Kim, X. Zhu and S. Takayama, Gravity-Driven Fluid Pumping and Cell Manipulation, in Microtechnology for Cell Manipulation and Sorting, Springer International Publishing, 2017, pp. 175–192 Search PubMed.
- D. W. Lee, S. H. Yi, B. Ku and J. Kim, A pumpless perfusion cell culture cap with two parallel channel layers keeping the flow rate constant, Biotechnol. Prog., 2012, 28(6), 1466–1471 CrossRef CAS PubMed.
- D. C. Stillinger, M. J. Head, K. N. Helland and C. W. Van Atta, A closed-loop gravity-driven water channel for density-stratified shear flows, J. Fluid Mech., 1983, 131, 73–89 CrossRef.
- S. K. Ali and J. F. Foss, A computer controlled, finite duration “steady” flow facility, Exp. Fluids, 1995, 19(4), 250–254 CrossRef.
- D. G. Belair, et al., Human vascular tissue models formed from human induced pluripotent stem cell derived endothelial cells, Stem Cell Rev., 2015, 11, 511–525 CrossRef CAS PubMed.
Footnote |
| † Electronic supplementary information (ESI) available. See DOI: 10.1039/c7lc01223c |
| This journal is © The Royal Society of Chemistry 2018 |

