Tuning the separation performance of hydrogen permeable membranes using an anion doping strategy
Li
Chen
,
Libin
Zhuang
,
Jian
Xue
*,
Yanying
Wei
and
Haihui
Wang
 *
*
School of Chemistry and Chemical Engineering, South China University of Technology, No. 381 Wushan Road, Guangzhou 510640, China. E-mail: hhwang@scut.edu.cn; xuejian@scut.edu.cn
First published on 6th September 2017
Abstract
Overcoming the dilemma between hydrogen permeability and stability is critical for realizing the widespread application of mixed protonic–electronic conducting (MPEC) membranes. Herein, fluoride-anion doping is for the first time reported for tuning the separation performance of MPEC membranes. Lanthanum tungstate oxyfluoride membranes, La5.5W0.6Mo0.4O11.25−δFx (x = 0, 0.025, 0.05, 0.10, 0.20, 0.50), exhibit improved hydrogen permeability and enhanced stability compared to their parent oxides, achieving a maximum value of 0.20 mL min−1 cm−2 at x = 0.05. Moreover, the declining hydrogen permeability performance of lanthanum tungstate MPEC membranes during high-temperature operation was systematically analyzed and relative solutions are put forward. The anion-doping and stability-improving strategies might accelerate the development and future practical applications of MPEC membranes.
Introduction
Nowadays, more than 90% of hydrogen is obtained from hydrocarbon reforming and pyrolysis.1,2 The produced hydrogen is normally mixed with CO2, CO and H2O; thus, it is essential to separate and purify hydrogen from these gas mixtures using appropriate technologies. Cryogenic distillation, pressure swing adsorption (PSA) and membrane separation are common hydrogen separation and purification methods.3 Among them, membrane technology enjoys increasing interest due to its potential for continuous operation and coupling with other reaction processes.3,4In the past several decades, many developments have been achieved for hydrogen separation membranes in terms of the materials used, ranging from polymers to inorganic membranes.5–11 Dense ceramic mixed proton–electron conducting (MPEC) membranes possess 100% hydrogen selectivity in theory because hydrogen is separated as protons instead of molecules.12 Currently, the state-of-art MPEC ceramics are perovskite-type cerate and zirconate-based solid solutions (ACeO3−δ and AZrO3−δ (A = Ca, Sr, Ba)).13–16 ACeO3−δ has a high proton conductivity but poor chemical stability in a moist CO2 atmosphere. AZrO3−δ possesses better chemical stability, but the total conductivity is relatively low. Additionally, lanthanum tungstate and its related compositions have attracted considerable attentions during the past few years due to their stability in CO2-containing atmospheres, while their protonic conductivities are only approximately 1 mS cm−1.17–22 For practical applications, both high conductivity and good stability are urgently required. Consequently, the reported MPEC materials have a dilemma because a compromise should be reached between the conductivity and the stability.
Previously, in order to optimize the conductivity and the stability of MPEC materials, many equivalent or/and aliovalent substitutions on cation sites have been successfully carried out. For instance, in perovskite-type materials, Ce4+ sites had been partially substituted with Zr,13,16,23,24 Ta,25 Y,15,26–28 Yb,29,30 Tm,31 Nd,32,33 Sm,34 Gd,35 and other rare earth cations.
In lanthanum tungstate oxides (LWOs), the partial substitution of La3+ sites with Zr2+ or Ca2+ and the replacement of W6+ with Nb5+, Re5+ or Mo6+ have been used to develop dense ceramic MPEC membranes, among which 40% Mo substitution in LWO is the optimized composition.20,36–39 For instance, the conductivity of undoped La5.5WO11.25−δ is approximately 0.003 S cm−1, while it increases to 0.043 S cm−1 at 900 °C when substituting W with 40% Mo.40 Moreover, a high hydrogen permeation flux up to 1.36 mL min−1 cm−2 was obtained for a U-shaped La5.5W0.6Mo0.4O11.25−δ hollow-fiber membranes at 975 °C when a mixture of 80% H2–20% He was used as the feed gas and the sweep side was humidified.20 Although the cation substitutions could enhance the conductivity or stability to some extent, it is still difficult to fulfill the requirements of industrial applications.
Aside from cation doping, anion doping in oxygen lattices is also an effective way to modify the properties of MPEC materials. Recently, Shao and his group reported an attractive performance of perovskite-type materials as oxygen reduction electrodes by embedding F− in oxygen sites.41 Jin et al. found that F-doped perovskite membranes exhibited enhanced oxygen permeation flux at low temperature.42 Lacorre and co-workers synthesized and characterized F-doped La2Mo2O9 and presented modified transport properties.43 Therefore, the partial occupation of anions at the oxygen sites could tune the properties of the materials. With the aim of developing MPEC membrane materials with sufficient protonic conductivity and considerable stability to achieve hydrogen separation at high temperatures, we have prepared fluoride anion-doped lanthanum tungstate membranes (La5.5W0.6Mo0.4O11.25−δFx, where x = 0, 0.025, 0.05, 0.10, 0.20, and 0.50) for the first time, and the effects of fluorine substitution on the lattice structure, redox stability and hydrogen permeability were investigated in detail.
Experimental
Powder synthesis and membrane preparation
The series of La5.5W0.6Mo0.4O11.25−δFx powders (x = 0, 0.025, 0.05, 0.10, 0.20, 0.50, and 1.0) were all prepared using a traditional solid-state reaction method with stoichiometric amounts of La2O3, WO3, MoO3 and LaF3. Lanthanum oxide was heated at 1000 °C for 2 h for decarbonation and dehydration before using. The initial powders were mixed in an agate mortar and ball milled for 10 h in the presence of acetone. A subsequent thermal treatment was carried out in an alumina crucible at 900 °C for 10 h. After completion, the powders were ground and pressed into pellets. Then, the pellets were heated in air at 1500 °C for 10 h with a heating and cooling rate of 2 °C min−1 to attain dense membranes. The densities of the sintered disks were determined to be higher than 95% of the theoretical density using the Archimedes method in ethanol. Only those with relative densities higher than 95% were used for hydrogen permeation studies.Characterization
The sintered La5.5W0.6Mo0.4O11.25−δFx disks were characterized using X-ray diffraction (XRD, Bruker D8 Advance and Cu Kα radiation) within the 2θ range from 10° to 80° to confirm the structures. The patterns were analyzed using Total Pattern Solution (TOPAS) software to calculate the cell parameters and volume.The microstructures of the fresh and spent La5.5W0.6Mo0.4O11.25−δF0.05 membranes were observed by scanning electron microscopy (SEM) using a Hitachi SU 8220 at an excitation voltage of 2 kV. The elemental compositions of the membranes were determined by energy dispersive X-ray spectroscopy (EDXS, Horiba, X-MaxN detector) with an ultrathin window at an excitation voltage of 15 kV.
X-ray photoelectron spectroscopy (XPS) analyses of fresh La5.5W0.6Mo0.4O11.25−δFx membranes and the spent La5.5W0.6Mo0.4O11.25−δF0.05 membrane were performed on a Thermo Fisher Scientific ESCALAB 250Xi spectrometer.
For conductivity tests, two parallel silver wires were bound to the sintered pellets (bars with dimensions ≈10 × 1 × 5 mm) with a silver paste for better contact. After being calcined at 600 °C in air for 2 h, the samples were heated from 50 °C to 900 °C in wet 10% H2–90% Ar atmospheres with a ramp rate of 5 °C min−1, and the resistance was measured in the 600–900 °C temperature range by using an electrochemical workstation (Zahner IM6ex, German) using a dc two-probe method.
Temperature-programmed reduction (TPR) tests of the La5.5W0.6Mo0.4O11.25−δ and La5.5W0.6Mo0.4O11.25−δF0.05 powders sintered at 1500 °C were carried out by using a chemisorption analyzer (Micromeritics AutoChem II). The powders were pretreated under a dry Ar flow for half an hour and then subjected to reduction under a dry 10% H2/Ar flow from 50 °C to 900 °C with a heating rate of 10 °C min−1.
Hydrogen permeation measurements
The hydrogen permeation fluxes of the La5.5W0.6Mo0.4O11.25−δFx membranes were measured using a homemade corundum reactor following the same methodology as reported elsewhere.17,18 All the membranes used for the permeation measurements were 0.5 mm-thick gastight disks with a diameter of 13.4 mm sintered at 1500 °C and sealed in the corundum reactor by using a glass ring. Hydrogen was separated from a mixture gas consisting of 50% H2–50% He with a total flow rate of 80 mL min−1, and Ar was used as the sweep gas with 30 mL min−1. The flow rates of the effluents were measured by using a soap bubble flow meter. A gas chromatograph with a 13X molecular sieve column and thermal conductivity detector (TCD) (GC, Agilent Technologies, 7890A) was connected to the permeation apparatus to detect the composition of the effluents online. The leakage of the hydrogen due to the imperfect sealing at high temperatures was less than 5% during all experiments. Then, the hydrogen permeation fluxes are calculated as follows:where CH2feed and CfeedHe are the hydrogen concentration and helium concentration on the shell side, respectively, which were adjusted by using mass-flow controllers. The CH2 and CHe are the hydrogen concentration and helium concentration on the sweep side, respectively, which were calculated using a GC instrument, F denotes the flow rate of the exhaust stream, which was measured using a soap flow meter, and S denotes the effective membrane area.
Results and discussion
Characterization of the materials
The X-ray diffraction (XRD) patterns of the La5.5W0.6Mo0.4O11.25−δFx (hereafter labelled LWMFx, x = 0, 0.025, 0.05, 0.10, 0.20, 0.50, and 1.0) materials sintered in air at 1500 °C are shown in Fig. 1(a). The substitution of O2− with F− does not change the crystal symmetry of the compounds; the cubic fluorite structures are retained when lower quantities of F were doped, namely x ≤ 0.2.21 In contrast, when the F concentration is further increased, i.e., x = 1.0, the compound is not a single phase and contains additional phases identified as La6MoO12.39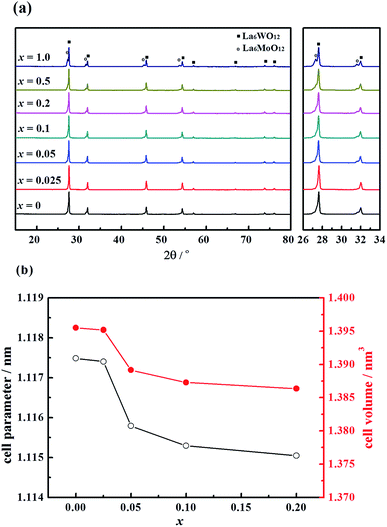 | ||
| Fig. 1 (a) X-ray diffraction patterns and (b) the cell parameter and the cell volume of the La5.5W0.6Mo0.4O11.25−δFx membranes sintered at 1500 °C. | ||
The cell parameters and volume of the single-phase LWMFx compounds have been calculated based on the XRD results, as shown in Fig. 1(b). The Rietveld refinement results suggest that the LWMFx (x ≤ 0.2) samples possess a cubic structure and a space group of F![[4 with combining macron]](https://www.rsc.org/images/entities/char_0034_0304.gif) 3m.19 The unit cell parameters for the LWMFx series slightly decrease with increasing fluorine content due to the lower ionic radius of F− (1.33 Å) than that of O2− (1.40 Å).44
3m.19 The unit cell parameters for the LWMFx series slightly decrease with increasing fluorine content due to the lower ionic radius of F− (1.33 Å) than that of O2− (1.40 Å).44
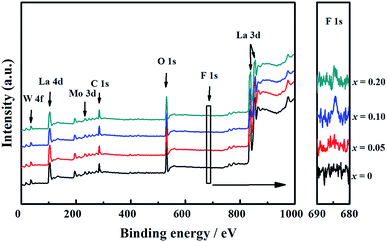
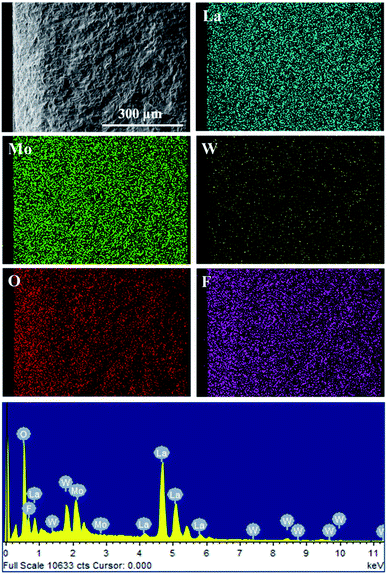
The presence of La, W, Mo, O, and F elements in the LWMFx (x ≤ 0.2) samples was confirmed using X-ray photoelectron spectra. As shown in Fig. 2, the peaks at the bonding energies of approximately 35 eV, 232 eV, 531 eV, 685 eV and 836 eV are assigned to the W 4f, Mo 3d, O 1s, F 1s and La 3d peaks, respectively.45 In particular, the LWMF0.05 membrane was selected to be characterized using SEM and EDXS tests (Fig. 3), which indicated the uniform distribution of the existing elements in the LWMF0.05 sample without evident segregation. The theoretical values of the elements in the LWMF0.05 membrane and the EDXS analysis results are listed in Table 1. The fluorine content of the sintered LWMF0.05 membrane was further confirmed using a fluoride ion-selective electrode method. The actual x value of the LWMF0.05 sample from the tests is 0.047, which is approximately the theoretical value.
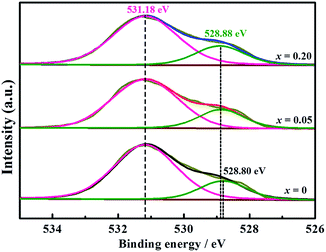
Furthermore, XPS tests through LWMFx (x = 0, 0.05, 0.2) materials were carried out to study the influence of fluorine doping on the metal–oxygen bond energy (Fig. 4). The peak with a lower binding energy corresponds to the lattice oxygen, while the peak with the higher energy corresponds to the oxygen species absorbed on the surface.46,47 The O 1s binding energy of the surface oxygen species is 531.18 eV for all original and F-doped samples, while the binding energy for the lattice oxygen of LWMF0.05 and LWMF0.2 slightly shift (0.08 eV) toward a higher binding energy compared to that of the original samples. Similar results were also observed in La1−xSrxFeO3−δFσ and Ca0.37Sr0.63CuO2−δFσ.48,49 The increased bonding energy of the lattice oxygen in the F-doped compounds is attributed to the stronger electronegativity of F− (3.98) than that of O2− (3.44). Thus, the fluoride ions attract more valence electrons from the metal ions than the oxygen ions, resulting in the decrease in the valence electron density of O2−, which weakening the metal–oxygen bonds and consequently increase the mobility of the lattice oxygen and protons.
Hydrogen permeability
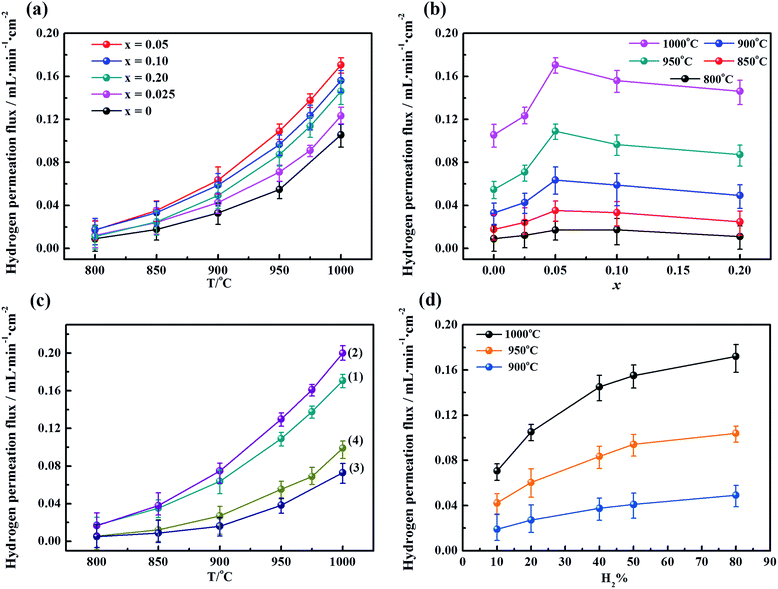
To determine the influence of the fluorine content on the hydrogen permeability, the hydrogen permeation fluxes of the LWMFx membranes were studied in the temperature range from 800 °C to 1000 °C. As shown in Fig. 5(a), the hydrogen permeation fluxes increase with increasing temperature for all membranes due to the enhancement in the hydrogen bulk diffusion and hydrogen surface reaction rates.13,20 In addition, the corresponding hydrogen permeation fluxes first increase and then decrease as a function of the fluorine concentration at the same temperature, and the peaks all appear at x = 0.05, as shown in Fig. 5(b). The appropriate introduction of the fluoride ions promotes the mobility of protons as a result of a decrease in the electron density of oxygen. Consequently, the protonic conductivity and hydrogen permeation fluxes of the membranes are improved. However, when the fluorine content is beyond the limit, the excess fluoride ions occupy the oxygen vacancies,50 which somehow limits the proton transfer. Therefore, the hydrogen permeation of the LWMFx (x ≤ 0.2) membranes increases during the early stage and then decreases.Previously, Haugsrud and Norby have reported that protonic conductivity is the predominant conductivity of rare-earth tungstates in wet hydrogen atmospheres up to 800 °C, while electronic conductivity takes over at higher temperature.51,52 To further confirm the effect of fluoride on protonic conductivity, the conductivity of LWMF0 and LWMF0.05 disks was studied as a function of temperature (600–900 °C) in wet hydrogen. As shown in Fig. 6, the conductivity of LWMF0.05 is greater than that of LWMF0 under wet hydrogen atmospheres below 800 °C, indicating the enhancement in the protonic conductivity by fluorine doping. With a further increase in temperature to 900 °C, the difference between the LWMF0.05 and LWMF0 becomes smaller gradually as electronic conductivity comes into play, which indicates their similar electronic conductivity (at 900 °C).
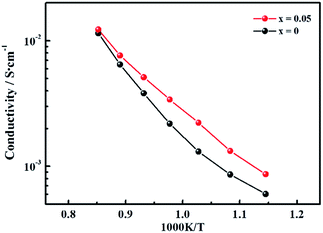 | ||
| Fig. 6 Conductivity as a function of temperature plotted in the Arrhenius form under a wet (pH2O = 0.025 atm) 10% hydrogen in argon atmosphere for LWMF0 and LWMF0.05 specimens. | ||
At an optimized F-doping concentration, the LWMF0.05 membrane exhibits the highest hydrogen permeability. Thus, LWMF0.05 was selected to perform hydrogen permeation measurements as a function of temperature under four different reducing environments: (1) with a dry atmosphere on both sides (feed and permeate sides) of the membrane, (2) with only the sweep side humidified (pH2O = 0.025 atm), (3) with only the feed side humidified (pH2O = 0.025 atm) and (4) with a wet atmosphere on both sides. The notable effects of the steam on the hydrogen permeation flux are shown in Fig. 5(c). The hydrogen permeation flux of LWMF0.05 under condition (1) reaches a maximum value of 0.17 mL min−1 cm−2 at 1000 °C. Nevertheless, the flux suffers a sharp slump when the feed side is humidified (condition 3). This result is attributed to the occupation of the hydrogen adsorption sites on the surface of the membrane by water vapour, which seriously hindered the hydrogen transport in this case. However, the hydrogen permeation flux increased to 0.20 mL min−1 cm−2 when the sweep side is humidified (condition 2) due to the additional hydrogen production from water splitting and the improved protonic conductivity.53 The improved protonic conductivity is ascribed to the additional formation of protonated oxygen atoms or ions (the essential charge carriers in MPEC membranes), which result from the reaction between water and oxygen vacancies or/and lattice oxygen.19 In addition, the LWMF0.05 hydrogen permeation flux using the wet atmosphere on both sides combine the advantages of condition (2) and the disadvantages of condition (3) and exhibit a slightly higher hydrogen permeation flux than that observed under condition (3). Similar phenomena are also observed in the La5.5W0.8Mo0.2O11.25−δ and La5.5W0.8Re0.2O11.25−δ membranes.38
Subsequently, the dependence of the hydrogen permeation fluxes on the concentrations of hydrogen on the feed side at three different temperatures was also studied using the LWMF0.05 membrane. The total flow rate of the feed gases was kept at 80 mL min−1. Fig. 5(d) shows that the hydrogen permeation flux increases with both temperature and the hydrogen concentration in the feed stream, similar to the previously reported results for La5.5WO11.25−δ, Nd5.5W0.5Re0.5O11.25−δ and (Nd5/6La1/6)5.5WO11.25−δ.53–55 The improved hydrogen permeation flux can be attributed to the increased hydrogen partial pressure gradient across the membrane with increasing hydrogen concentration on the feed side, leading to an enhanced hydrogen permeation driving force.
Stability study
To evaluate the long-term stability, the hydrogen permeation fluxes were measured as a function of time for the LWMF0 and LWMF0.05 membranes at 900 °C, 950 °C and 1000 °C sequentially. As shown in Fig. 7(a), the hydrogen permeation flux of LWMF0.05 remains relatively stable at 900 °C. When the temperature increases to 950 °C, the hydrogen permeation flux increases to approximately 0.10 mL min−1 cm−2 as expected, while it declines sharply by 46.12% in 50 h. After further increasing the temperature to 1000 °C, the hydrogen permeation flux only slightly increases and does not reach the expected value (0.17 mL min−1 cm−2), and the downward trend continues with time.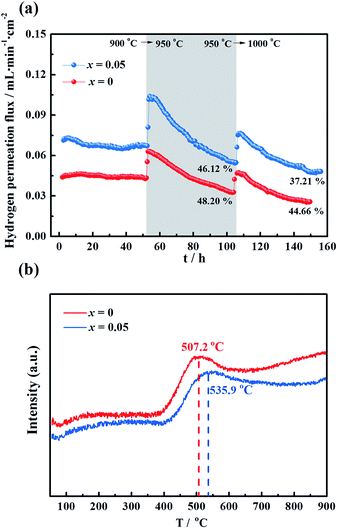 | ||
| Fig. 7 (a) Hydrogen permeation fluxes for the La5.5W0.6Mo0.4O11.25−δF0.05 membrane under dry conditions as a function of time at three temperatures: 900 °C, 950 °C and 1000 °C. Conditions (condition 1 in Fig. 5): F50% H2+50% He = 80 mL min−1, FAr = 30 mL min−1. Membrane thickness: 0.5 mm. (b) Temperature programmed reduction profile of La5.5W0.6Mo0.4O11.25−δ and La5.5W0.6Mo0.4O11.25−δF0.05 powders sintered at 1500 °C. | ||
The un-doped LWMF0 membrane exhibits a similar hydrogen permeation flux to that of LWMF0.05 during the long-term test, while it suffers a greater percentage of decline, suggesting its weaker redox stability, as demonstrated by the temperature programmed reduction (TPR) results shown in Fig. 7(b). The TPR experiments were performed under a dry 10% H2/Ar flow from 50 °C to 900 °C to study the reduction behaviour of the LWMF0 and LWMF0.05 compounds. The TPR curves plotted in Fig. 7(b) show well-defined reduction peaks at approximately 500 °C, revealing that both LWMF0 and LWMF0.05 suffer from an appreciable reduction process. The reduction peak corresponding to LWMF0.05 appears at a higher temperature than that of LWMF0, suggesting the slightly stronger redox stability of LWMF0.05.
To thoroughly investigate the causes of the hydrogen permeation flux attenuation, XPS tests were performed using the LWMF0.05 membrane samples before and after the hydrogen permeation tests to study the oxidation states of the elements, as shown in Fig. 8 and 9. The results from the analysis show that the binding energy values for the La 3d and W 4f lines fit the XPS databases well and could be assigned to La3+ and W6+, respectively.44 As there are no obvious chemical shifts or changes in the peak shapes, it can be concluded that La3+ and W6+ are not affected during the hydrogen permeation process. Moreover, Fig. 8(a) shows the Mo 3d peaks of the fresh, spent and oxidized membranes. The Mo5+ peaks at 231.0 eV and 234.58 eV are more distinct for the spent membrane, indicating the strong effect of the hydrogen treatment on Mo6+, which is in agreement with a recent study in which Mo6+ reduction was observed in La5.4W0.7Mo0.3O11.1−δ and Nd5.5W0.5Mo0.5O11.25−δ using XPS.56,57 This finding can be correlated with the loss of the lattice oxygen of the spent sample in the O 1s spectrum at 528.88 eV (Fig. 9(b)).
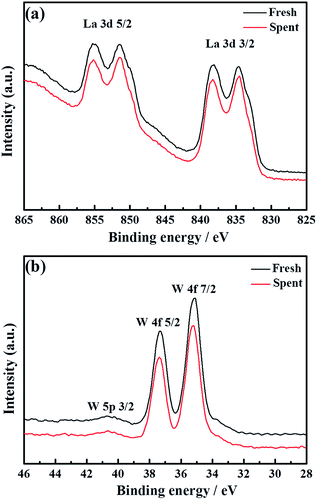 | ||
| Fig. 8 La 3d (a) and W 4f (b) superimposed XPS spectra of fresh and spent La5.5W0.6Mo0.4O11.25−δF0.05 membranes. | ||
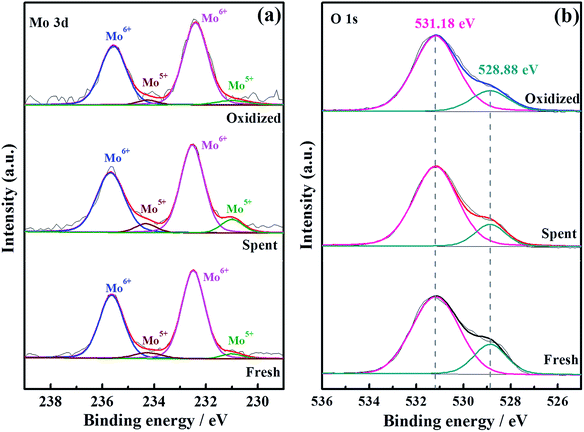 | ||
| Fig. 9 Mo 3d (a) and O 1s (b) XPS spectra of fresh, spent and oxidized La5.5W0.6Mo0.4O11.25−δF0.05 membranes. | ||
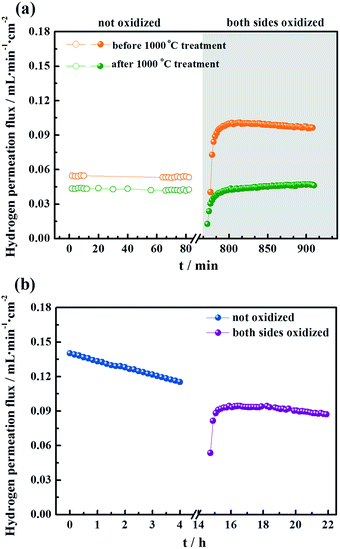
These results suggest that the decrease of the hydrogen permeation flux at elevated temperatures might have been due to the reduction of Mo6+. Thus, it is expected that the decreased fluxes could be restored to their original values after oxidization. Herein, when the hydrogen permeation flux of the LWMF0.05 membrane at 950 °C dropped to approximately 0.05 mL min−1 cm−2, the feed hydrogen flow was stopped and dry air was applied to oxidize the both sides of the membrane for 10 h. Then, the hydrogen permeation test was restarted. As shown in Fig. 10(a), the hydrogen permeation flux returned to approximately 0.10 mL min−1 cm−2 (orange line), which is slightly lower than the best hydrogen permeation flux of the LWMF0.05 membrane at 950 °C. After conducting a 30 h hydrogen permeation test at 1000 °C, the above oxidization procedure was repeated when the temperature cooled down to 950 °C. However, the hydrogen permeation flux remains at a low level and could not reach the initial value (the green line). In addition, to study the oxidization effect at a high temperature, the hydrogen permeation measurement was performed again at 1000 °C after 10 h of oxidization on both sides of the LWMF0.05 membrane. Different from the case at 950 °C, the hydrogen permeation flux could not recover to its original value, and the attenuation trend cannot be repressed (Fig. 10(b)). The above findings suggest that the diminished hydrogen permeation flux at the elevated temperature might have resulted from both the Mo6+ reduction and volatilization. In other words, the reversible process at 950 °C is the result of Mo6+ reduction, while the irreversible process at 1000 °C is mainly attributed to the vaporization of Mo. Similarly, Mo diffusion behaviours were observed in a few Mo-doped tungstate oxides after the permeation tests.58,59
To further investigate the volatilization of Mo, the structures, SEM morphologies, and elemental compositions of the fresh, spent and oxidized LWMF0.05 membranes were determined. Despite the possibility of Mo6+ reduction and volatilization, the samples maintain the fluorite structure after approximately 150 h of continuous hydrogen permeation testing, and obvious phase changes are not detected in the XRD patterns (Fig. 11(a)).
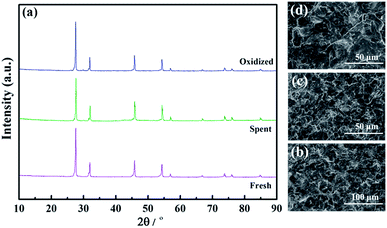 | ||
| Fig. 11 The X-ray diffraction patterns (a) and SEM morphologies of fresh (b), spent (c) and oxidized (d) La5.5W0.6Mo0.4O11.25−δF0.05 membranes. | ||
Additionally, similar microstructures are observed in the membrane cross sections, as shown in Fig. 11(b–d). The fresh membrane is dense with occluded porosity before the permeation measurements, and after the permeation measurements, the membrane remained completely dense. Finally, the elemental compositions of the LWMF0.05 disks obtained from EDXS tests are listed in Table 2. The fresh LWMF0.05 disk contains higher quantities of molybdenum than the spent disks, which further proves that the Mo evaporated during the high-temperature operation. The oxidized sample contains a higher level of Mo than the spent sample without oxidation, and the lower Mo content of the membrane surface compared to the bulk further suggests the occurrence of Mo evaporation during the long-term high-temperature hydrogen permeation operation. In summary, the LWMFx membranes exhibit stable hydrogen separation performance at 900 °C; undergo a reversible hydrogen permeability decline at 950 °C during Mo6+ reduction (which could be regenerated through simple oxidization in air); and experience an irreversible hydrogen permeability diminution due to both the Mo6+ reduction and the Mo vaporization at 1000 °C.
| Element | Atomic% | ||||||
|---|---|---|---|---|---|---|---|
| Fresh membrane | Spent membrane | Spent and oxidized membrane | |||||
| Feed side | Middle | Sweep side | Feed side | Middle | Sweep side | ||
| O | 63(5) | 60(5) | 62(5) | 62(5) | 61(5) | 62(5) | 64(5) |
| F | 2.9(6) | 3.2(6) | 2.9(6) | 2.1(6) | 2.1(6) | 3.1(6) | 2.9(6) |
| Mo | 2.0(3) | 1.9(3) | 2.4(3) | 2.4(3) | 2.7(3) | 2.8(3) | 2.8(3) |
| La | 28.0(2) | 31.5(2) | 29.3(2) | 30.2(2) | 30.7(2) | 29.0(2) | 27.1(2) |
| W | 4.0(5) | 3.6(5) | 3.1(5) | 3.1(5) | 3.1(5) | 2.7(5) | 2.8(5) |
Conclusions
A series of lanthanum tungstate oxyfluorides, La5.5W0.6Mo0.4O11.25−δFx (x = 0, 0.025, 0.05, 0.10, 0.20, and 0.50), were successfully prepared using a traditional solid-state reaction method. By doping an appropriate amount of fluorine (x = 0.05), the obtained La5.5W0.6Mo0.4O11.25−δF0.05 (LWMF0.05) membrane exhibits the highest hydrogen permeability at high temperatures (800–1000 °C) compared to the other F-doped compounds and their parent oxides. The influences of the feed gas concentration and humidification on the hydrogen permeability of LWMF0.05 are studied in detail. The reasons for the declining hydrogen permeation fluxes at high temperatures are systematically investigated, and the relative regeneration solutions are demonstrated. The fluoride-anion doping strategy and the hydrogen permeation flux regeneration method can boost the development of MPEC membranes and their practical applications in environmental and energy fields.Conflicts of interest
There are no conflicts to declare.Acknowledgements
The authors thank the financial support from the China Postdoctoral Science Foundation (No. 2017M612665), Fundamental Research Funds for the Central Universities (No. 2017BQ016), National Natural Science Foundation of China (No. 21536005, 51621001, 21606086, 21706076), Natural Science Foundation of Guangdong (2014A030312007), and Guangzhou Technology Project (No. 201707010317).Notes and references
- P. Nikolaidis and A. Poullikkas, Renewable Sustainable Energy Rev., 2017, 67, 597–611 CrossRef CAS.
- I. Dincer and C. Acar, Int. J. Hydrogen Energy, 2015, 4, 11094–11111 CrossRef.
- S. Adhikari and S. Fernando, Ind. Eng. Chem. Res., 2006, 45, 875–881 CrossRef CAS.
- R. W. Spillman, Chem. Eng. Prog., 1989, 85, 41–62 CAS.
- Z. Tao, L. Yan, J. Qiao, B. Wang, L. Zhang and J. Zhang, Prog. Mater. Sci., 2015, 74, 1–50 CrossRef CAS.
- S. Hossain, A. M. Abdalla, S. N. B. Jamain, J. H. Zaini and A. K. Azad, Renewable Sustainable Energy Rev., 2017, 79, 750–764 CrossRef CAS.
- Z. Zhang, Z. Yao, S. Xiang and B. Chen, Energy Environ. Sci., 2014, 7, 2868–2899 CAS.
- S. Wang, X. Li, H. Wu, Z. Tian, Q. Xin, G. He, D. Peng, S. Chen, Y. Yin, Z. Jiang and M. D. Guive, Energy Environ. Sci., 2016, 9, 1863–1890 CAS.
- B. Ghalei, Y. Kinoshita, K. Wakimoto, K. Sakurai, S. Mathew, Y. Yue, H. Kusuda, H. Imahoriae and E. Sivaniah, J. Mater. Chem. A, 2017, 5, 4686–4694 CAS.
- H. Li, A. Caravella and H. Y. Xu, J. Mater. Chem. A, 2016, 4, 14069–14094 CAS.
- J. S. Fish, S. Ricote, R. O'Hayre and N. Bonanos, J. Mater. Chem. A, 2015, 3, 5392–5401 CAS.
- K. D. Kreuer, Annu. Rev. Mater. Res., 2003, 33, 333–359 CrossRef CAS.
- E. Rebollo, C. Mortalò, S. Escolástico, S. Boldrini, S. Barison, J. M. Serra and M. Fabrizio, Energy Environ. Sci., 2015, 8, 3675–3686 CAS.
- N. Danilov, J. Lyagaeva, A. Kasyanova, G. Vdovin, D. Medvedev, A. Demin and P. Tsiakaras, Ionics, 2017, 23, 795–801 CrossRef CAS.
- I. M. Hung, Y. J. Chiang, Y. H. Wang, J. S. C. Jang and S. W. Lee, Int. J. Hydrogen Energy, 2017, 42, 22149–22158 CrossRef CAS.
- Q. A. Islam, M. W. Raja and R. N. Basu, J. Am. Ceram. Soc., 2017, 100, 1360–1367 CrossRef CAS.
- S. Escolástico, C. Solís, R. Haugsrud, A. Magrasó and J. M. Serra, Int. J. Hydrogen Energy, 2017, 42, 11392–11399 CrossRef.
- H. Liu, Y. Chen, Y. Wei and H. Wang, Int. J. Hydrogen Energy, 2017, 42, 4208–4215 CrossRef CAS.
- Y. Chen, S. Cheng, L. Chen, Y. Wei, P. J. Ashman and H. Wang, J. Membr. Sci., 2016, 510, 155–163 CrossRef CAS.
- Y. Chen, Q. Liao, Z. Li, H. Wang, Y. Wei, A. Feldhoff and J. Caro, AIChE J., 2015, 61, 1997–2007 CrossRef CAS.
- A. Magrasó, C. Frontera, D. Marrero-López and P. Núñez, Dalton Trans., 2009, 46, 10273–10283 RSC.
- S. Escolástico, C. Solís, C. Kjølseth and J. M. Serra, Energy Environ. Sci., 2014, 7, 3736–3746 Search PubMed.
- K. Katahira, Y. Kohchi, T. Shimura and H. Iwahara, Solid State Ionics, 2000, 138, 91–98 CrossRef CAS.
- J. Song, B. Meng and X. Tan, Ceram. Int., 2016, 42, 13278–13284 CrossRef CAS.
- L. Bi, S. Zhang, S. Fang, Z. Tao, R. Peng and W. Liu, Electrochem. Commun., 2008, 10, 1598–1601 CrossRef CAS.
- H. Iwahara, H. Uchida, K. Ono and K. Ogaki, J. Electrochem. Soc., 1988, 135, 529–533 CrossRef CAS.
- G. Ma, T. Shimura and H. Iwahara, Solid State Ionics, 1999, 120, 51–60 CrossRef CAS.
- N. Sammes, R. Phillips and A. Smirnova, J. Power Sources, 2004, 134, 153–159 CrossRef CAS.
- H. Iwahara, Solid State Ionics, 1996, 86–88, 9–15 CrossRef CAS.
- M. Matsuka, R. Braddock and I. Agranovski, Solid State Ionics, 2007, 178, 1011–1019 CrossRef CAS.
- W. Yuan, L. Mao and L. Li, Chin. Chem. Lett., 2010, 21, 369–372 CrossRef CAS.
- J. Liu and A. S. Nowick, Solid State Ionics, 1992, 50, 131–138 CrossRef CAS.
- C. Zhang and H. Zhao, Solid State Ionics, 2010, 181, 1478–1485 CrossRef CAS.
- H. Iwahara, T. Yajima, T. Hibino and H. Ushida, J. Electrochem. Soc., 1993, 140, 1687–1691 CrossRef CAS.
- D. Medvedev, V. Maragou, T. Zhuravleva, A. Demin, E. Gorbova and P. Tsiakaras, Solid State Ionics, 2011, 182, 41–46 CrossRef CAS.
- R. Haugsrud and C. Kjølseth, J. Phys. Chem. Solids, 2008, 69, 1758–1765 CrossRef CAS.
- M. J. Zayas-Rey, L. dos Santos-Gómez, D. Marrero-López, L. León-Reina, J. Canales-Vázquez, M. A. G. Aranda and E. R. Losilla, Chem. Mater., 2013, 25, 448–456 CrossRef CAS.
- S. Escolástico, J. Seeger, S. Roitsch, M. Ivanova, W. A. Meulenberg and J. M. Serra, ChemSusChem, 2013, 6, 1523–1532 CrossRef PubMed.
- M. Amsif, A. Magrasó, D. Marrero-López, J. C. Ruiz-Morales, J. Canales-Vázquez and P. Núñez, Chem. Mater., 2012, 24, 3868–3877 CrossRef CAS.
- A. Magrasó and R. Haugsrud, J. Mater. Chem. A, 2014, 2, 12630–12641 Search PubMed.
- Z. Zhang, Y. Zhu, Y. Zhong, W. Zhou and Z. Shao, Adv. Energy Mater., 2017, 1700242 CrossRef.
- J. Zhu, G. Liu, Z. Liu, Z. Chu, W. Jin and N. Xu, Adv. Mater., 2016, 28, 3511–3515 CrossRef CAS PubMed.
- A. Arulraj, F. Goutenoire, M. Tabellout, O. Bohnke and P. Lacorre, Chem. Mater., 2002, 14, 2492–2498 CrossRef CAS.
- R. D. Shannon, Acta Crystallogr., Sect. A: Cryst. Phys., Diffr., Theor. Gen. Crystallogr., 1976, 32, 751–767 CrossRef.
- J. F. Moulder, W. F. Stickle, P. E. Sobol and K. D. Bomben, Handbook of X-ray Photoelectron Spectroscopy, Physical Electronics. Inc., USA, 1995 Search PubMed.
- S. H. Estemirova, A. V. Fetisov and V. B. Fetisov, J. Appl. Spectrosc., 2009, 76, 394–401 CrossRef CAS.
- H. Liu, Y. Wei, L. Huang and H. Wang, Funct. Mater. Lett., 2011, 4, 261–264 CrossRef CAS.
- H. X. Dai, C. F. Ng and C. T. Au, J. Catal., 2000, 189, 52–62 CrossRef CAS.
- H. X. Dai, H. He, C. F. Ng and C. T. Au, J. Mol. Catal. A: Chem., 2001, 171, 217–227 CrossRef CAS.
- K. Belova, S. Baskakova, C. Argirusis and I. Animitsa, Electrochim. Acta, 2016, 193, 63–71 CrossRef CAS.
- R. Haugsrud, H. Fjeld, K. R. Haug and T. Norby, J. Electrochem. Soc., 2007, 154, B77–B81 CrossRef CAS.
- R. Haugsrud, Solid State Ionics, 2007, 178, 555–560 CrossRef CAS.
- S. Escolástico, C. Solís, T. Scherb, G. Schumacher and J. M. Serra, J. Membr. Sci., 2013, 444, 276–284 CrossRef.
- S. Escolástico, S. Somacescu and J. M. Serra, Chem. Mater., 2014, 26, 982–992 CrossRef.
- S. Escolástico, M. Schroeder and J. M. Serra, J. Mater. Chem. A, 2014, 2, 6616–6630 Search PubMed.
- R. Hancke, Z. Li and R. Haugsrud, J. Membr. Sci., 2013, 439, 68–77 CrossRef CAS.
- S. Escolástico, S. Somacescu and J. M. Serra, J. Mater. Chem. A, 2015, 3, 719–731 Search PubMed.
- E. Vøllestad, C. K. Vigen and A. Magrasó, J. Membr. Sci., 2014, 461, 81–88 CrossRef.
- E. Vøllestad, T. Norby and R. Haugsrud, Solid State Ionics, 2013, 244, 57–62 CrossRef.
| This journal is © The Royal Society of Chemistry 2017 |


