 Open Access Article
Fringe instability in constrained soft elastic layers†
Shaoting
Lin‡
a,
Tal
Cohen‡
bc,
Teng
Zhang‡
ad,
Hyunwoo
Yuk
a,
Rohan
Abeyaratne
a and
Xuanhe
Zhao
*ac
aDepartment of Mechanical Engineering, Massachusetts Institute of Technology, Cambridge, MA 02139, USA. E-mail: zhaox@mit.edu
bSchool of Engineering and Applied Science, Harvard University, Cambridge, MA 02138, USA
cDepartment of Civil and Environmental Engineering, Massachusetts Institute of Technology, Cambridge, MA 02139, USA
dDepartment of Mechanical Engineering, Syracuse University, Syracuse, NY 13244, USA
First published on 4th October 2016
Abstract
Soft elastic layers with top and bottom surfaces adhered to rigid bodies are abundant in biological organisms and engineering applications. As the rigid bodies are pulled apart, the stressed layer can exhibit various modes of mechanical instabilities. In cases where the layer's thickness is much smaller than its length and width, the dominant modes that have been studied are the cavitation, interfacial and fingering instabilities. Here we report a new mode of instability which emerges if the thickness of the constrained elastic layer is comparable to or smaller than its width. In this case, the middle portion along the layer's thickness elongates nearly uniformly while the constrained fringe portions of the layer deform nonuniformly. When the applied stretch reaches a critical value, the exposed free surfaces of the fringe portions begin to undulate periodically without debonding from the rigid bodies, giving the fringe instability. We use experiments, theory and numerical simulations to quantitatively explain the fringe instability and derive scaling laws for its critical stress, critical strain and wavelength. We show that in a force controlled setting the elastic fingering instability is associated with a snap-through buckling that does not exist for the fringe instability. The discovery of the fringe instability will not only advance the understanding of mechanical instabilities in soft materials but also have implications for biological and engineered adhesives and joints.
1. Introduction
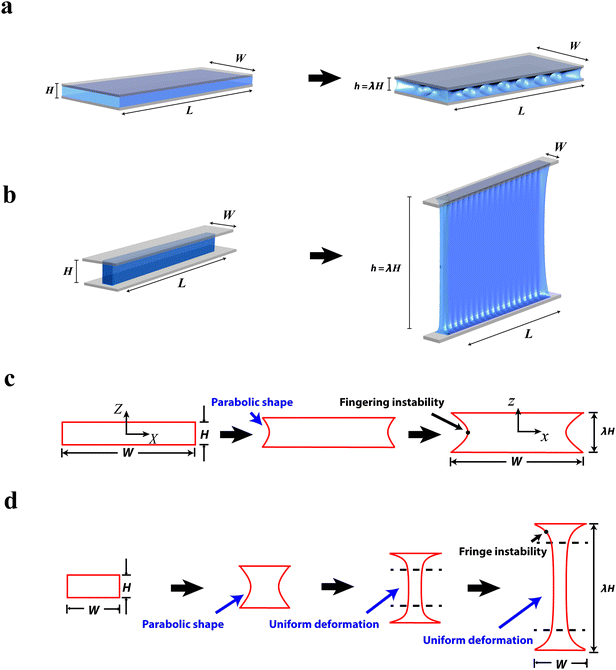
Soft elastic layers constrained between relatively rigid bodies appear in biological glues,1–4 joints5 and engineering applications including sealants, insulators, bearings, and adhesives.6,7 When the rigid bodies are pulled apart, the stressed layer can undergo various modes of mechanical instabilities due to a combination of the elastic layer's incompressibility, the mechanical constraints and the applied loads. For example, if the hydrostatic tensile stress in any region of the elastic layer reaches a critical value, a cavity can nucleate and grow in that region, leading to the cavitation instability.7–11 If the elastic layer partially debonds from the rigid body, the delaminated interface can undulate periodically to give the interfacial instability.12–16 Even if perfect bonding between the elastic layer and the rigid bodies is maintained, the exposed meniscus can become unstable, forming spatially periodic fingers of air that invade the elastic layer (Fig. 1a).17–19 Morphologically the elastic fingering instability resembles the viscous fingering instability in thin fluid layers;20–23 however, the elastic and viscous fingering follows different governing laws. Whereas the abovementioned instabilities have been intensively studied in cases where the layer's thickness is much smaller than its lateral dimensions (i.e., length and width), will any mechanical instability occur if the constrained layer's thickness is comparable to or larger than one lateral dimension (e.g., width)?Here we show that a constrained soft elastic layer with a comparable thickness and width can indeed undergo mechanical instability, which forms on its exposed surfaces but is localized at the constrained fringes of the layer (Fig. 1b). When subjected to tension, the middle portion of the layer elongates nearly uniformly but the constrained fringe portions of the layer deform nonuniformly. As the applied stretch reaches a critical value, the exposed surfaces of the fringe portions begin to undulate periodically without debonding from the rigid bodies, giving the fringe instability (Fig. 1b).
While both the fingering17,18 and fringe instabilities occur on the elastic layers' exposed surfaces, the two modes of instabilities are dramatically different. To quantitatively understand the fringe instability and its differences from fingering instability, we combine experiments, theory and numerical simulations to show that: (i) the deformed layer's meniscus, prior to fringe instability, is not parabolic as is the meniscus before fingering instability (Fig. 1c and d). (ii) In load-controlled elongations, the reported fingering instability is associated with a snap-through buckling, which manifests as peaks on the stress–strain curves for relatively thin samples.§ Such snap-through does not exist in relatively thick specimens, in which the fringe instability dominates. (iii) The critical applied stretch for the onset of fringe instability increases with the decrease of the layer's width–thickness ratio to a finite value of 3.9, which is associated with a constant nominal stress level of 3.8 times of the layer's shear modulus. (iv) The wavelength of the fringe instability scales with the elastic layer's width, but the wavelength of the fingering instability scales with the layer's thickness. The discovery of the fringe instability and quantitative comparisons between the fringe and fingering instabilities will advance the current understanding of mechanical instabilities in soft materials and biological adhesives capable of large deformation. Moreover, the fundamental differences in the mechanical response of constrained elastic layers that differ only by their dimensions are expected to be useful in the design and engineering of advanced adhesives and joints,6,24 as well as various sealants, insulators and bearings.
2. Experimental details and numerical simulations
Material preparation
To make a soft yet stretchable hydrogel sample, a precursor solution was prepared by mixing 5.5 mL 12 wt% acrylamide (Sigma, A8887), 4.1 mL 2.5 wt% alginate (Sigma, A2033), 500 μL 0.2 wt% N,N-methylenebisacrylamide (Sigma, 146072) as the crosslinker for polyacrylamide and 102 μL 0.2 M ammonium persulphate (Sigma, 248614) as an initiator for polyacrylamide. After degassing the precursor solution in a vacuum chamber, we added 8.2 μL N,N,N′,N′-tetramethylethylenediamine (Sigma, T7024-50M) as the crosslinking accelerator for acrylamide. The shear modulus of the hydrogel was measured to be 2 kPa, and negligible rate dependence with slight hysteresis was observed in the stress–strain response of the hydrogel under loading–unloading cycles (Fig. S1, ESI†).Experimental setup
The experimental setup used in the current study is illustrated schematically in Fig. 2. A layer of a soft yet stretchable hydrogel was robustly bonded onto two thick and transparent glass substrates.6 The width of the hydrogel layer W was varied from 3 mm to 37.8 mm and the thickness H from 1.5 mm to 6 mm, so that the width–thickness ratio of the elastic layer (W/H) was selected in a wide range from 0.5 to 25, in contrast to previous studies focusing on relatively thin sheets (e.g., W/H ≥ 517,18). The length of the layer L was fixed to 75 mm, so that L ≫ H in all experiments. During a typical test, the bottom glass substrate of the sample was fixed, and the top glass substrate was pulled upward at a speed of 30 mm min−1 without causing any lateral displacement, using a universal material test machine (2 kN load cell; Zwick/Roell Z2.5). The applied force was measured by the load cell, and the deformation of the layer's free surfaces was recorded using cameras viewing from two directions (e.g., top view, side view). Owing to the low modulus, high stretchability and negligible defects of the hydrogel25–28 and the robust hydrogel–glass interfaces (Fig. S2, ESI†),6 the cavitation and interfacial instabilities were suppressed in the current experiments. Depending on the width–thickness ratio of the elastic layer, the exposed free surfaces will deform into different meniscus shapes and then destabilize to exhibit the fingering or fringe undulation patterns (Fig. 1).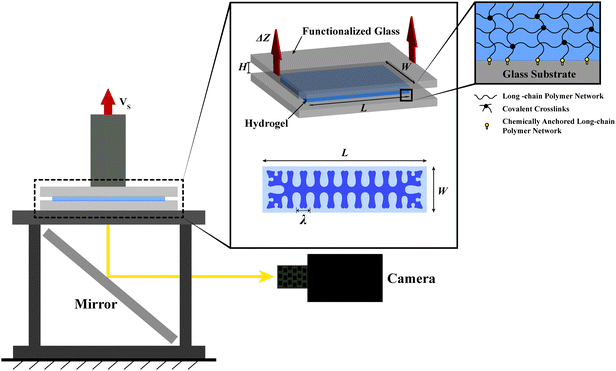 | ||
| Fig. 2 Schematic illustrations of the experimental setup for the observation of the elastic instabilities in constrained soft elastic layers. | ||
Measurement of the meniscus profile
Due to the constrained boundary, the meniscus profile at the visible edge is slightly larger than that in the center part of the sample. To clearly measure the meniscus profile in the center of the sample, we covered the transparent gel with an in-diffusible dye on the lateral free surface of the sample (shown in Fig. S3, ESI†). The reason why we chose an in-diffusible dye is to prevent the formation of a fuzzy boundary which may be induced by the diffusible dye.Numerical simulations
Numerical simulations to capture the deformation and instability of the elastic layer were carried out with the finite element method using ABAQUS/Explicit. Since the effect of water diffusion on the hydrogel is negligible during the time of deformation in the current study,15 the hydrogel was modeled as a nearly incompressible neo-Hookean material with shear modulus μ and bulk modulus K of 1 kPa and 200 kPa, respectively. This gives an effective Poisson's ratio of 0.497, which is shown to be sufficiently accurate in Fig. S4a (ESI†). All numerical models have the same dimensions as the experimental specimens. Symmetric boundary conditions were applied in the mid-plane along the thickness direction and all side surfaces were set to be stress free. A constant velocity along the upward direction was prescribed on the top surface of the elastic layer, and the bottom surface was fixed. A mass scaling technique was used to maintain a quasi-static loading process. The model was discretized with an 8-node linear brick, C3D8R element. The mesh size was taken as small as ∼1/10 of the smallest feature dimension for all samples (e.g., 0.05 mm for W/H < 2; 0.1 mm for 2 ≤ W/H ≤ 4 and 0.2 mm for W/H > 4) to ensure the accuracy of the simulation (Fig. S4b, ESI†).3. Results and discussion
In both experiments and simulations, the elastic layer with an initial thickness of H is deformed to the current thickness h, and the applied stretch is defined as λ = h/H. Fig. 1 schematically illustrates the qualitative differences between fingering and fringe instabilities, both of which occur on the exposed meniscus of elastic layers. If the layer is relatively thin or its width–thickness ratio is relatively high (e.g., W/H > 6), the deformed meniscus maintains a parabolic shape (Fig. 1c), until a spatially periodic pattern of fingers of air invades the meniscus at a critical applied stretch λc (Fig. 1a).17,18 On the other hand, if the layer's width is comparable with or lower than its thickness (e.g., W/H < 3), the middle portion of the layer elongates nearly uniformly but the constrained fringe portions deform non-uniformly under relatively high applied stretches (Fig. 1d). As the applied stretch reaches a critical value λc, the free surfaces of the fringe portions gradually begin to undulate into a periodic pattern while the middle portion of the layer maintains uniform elongation (Fig. 1b). An exact width–thickness ratio at which the transition between fingering and fringe instabilities occurs cannot be visually detected due to the geometrical similarity in the transition regime (3 < W/H < 6). Nevertheless, a clear transition point is observed in the stress-stretch response of the samples as will be explained in light of the experimental, numerical and theoretical results.3.1 Meniscus shape prior to instabilities
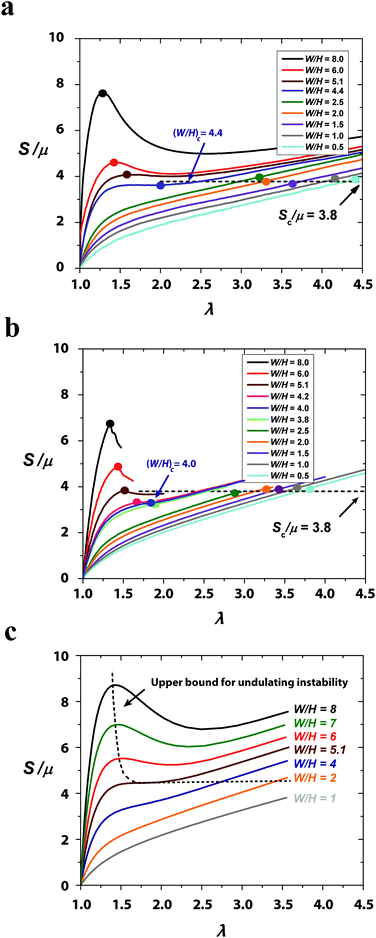
Fig. 3a and b show both experimental and simulation results for the meniscus shape of an elastic layer with comparable width and thickness (e.g., W/H = 2) under various levels of applied stretches, before the onset of any instability. (Due to the effects of front edges in experimental samples, the shape of the experimentally observed meniscus is highlighted by dashed lines. See Fig. S3, ESI† for details on determining the meniscus.) Under relatively low applied stretch (e.g., λ ≤ 1.25), the meniscus of the elastic layer follows the parabolic shape.29 However, as the applied stretch further increases (e.g. to λ = 1.5, 2), the middle portion of the meniscus elongates uniformly and the constrained fringe portions deform nonuniformly into a V shape (Fig. 3a and b). The shape of the highly-deformed meniscus significantly deviates from the parabolic shape assumed in previous studies on fingering instabilities.17,29 From Fig. 3a and b, it can be seen that the numerical model can accurately predict the evolution of the meniscus shape with the increasing stretch (i.e., from parabolic to non-parabolic). In addition, since the middle portion of the layer is uniformly elongated under high applied stretches (e.g., λ = 1.5, 2), there is no driving force for the formation of fingering instability in the middle portion of the layer in the sample.Instead, as the soft elastic layer (W/H = 2) is stretched to a critical point λc ≈ 3.2, the exposed surface of the fringe portions becomes unstable – beginning to undulate periodically while the middle portion of the layer maintains uniform elongation (Fig. 3c and Movies S1, S2, ESI†). If the applied stretch further increases, the undulation in the fringe portions increases in magnitude while maintaining a constant wavelength. The layer maintains adhering on the rigid bodies throughout the process of deformation and fringe instability (Fig. S2, ESI†). Once the applied stretch is relaxed, the elastic layer restores its undeformed state. Evidently, the fringe instability is qualitatively different from the fingering instability that occurs in relatively thin elastic layers (e.g., W/H = 8 in Fig. S5 and Movie S3, ESI†). Fig. 3d further shows that the numerical simulation can quantitatively predict the experimental observations of fringe instability. The simulation also confirms that the middle portion of the layer deforms almost uniformly while the fringe portions undergo the instability.
3.2 Theoretical model
Next, we will resort to theory and scaling laws to better understand the experimental and simulation results on the deformation and instabilities in constrained elastic layers with various aspect ratios. While existing studies on fingering instabilities are generally limited to relatively thin layers (e.g., W/H > 6) in which the meniscus shape is assumed to be parabolic17,30 (Fig. 1c), herein we develop a theory that accounts for the deformation of constrained elastic layers with a wide range of width–thickness ratios and is valid for exceedingly large deformations. Geometrically, the layer in the undeformed state occupies a region −W/2 < X < W/2, −∞ < Y < ∞ and −H/2 < Z < H/2, and a material particle in the layer is labeled by its coordinate (X,Y,Z) in the undeformed state (see Fig. S6, ESI†). In the deformed state, the material particle moves to a place of coordinates (x,y,z), which are functions of (X,Y,Z). We restrict the analysis to plane-strain deformation in the X–Z plane and, without loss of generality, the layer is taken to deform symmetrically with respect to the Z = 0 and X = 0 planes.We make a single assumption on the deformation of the layer, that is: any horizontal plane in the layer at the undeformed state remains planar upon deformation30 (see the simulation results in Fig. 3a for validation of the assumption). Based on the above assumption and the incompressibility of the elastic layer, we can express the deformation gradient of the layer as (see detailed derivation in the ESI†)
 | (1) |
The elastic layer is taken as a neo-Hookean material with strain energy density function  . By minimizing the elastic energy of the layer, the meniscus shape function is found to obey a first-order differential equation
 | (2) |
 | (3) |
Solving eqn (2) and (3) yields the meniscus shape function λX, deformation gradient F and elastic energy density Ψ of the layer as a function of the applied stretch λ. The total elastic energy of the layer per unit length in the Y direction, E, can then be calculated by integrating Ψ over the volume of the layer. We further define the averaged nominal stress applied on the layer as the applied force divided by the undeformed horizontal cross-section area, which can be calculated as
 | (4) |
Accordingly we can derive relations between the applied stretch λ, the applied nominal stress S and the meniscus shape λX for layers with a wide range of width–thickness ratios. In comparison with both experiments and simulations, it is found that the present analytical solution provides accurate predictions of the meniscus shape even for exceedingly high applied stretches and across the entire regime of specimen dimensions considered in this study. For example we show in Fig. 3b, the meniscus shape of a layer with W/H = 2 at applied stretch of λ = 2 given by the theory, experiments and numerical simulations. It can be seen that the theory can accurately predict the non-parabolic shape of a relatively thick layer (i.e., W/H = 2) under high stretches.
3.3. Transition between fingering and fringe instabilities
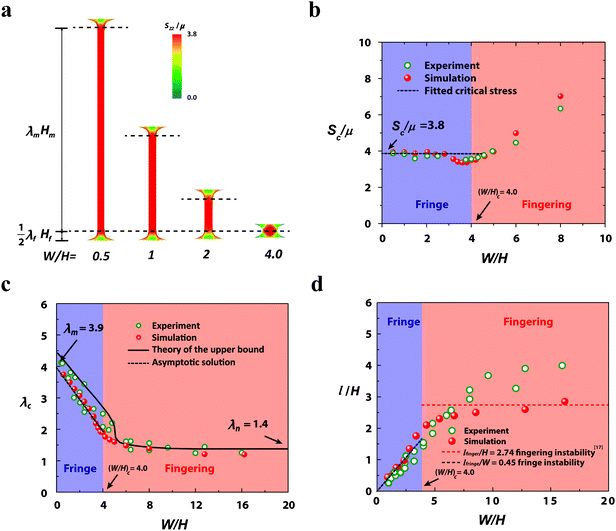
Fig. 4 gives the curves of applied nominal stress S vs. applied stretch λ for elastic layers with various width–thickness ratios (i.e., 0.5 ≤ W/H ≤ 8); obtained from experiments (Fig. 4a), numerical simulations (Fig. 4b) and eqn (4) of the analytical investigation (Fig. 4c). Depending on the width–thickness ratio of the layer, the S vs. λ curves can be monotonic or non-monotonic. For relatively thin layers (e.g., W/H = 6 and 8), where the fingering instability occurs, the S vs. λ curves are not monotonic. The peak values correspond to the critical points Sc and λc for the onset of the fingering instability (see Movie S3, ESI†). The non-monotonic S vs. λ relation is consistent with the subcritical nature of the fingering instability.17 Notably, although the theoretical analysis does not account for the undulated pattern in fingering instability, it can still predict the non-monotonic relations of S vs. λ for relatively thin layers (i.e., W/H > 5.1 in Fig. 4c). The area of the middle portion becomes smaller under stretch (Fig. 3a), and the geometrical effect causes the decrease of the nominal stress (Fig. 4c). Analogous to Considère's criterion for necking, the peaks on the theoretical S vs. λ curves (Fig. 3c) indicate a tight upper bound of the critical points for the onset of fingering instability. Since the undulated fingering has lower potential energy than the non-undulated necking predicted by the theory (Fig. S7, ESI†), the fingering instability appears in our experiments and simulations of the samples with relatively thin layers (i.e., W/H > 5.1). In addition, the experiments, simulations and theory all show that Sc increases and λc decreases with the rise of W/H, which is consistent with previous reports for fingering instability.17 Notably, the upper-bound critical stretch for the onset of fingering instability obtained from the analytical solution will approach a plateau of 1.4 as the width–thickness ratio increases (Fig. 5c).On the other hand, for relatively thick layers (e.g., W/H = 2.5, 2, 1.5, 1 and 0.5 in Fig. 4), the curves of S vs. λ obtained from experiments, simulations and theory are all monotonic; and the fringe instability is observed in these samples. Strikingly, from both experimental and simulation results, we find that the critical nominal stress for fringe instability in layers with decreasing W/H ratios approaches an approximately constant value of Sc ≈ 3.8μ (Fig. 4b and 5b). Returning to the analytical results in Fig. 4c, and according to the above argument, we may thus obtain an approximate theoretical stability limit by assuming that the fringe instability sets in at the same constant, level of stress from the transition point (where the fingering instability peak vanishes) and to lower width–thickness ratios, as shown by the continuation of the dashed line therein. In addition, different from the subcritical fingering instability,17 the fringe instability forms gradually with negligible hysteresis on the pattern amplitude vs. applied stretch curves obtained from loading and unloading of the sample (Fig. S9, ESI†).
To identify the critical width–thickness ratio (W/H)c for the transition between the fingering and the fringe instabilities, we performed a series of experiments and simulations in an intermediate range of width–thickness ratios (e.g., W/H = 3.8, 4.0, 4.2, 4.3, 4.4, 4.5, 5.1). As shown in Fig. 4a, the non-monotonic behavior of the nominal stress-stretch curves disappears as W/H decreases to 4.4 in the experiments. In simulations, the critical width–thickness ratio is identified as (W/H)c = 4. This slight difference between the experiment and simulation is possibly due to the deviation of the layer's mechanical properties from the neo-Hookean model. In this study, we take the simulation result (W/H)c = 4 as the critical width–thickness ratio for the transition between the fingering and fringe instabilities.
3.4 Critical stress, stretch and wavelength for fringe instability
To better understand the characteristics of fringe instability, we plot the nominal stress Szz contours in relatively thick layers (e.g., W/H = 0.5, 1, 2 and 4) right before the onset of the fringe instability (Fig. 5a). At this critical point, the middle portion of the specimens is in a state of nearly uniform uniaxial plane-strain tension, which therefore does not cause the fingering instability (Fig. 5a). On the other hand, the fringe portions exhibit a self-similar state of deformation, which is subjected to tensile stress yet constrained by the rigid surfaces. A combination of the tensile stress, mechanical constraint, and material incompressibility cause the surfaces of fringe portions to undulate, giving the fringe instability.We denote the thickness of the middle and fringe portions at the undeformed state as Hm and Hf, respectively. Based on the minimum layer thickness for the fringe instability, i.e., (W/H)c = 4, we can further obtain Hf = W/4 and Hm = H − Hf. At the critical point for fringe instability, the stretch in the fringe portion λf is independent of W/H and can be obtained from the simulation results for W/H = 4 as λf = 1.8. The critical stretch in the middle portion λm is dictated by the nominal stress-stretch relation in plane-strain tension, i.e. Sc/μ = λm − λm−3 = 3.8, which gives λm = 3.9. Therefore, the asymptotic solution of the critical stretch for the onset of the fringe instability can be expressed as
 | (5) |
In Fig. 5c, we summarize the critical stretch levels for both the fringe and fingering instabilities obtained from experiments, simulations and theory. It can be seen that the above linear relation and the simulations can consistently predict the critical stretches for both types of instabilities. The analytical solution further provides a tight upper bound for the critical stretches in the entire range.
While it is known that the wavelength of the fingering instability lfinger scales with the elastic layer's thickness H (Fig. 5d), the wavelength of the fringe instability lfringe does not follow such scaling since the thickness of the middle portions does not affect the fringe instability wavelength. Instead, the relevant length scale for the fringe instability wavelength is the fringe portion's thickness, which scales with the layer's width. Therefore, the wavelength for fringe instability scales with the elastic layer's width, instead of its thickness. This dependence has been validated by both the experimental and simulation results in Fig. 5d. In addition, by fitting to the experimental and simulation results, we can further obtain the pre-factors for the scales, i.e., lfringe ≈ 0.45W.
4. Conclusions
We report a new mode of fringe instability that occurs in a constrained soft elastic layer with one lateral dimension (e.g., width) comparable with or lower than its thickness. Subjected to high stretches, the middle portion of the layer elongates nearly uniformly but the fringe portions deform non-uniformly. At a critical point, the exposed surface of the fringe portions undulates periodically, giving the localized fringe instability. We combine experiments, numerical simulations and theory to quantitatively explain the fringe instability and its differences from the fingering instability, including morphology evolutions, critical stresses and stretches, and wavelengths. We particularly find that the fingering instability represents a global snap-through instability with non-monotonic stress vs. stretch relations but the fringe instability is a localized bifurcation mode with monotonic stress vs. stretch relations. To our knowledge, the current study represents the first discovery and explanation of the fringe instability in constrained soft elastic layers. On a practical level, our results have implications for the reliability of soft elastic materials bonded on rigid materials; since the occurrence of fringe instability may significantly enhance the stress in the soft elastic materials around the interfaces, likely leading to fracture or debonding of the soft materials. Moreover, understanding the distinct mechanical responses of constrained elastic layers that differ only by their dimensions will help the design and applications of advanced adhesives, joints, sealants, insulators and bearings.Acknowledgements
This work is supported by ONR (No. N00014-14-1-0528), MIT Institute for Soldier Nanotechnologies and NSF (No. CMMI-1253495). H. Y. acknowledges the financial support from Samsung Scholarship. T. C. acknowledges the support from the MIT-Technion Post-Doctoral Fellowship Program. X. Z. acknowledges the support from NIH (No. UH3TR000505).References
- K. W. Desmond, N. A. Zacchia, J. H. Waite and M. T. Valentine, Soft Matter, 2015, 11, 6832–6839 RSC.
- N. V. Gohad, N. Aldred, C. M. Hartshorn, Y. J. Lee, M. T. Cicerone, B. Orihuela, A. S. Clare, D. Rittschof and A. S. Mount, Nat. Commun., 2014, 5, 4414 CAS.
- Y. Sun, S. Guo, G. C. Walker, C. J. Kavanagh and G. W. Swain, Biofouling, 2004, 20, 279–289 CrossRef CAS PubMed.
- E. Vaccaro and J. H. Waite, Biomacromolecules, 2001, 2, 906–911 CrossRef CAS PubMed.
- A. Kinloch, J. Adhes., 1979, 10, 193–219 CrossRef CAS.
- H. Yuk, T. Zhang, S. Lin, G. A. Parada and X. Zhao, Nat. Mater., 2016, 15, 190–196 CrossRef CAS PubMed.
- C. Creton and M. Ciccotti, Rep. Prog. Phys., 2016, 79, 046601 CrossRef PubMed.
- A. Gent and P. Lindley, Proc. R. Soc. A, 1959, 249, 195–205 CrossRef.
- C. Fond, J. Polym. Sci., Part B: Polym. Phys., 2001, 39, 2081–2096 CrossRef CAS.
- J. Dollhofer, A. Chiche, V. Muralidharan, C. Creton and C. Hui, Int. J. Solids Struct., 2004, 41, 6111–6127 CrossRef.
- J. Zhu, T. Li, S. Cai and Z. Suo, J. Adhes., 2011, 87, 466–481 CrossRef CAS.
- A. Ghatak and M. K. Chaudhury, Langmuir, 2003, 19, 2621–2631 CrossRef CAS.
- J. Chung, K. Kim, M. Chaudhury, J. Sarkar and A. Sharma, Eur. Phys. J. E: Soft Matter Biol. Phys., 2006, 20, 47–53 CrossRef CAS PubMed.
- M. K. Chaudhury, A. Chakrabarti and A. Ghatak, Eur. Phys. J. E: Soft Matter Biol. Phys., 2015, 38, 1–26 CrossRef CAS PubMed.
- A. Chakrabarti and M. K. Chaudhury, Langmuir, 2013, 29, 6926–6935 CrossRef CAS PubMed.
- J. Y. Chung and M. K. Chaudhury, J. Adhes., 2005, 81, 1119–1145 CrossRef CAS.
- J. S. Biggins, B. Saintyves, Z. Wei, E. Bouchaud and L. Mahadevan, Proc. Natl. Acad. Sci. U. S. A., 2013, 110, 12545–12548 CrossRef CAS PubMed.
- K. R. Shull, C. M. Flanigan and A. J. Crosby, Phys. Rev. Lett., 2000, 84, 3057 CrossRef CAS PubMed.
- J. T. Overvelde, D. M. Dykstra, R. de Rooij, J. Weaver and K. Bertoldi, Phys. Rev. Lett., 2016, 117, 094301 CrossRef PubMed.
- P. G. Saffman and G. Taylor, Proc. R. Soc. A, 1958, 245, 312–329 CrossRef CAS.
- G. M. Homsy, Annu. Rev. Fluid Mech., 1987, 19, 271–311 CrossRef.
- G. H. McKinley and T. Sridhar, Annu. Rev. Fluid Mech., 2002, 34, 375–415 CrossRef.
- I. Bischofberger, R. Ramachandran and S. R. Nagel, Nat. Commun., 2014, 5, 5265 CrossRef CAS PubMed.
- C. Zhong, T. Gurry, A. A. Cheng, J. Downey, Z. Deng, C. M. Stultz and T. K. Lu, Nat. Nanotechnol., 2014, 9, 858–866 CrossRef CAS PubMed.
- J.-Y. Sun, X. Zhao, W. R. Illeperuma, O. Chaudhuri, K. H. Oh, D. J. Mooney, J. J. Vlassak and Z. Suo, Nature, 2012, 489, 133–136 CrossRef CAS PubMed.
- S. Lin, Y. Zhou and X. Zhao, Extreme Mech. Lett., 2014, 1, 70–75 CrossRef.
- S. Lin, H. Yuk, T. Zhang, G. A. Parada, H. Koo, C. Yu and X. Zhao, Adv. Mater., 2016, 28, 4497–4505 CrossRef CAS PubMed.
- T. Zhang, S. Lin, H. Yuk and X. Zhao, Extreme Mech. Lett., 2015, 4, 1–8 CrossRef.
- A. Gent and P. Lindley, Proc. Inst. Mech. Eng., 1959, 173, 111–122 CrossRef.
- W. W. Klingbeil and R. T. Shield, Z. Angew. Math. Phys., 1966, 17, 281–305 CrossRef.
Footnotes |
| † Electronic supplementary information (ESI) available. See DOI: 10.1039/c6sm01672c |
| ‡ These authors contribute equally to this paper. |
| § For brevity, throughout the text we refer to layers of thickness that is much smaller than the in-plane dimensions as ‘thin layers’, while ‘thick layers’ are considered to have a thickness of the order of the in-plane dimensions or larger. |
| This journal is © The Royal Society of Chemistry 2016 |

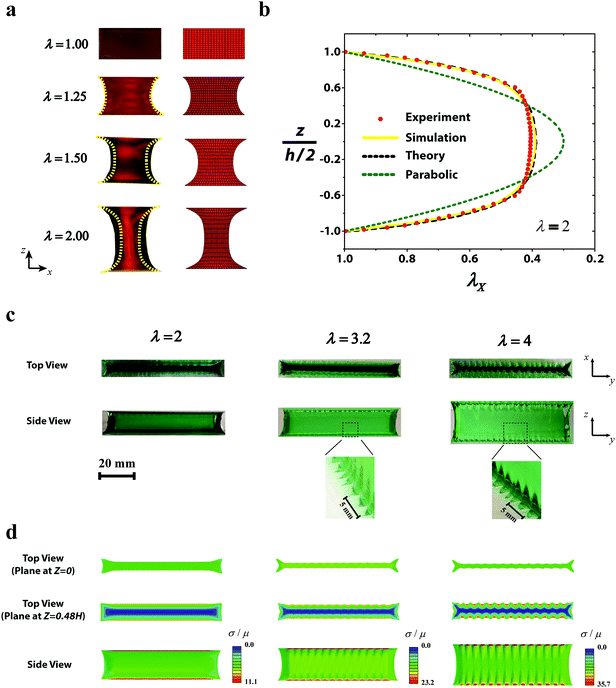
![[small sigma, Greek, macron]](https://www.rsc.org/images/entities/char_e0d2.gif) represents the von Mises stress.
represents the von Mises stress.