Fabrication of a polyaniline/MoS2 nanocomposite using self-stabilized dispersion polymerization for supercapacitors with high energy density†
Minkyu Kima,
Yun Ki Kima,
Jihoo Kima,
Sunghun Choab,
Gyeongseop Leea and
Jyongsik Jang*a
aSchool of Chemical and Biological Engineering, College of Engineering, Seoul National University (SNU), 599 Gwanangno, Gwanak-gu, Seoul 151-742, Korea. E-mail: jsjang@plaza.snu.ac.kr; Fax: +82-2-888-7295; Tel: +82-2-880-7069
bDepartment of Chemistry and Biochemistry and California Nanosystems Institute, University of California, Los Angeles (UCLA), Los Angeles, California 90095, USA
First published on 10th March 2016
Abstract
In this report, a polyaniline/MoS2 nanocomposite has been firstly produced using a self-stabilized dispersion polymerization method. The synthesized polyaniline/MoS2 nanocomposite exhibited a remarkably high electrical conductivity of ca. 28.6 S cm−1, which is higher than other previously reported MoS2-based composites. Additionally, the PANI/MoS2 nanocomposite exhibited substantially improved capacitance (ca. 400 F g−1) compared to pristine MoS2 nanosheets (ca. 3 F g−1) and PANI (ca. 232 F g−1) and enhanced cycling stability (retention rate of 84%) in comparison with pure PANI (retention rate of 62%). Furthermore, the PANI/MoS2 nanocomposite demonstrated a higher energy density (4.7 W h kg−1 at 1000 W kg−1) than conventional electrochemical capacitors and other previously reported carbon and carbon/conducting polymer based electrochemical capacitors owing to its high utilizing of pseudocapacitance attributed to high electrical conductivity. What is more, the synthesized PANI/MoS2 nanocomposite demonstrated good rate capability and a good power characteristic as the supercapacitor electrode by keeping its high energy density (3.8 W h kg−1) at a high power density (2000 W kg−1) due to the existence of sufficient empty space between interconnected PANI nanofibers and high electrical conductivity of the PANI/MoS2 nanocomposite.
Introduction
A supercapacitor has been widely utilized in vast applications needing rapid energy delivery because of its high power density: within wind turbines, various vehicles, elevators. As smaller forms, they have also been used as memory backups for static random-access memory. Supercapacitors can be classified into two types depending on their energy storage mechanisms: electrical double layer capacitors and pseudocapacitors. Electrical double layer capacitor stores electrical energy by electrostatically charging charge ions in electrical double layers generated on electrode surface. As electrode material for electrical double layer capacitor, various carbon materials such as activated carbons and graphene have been employed. In case of pseudocapacitor, it stores electrical energy by charging the electron in the electrode through the reversible redox reaction. Conducting polymers and transition metal oxides belong to pseudocapacitor electrode material. Materials used for electrical double layer capacitor and pseudocapacitor possess their pros and cons. For example, carbon materials show a good cycling stability owing to its good mechanical stability, but energy density is relatively low. In the cases of conducting polymers, in contrast to carbon materials, they possess high energy density, but the cycling stability is relatively poor due to their poor mechanical strength.1 Thus, large efforts have been made to fabricate supercapacitor with high capacitance and good cycling stability.1–5Recently, MoS2 nanosheet, a typical layered transition-metal sulfide, has attracted great attention as a supercapacitor electrode owing to its attractive properties such as high theoretical specific capacitance and good cycling stability.6,7 However, despite a large number of advantages, low electrical conductivity limits its practical electrochemical performances.8 It has been reported that polyaniline (PANI) synthesized by self-stabilized dispersion polymerization method possesses exceptional electrical properties compared with PANI fabricated using classical dispersion polymerization method because of its excellent structural purity.9,10 In this paper, we have produced PANI/MoS2 nanocomposite using self-stabilized dispersion polymerization and investigated its electrical and electrochemical properties.
Results and discussion
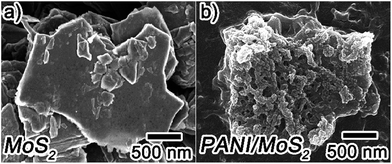
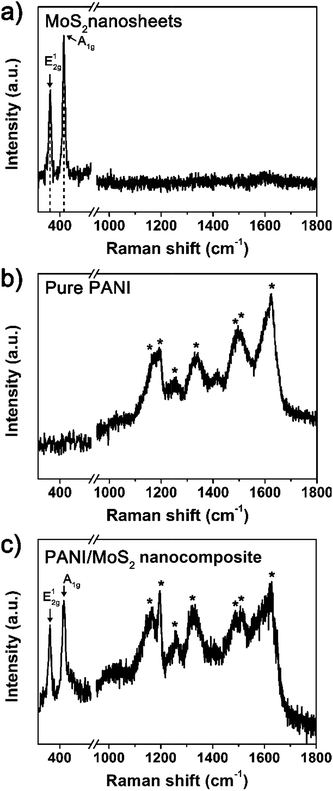
The PANI/MoS2 nanocomposite was synthesized as follows. First, prepared MoS2 nanosheet was added to aniline hydrochloride solution and then sonicated for 2 h for homogeneous mixing. The MoS2 nanosheets possess negatively charged surfaces in acid solution.11–13 Thus, positively charged aniline hydrochloride cation enwraps whole surfaces of negatively charged MoS2 layers.12,13 Next, chloroform was injected to mixture, and then, stirred and sonicated for 1 min and 1 h, respectively. After sonication process, the mixture was stirred under temperature of −43 °C. When the temperature of solution decreased to −9 °C, initiator solution was injected to the mixture. With addition of initiator, polymer chains start to grow and growing PANI chains continuously belong to organic phase, whereas amine parts, reactive ends of growing chains, belong to aqueous phase at reaction temperatures below −9 °C.14 Owing to this separation, undesirable side reactions such as ortho-coupling is suppressed during polymerization reactions.14 After stirring solution for 12 h under −43 °C, dark green-color PANI/MoS2 nanocomposite was obtained. As-synthesized PANI/MoS2 nanocomposite was washed, centrifuged, and dried. Fig. 1 depicts FE-SEM images of the MoS2 nanosheets and obtained PANI/MoS2 nanocomposite. Fig. 1a illustrates that MoS2 nanosheets possesses smooth surface. In contrast, PANI/MoS2 nanocomposite shows that PANI nanofiber with interconnected structure is entirely coated on the MoS2 nanosheets (Fig. 1b), which is characteristic morphology of the PANI synthesized by self-stabilized dispersion polymerization method to be distinguished from the PANI polymerized by other polymerization methods.9 This result reflects that PANI has been successfully polymerized on whole surfaces of MoS2 nanosheet via self-stabilized dispersion polymerization method. The successful entire coating of PANI on MoS2 nanosheet might be originated from strong charge–charge interaction between positively charged anilinium hydrochloride cation and negatively charged MoS2 nanosheet.12,13Fig. 2 displays the Raman spectra of pristine MoS2 nanosheets, pure PANI, and PANI/MoS2 nanocomposite. The MoS2 nanosheets demonstrates its characteristic peaks at 382.6 and 407.2 cm−1 (Fig. 2a), corresponding to E12g mode vibration originated from in-plane vibration of Mo atom and S atoms in opposite directions and A1g mode vibration related with the out-of-plane vibration of only S atoms in opposite directions.15,16 It has been reported that layer number of MoS2 sample can be simply determined by measuring frequency difference between E12g and A1g modes because two Raman modes are very sensitive to thickness of the MoS2 sample.15 The frequency difference of the MoS2 nanosheets prepared here was found to be 24.6 cm−1, corresponding to five-to-six-layered MoS2 nanosheet. This result indicates that bulk MoS2 has been completely exfoliated to five-to-six-layered MoS2 nanosheet.15 Pure PANI shows its own intrinsic peaks at 1169, 1192, 1253, 1343, 1495, 1516, and 1623 cm−1 (Fig. 2b), assigned to C–H bending of benzenoid ring, C–H bending of benzenoid ring, symmetric C–N stretching, C–N+ stretching, C![[double bond, length as m-dash]](https://www.rsc.org/images/entities/char_e001.gif) N stretching of the quinoid ring, C
N stretching of the quinoid ring, C![[double bond, length as m-dash]](https://www.rsc.org/images/entities/char_e001.gif) C stretching vibration of quinoid ring, and C–C bending of benzenoid ring.2,17–19 For PANI/MoS2 nanocomposite (Fig. 2c), it displays Raman peaks of both MoS2 (382.1 and 406.8 cm−1) and PANI components (1169, 1192, 1253, 1343, 1495, 1516, and 1623 cm−1). The frequency difference of MoS2 in the PANI/MoS2 nanocomposite was measured to 25.2 cm−1, corresponding to five-to-six-layered MoS2. These peaks point out that PANI has been polymerized on the five-to-six-layered MoS2 nanosheet during the polymerization process.
C stretching vibration of quinoid ring, and C–C bending of benzenoid ring.2,17–19 For PANI/MoS2 nanocomposite (Fig. 2c), it displays Raman peaks of both MoS2 (382.1 and 406.8 cm−1) and PANI components (1169, 1192, 1253, 1343, 1495, 1516, and 1623 cm−1). The frequency difference of MoS2 in the PANI/MoS2 nanocomposite was measured to 25.2 cm−1, corresponding to five-to-six-layered MoS2. These peaks point out that PANI has been polymerized on the five-to-six-layered MoS2 nanosheet during the polymerization process.
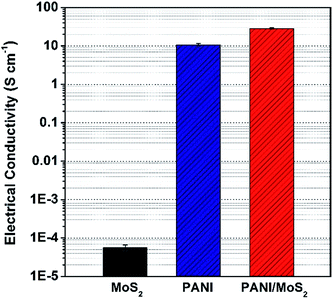
Next, electrical conductivity and electrochemical properties of the MoS2 nanosheet, pure PANI, and PANI/MoS2 nanocomposite were investigated. Firstly, the electrical conductivities of the samples were measured using the four-in-line probe method (measuring the voltage differences between horizontally separated two probes by applying constant current to horizontally separated two other probes). Pristine MoS2 nanosheet and pure PANI exhibited the electrical conductivities of ca. 5.6 × 10⁻⁵ and ca. 10.6 S cm−1, respectively (Fig. 3). Interestingly, after the PANI is coated on the MoS2 nanosheets, PANI/MoS2 nanocomposite showed increased electrical conductivity of ca. 28.6 S cm−1 (Fig. 3) in comparison with those of pristine MoS2 nanosheets and PANI, which is even higher than previously reported other MoS2-based composites.13,20,21 It has been reported that electrical conductivity of conducting polymers can be substantially increased in composites despite addition of insulating materials, which is due to improvement in compactness conducting polymers (e.g., from ca. 1 to ca. 17 S cm−1 in PPy/ZrO2 nanocomposite).22,23 In the PANI/MoS2 nanocomposite, PANI which was randomly interconnected to vertical and horizontal directions (Fig. S1†) has been majorly aligned in horizontal direction, leading to increase in compactness of PANI. Thus, enhanced electrical conductivity of PANI/MoS2 nanocomposite might be fundamentally owing to horizontally well aligned structure of PANI on MoS2 nanosheets, giving rise to increase in compactness of PANI, ordering of PANI/MoS2 nanocomposites in pellet, and ultimately electrical conductivity of PANI/MoS2 nanocomposite. Additionally, the increase electrical conductivity of PANI/MoS2 nanocomposite might also be due to the strong π–π* interactions between PANI and MoS2, improving electron transportation within MoS2 in PANI/MoS2 nanocomposite.12,13,24
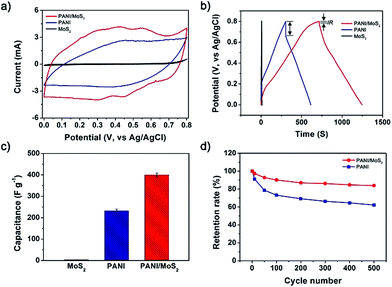
Fig. 4a presents the CV curves of MoS2 nanosheet, PANI, and PANI/MoS2 nanocomposite within a potential window from 0.0 to 0.8 V (vs. AgCl/Ag) at a scan rate of 5 mV s−1. The MoS2 nanosheet presents the low current response with distinctive peak at 0.8 V (Fig. S2†), reflecting low pseudo-capacitance behavior. This peak might be attributed to the reduction of Mo atoms at the edge of the nanosheet. During the cathodic scan, holes are migrated from the electrolyte into n-type MoS2 and recombined with electrons, resulting in sharp cathodic reduction peak at 0.8 V. In contrast, intensity of anodic current was very small due to the small number of holes in an n-type material MoS2.25 In the case of the PANI, it exhibits larger current response than MoS2 nanosheet with a couple of redox peaks (faradaic transformation of emeraldine to pernigraniline),26 revealing the higher pseudo-capacitance of the PANI than MoS2 nanosheet. For PANI/MoS2 nanocomposite, it demonstrates highest current response with redox peaks, representing the highest pseudo-capacitance of the PANI/MoS2 nanocomposite.
Fig. 4b illustrates galvanostatic charge/discharge curves of MoS2 nanosheet, PANI, and PANI/MoS2 nanocomposite within a potential window from 0.0 to 0.8 V (vs. AgCl/Ag) at a current density of 0.6 A g−1. In accordance with the CV curves, galvanostatic charge/discharge curves show the highest capacitance of the PANI/MoS2 nanocomposite and pseudo-capacitance behavior of the all samples by representing longest discharging time of the PANI/MoS2 nanocomposite and nonlinear-shaped galvanostatic charge/discharge curves of all samples (Fig. S3†). Additionally, galvanostatic charge/discharge curves depicts the lower “IR drop” of PANI/MoS2 nanocomposite than pristine PANI, indicating that PANI/MoS2 nanocomposite possesses lower internal resistance than PANI. The precise internal resistances of PANI/MoS2 nanocomposite and PANI were calculated based on the “IR drop” and it was founded to be ca. 0.03 and 0.23 Ω g, respectively. For MoS2 nanosheet, no “IR drop” was observed, indicating that internal resistance of MoS2 nanosheet is extremely low. The charging and discharging process of supercapacitor electrode is related with migration of charge ions from electrolyte to the electrode and inter-electrode. During this migration, losses take place and these losses are expressed as internal resistance.27 From this point of view, it can be deduced that the extremely low internal resistance of MoS2 nanosheet is originated from the multilayer structure of MoS2 nanosheets stacked in van der Waals force, enabling facile intercalation of H+ ions.6 In the cases for PANI/MoS2 nanocomposite, the improved internal resistance would be owing to (1) sufficient empty space between the PANI nanofibers and (2) introduce of MoS2 nanosheet possessing extremely low also internal resistance, both facilitating migration of charge carriers. Possessing low internal resistance is extremely important in supercapacitor electrode application for the long-lifetime. The higher internal resistance of electrode induces larger unwanted Joule-heating, resulting in short-lifetime of electrodes.28,29 Therefore, this result implies that the PANI/MoS2 nanocomposite can be suitably used as long-life time supercapacitor electrode.
In addition to internal resistance, accurate gravimetric capacitance was also measured from the galvanostatic discharging curves (Fig. 4c). The MoS2 nanosheet and PANI exhibited gravimetric capacitances of ca. 3 and ca. 232 F g−1, respectively. When MoS2 nanosheet is combined with the PANI, PANI/MoS2 nanocomposite demonstrates significantly improved gravimetric capacitance of ca. 400 F g−1, which is much higher value than pristine MoS2 nanosheet and pure PANI. The capacitance of the supercapacitor electrode is crucially depends on types of the materials and electrical conductivity: pseudo capacitive electrodes possess higher specific capacitance than EDLC electrodes1 and materials with larger electrical conductivity demonstrate higher capacitance than materials with lower electrical conductivity.30,31 The PANI/MoS2 nanocomposite consists of MoS2 and PANI possessing pseudo-capacitance, thus, this nanocomposite possesses high potential that could exhibits large pseudo-capacitance. In this condition, highly electrical conductive PANI in the PANI/MoS2 nanocomposite would provide high conductivity path to MoS2 nanosheet and this would promote fast redox reaction of MoS2 nanosheet, giving rise to improved high pseudo-capacitance of the PANI/MoS2 nanocomposite.
Fig. 4d plots cycling stabilities of the PANI, MoS2 nanosheet, and PANI/MoS2 nanocomposite. The retention rate of PANI decreased from 100% to 62% after 500 cycles. On the contrast, PANI/MoS2 nanocomposite shows the improved charge retention rate of 84%. The enhanced electrochemical stability of PANI/MoS2 nanocomposite might be due to following reasons: (1) it has been known that MoS2 possesses outstanding electrochemical stability like graphene, which is originated from the excellent mechanical strength of MoS2.6,7 Consequently, improved electrochemical stability of PANI/MoS2 nanocomposite might be originated from existence of highly electrochemically stable MoS2 component in the PANI/MoS2 nanocomposite. (2) While the pristine PANI electrode is repeatedly charged and discharged during cycling stability test, agglomerated PANI (Fig. S1†) are repeatedly bumped each other by repeated swelling and shrinkage, leading to cracking and breaking of PANI chains, gradual loss in electrical conductivity, and decrease in capacitance.32 On the other hand, PANI/MoS2 nanocomposite with more free space between the nanofibers than pure PANI can offer larger swelling volume than pristine PANI, which would impede the cracking and breaking of PANI chains and enhance the cycling stability.
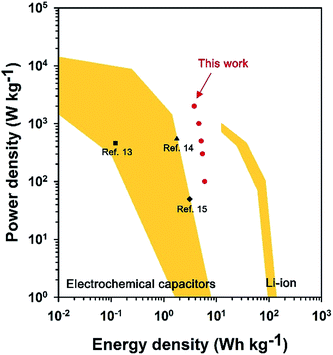
Fig. 5 illustrates Ragone plot of PANI/MoS2 nanocomposite. The PANI/MoS2 nanocomposite exhibits higher energy densities (e.g. 4.7 W h kg−1 at 1000 W kg−1, Fig. S4 and Table S1†) than conventional electrochemical capacitors and other electrochemical capacitors such as carbon nanotube/paper based electrochemical capacitors (0.12 W h kg−1 at 460 W kg−1),33 PANI/carbon nanotube based electrochemical capacitors (1.78 W h kg−1 at 547.25 W kg−1),34 and reduced graphene oxide based electrochemical capacitors (3.1 W h kg−1 at 50 W kg−1).35 Additionally, PANI/MoS2 nanocomposite keeps its high energy density (3.8 W h kg−1) at high power density (2000 W kg−1), pointing out good rate capability and high-power characteristics of PANI/MoS2 nanocomposite. This result might be due to existence of sufficient empty space between interconnected PANI nanofibers and high electrical conductivity of PANI/MoS2 nanocomposite, offering short diffusion length of electrolyte ions to PANI and fast electron transfer path to MoS2 nanosheets.36
Conclusions
In summary, we have, for the first time, prepared PANI/MoS2 nanocomposite using self-stabilized dispersion polymerization method and revealed electrical and electrochemical properties of the PANI/MoS2 nanocomposite. Produced PANI/MoS2 nanocomposite demonstrated remarkably high electrical conductivity of ca. 28.6 S cm−1 due to high structural purity of PANI and horizontally well aligned PANI along the MoS2 nanosheet, which is higher than previously reported other MoS2-based composites. In the electrochemical tests, PANI/MoS2 nanocomposite demonstrated extensively improved capacitance (ca. 400 F g−1) compared to pristine MoS2 nanosheet (ca. 3 F g−1) and PANI (ca. 232 F g−1) and enhanced cycling stability (retention rate of 84%) in comparison with pure PANI (retention rate of 62%). Importantly, PANI/MoS2 nanocomposite showed higher energy density (4.7 W h kg−1, 1000 W kg−1) than conventional electrochemical capacitors and other previously reported carbon and carbon/conducting polymer based electrochemical capacitors. What is more, PANI/MoS2 nanocomposite exhibited good rate capability and good power characteristic as supercapacitor electrode by keeping its high energy density (3.8 W h kg−1) at high power density (2000 W kg−1). All these results strongly suggest great potential of the PANI/MoS2 nanocomposite as practical supercapacitor electrode. Synthetic method described here could offer effective tool for fabricating various nanocomposites with high electrical conductivity, which can be usefully employed in vast applications including sensors, solar cells, and electro-chromic devices.Experimental section
Materials
Aniline (C6H7N, ≥99.5%), ammonium persulfate ([NH4]2S2O8, 98%), molybdenum(IV) sulfide (MoS2, powder, <2 μm, 99%), and poly(tetrafluoroethylene) (PTFE; [C2F4]n, 60 wt% dispersion in H2O) were purchased from Sigma-Aldrich Chemical Co. Hydrochloric acid (HCl, 35.0–37.0 wt%), chloroform (CHCl3, 99.8%), and N-methyl-2-pyrrolidone (NMP, 99.5%) were purchased from the Samchun Chemical Co. Mortar and pestle were acquired from Samwha ceramic.Preparation of MoS2 nanosheets
Exfoliation of MoS2 was conducted by grinding 0.8 g of MoS2 powder with 0.4 mL of NMP for 30 min in a mortar. The solvents were removed in a vacuum oven from gel-like mixtures. The powders were dispersed in 20 mL of ethanol/deionized water (45 vol% of ethanol) and sonicated for 2 h. Unexfoliated MoS2 flakes were removed by centrifugation for several times and the supernatant was collected.Preparation of PANI/MoS2 nanocomposite
In the first step, aniline (0.2 g) and HCl (35.0–37.0 wt%, 1 g) were added to deionized water (6 g) and then stirred for 10 min. Next, as-synthesized MoS2 nanosheet (0.01 g) added to above solution and then sonicated for 2 h. Next, chloroform (12 mL) was injected to mixture and then stirred for 1 min. Subsequently, the mixture was sonicated for 1 h. After sonication, the mixture was stirred under temperature of −43 °C at 400 rpm. When the temperature of solution dropped to −9 °C, initiator solution (H2O: 2 g, ammonium persulfate: 0.24 g, 35.0–37.0 wt% HCl: 0.1 g), was injected to the mixture. After stirring solution under −43 °C for 12 h, fabricated PANI/MoS2 nanocomposite was washed, centrifuged, and dried. In the case of pure PANI, it was prepared via identical synthetic procedure with PANI/MoS2 nanocomposite except incorporation of MoS2 nanosheet.Electrochemical measurements
All electrochemical tests (CV and galvanostatic charge/discharge tests) were conducted in a three-electrode system (the reference and counter electrodes were Ag/AgCl and Pt, respectively) in 1 M H2 SO4 solution at a potential window of 0.0–0.8 V. The working electrodes were prepared as follows. Firstly, the 1.5 mg of active material (MoS2 nanosheet, PANI, or PANI/MoS2 nanocomposite) was mixed with PTFE (0.18 mg) and carbon black (0.18 mg). Next, the mixture was coated on stainless steel mesh (1 cm × 1 cm). Then, coated electrode was dried in at 25 °C for 24 h. The accurate gravimetric capacitance (Cm), internal resistance (R), energy density (E), and power density (P) were calculated from galvanostatic charge/discharge curves using following equations. Cm (F g−1) = (I × t)/(m × V), where I is discharging current (mA), t is discharging time (s), m is mass of active material (mg), and V is potential window during discharging process (V). R (Ω g) = V/(I/g), where V is IR drop and (I/g) is discharging current density (A g−1). E (W h kg−1) = (1/4) × (0.5 × Cm × V2/3.6), where Cm is gravimetric capacitance of single electrode measured in three-electrode system (F g−1), V is potential window during discharging process (V). The multiplier of (1/4) is to convert capacitance of single electrode into capacitance of two electrode cells. P (W kg−1) = (E/t) × (3600), where E is energy density (W h kg−1) and t is discharging time (s).Characterization
Field-emission scanning electron microscope (FE-SEM) images of samples were taken using a JSM-6701F (JEOL, Japan). Raman spectra of samples were obtained using a T64000 Raman spectrometer (Horiba Jobin Yvon, Japan) with a 514 nm Ar laser as the excitation source. The electrical conductivity measurements of samples were conducted with four-in-line probe method using a LORESTA-GP/MCP-T610 (MITSUBISHI, Japan).Acknowledgements
This work was supported by Development Fund of Seoul National University funded by Dongjin Semichem Co., Korea (0458-20130066).Notes and references
- P. Simon and Y. Gogotsi, Nat. Mater., 2008, 7, 845–854 CrossRef CAS PubMed
.
- M. Kim, C. Lee and J. Jang, Adv. Funct. Mater., 2014, 24, 2489–2499 CrossRef CAS
.
- S. Cho, M. Kim and J. Jang, ACS Appl. Mater. Interfaces, 2015, 7, 10213–10227 CAS
.
- J. Jun, J. S. Lee, D. H. Shin, S. G. Kim and J. Jang, Nanoscale, 2015, 7, 16026–16033 RSC
.
- J. S. Lee, D. H. Shin and J. Jang, Energy Environ. Sci., 2015, 8, 3030–3039 CAS
.
- L. Cao, S. Yang, W. Gao, Z. Liu, Y. Gong, L. Ma, G. Shi, S. Lei, Y. Zhang, S. Zhang, R. Vajtai and P. M. Ajayan, Small, 2013, 9, 2905–2910 CrossRef CAS PubMed
.
- A. Castellanos-Gomez, R. van Leeuwen, M. Buscema, H. S. J. van der Zant, G. A. Steele and W. J. Venstra, Adv. Mater., 2013, 25, 6719–6723 CrossRef CAS PubMed
.
- X. Zhou, B. Xu, Z. Lin, D. Shu and L. Ma, J. Nanosci. Nanotechnol., 2014, 14, 7250–7254 CrossRef CAS PubMed
.
- S.-H. Lee, D.-H. Lee, K. Lee and C.-W. Lee, Adv. Funct. Mater., 2005, 15, 1495–1500 CrossRef CAS
.
- B. H. Lee, S. H. Park, H. Back and K. Lee, Adv. Funct. Mater., 2011, 21, 487–493 CrossRef CAS
.
- L. Sun, H. Huang and X. Peng, Chem. Commun., 2013, 49, 10718–10720 RSC
.
- T. Yang, L. Meng, H. Chen, S. Luo, W. Li and K. Jiao, Adv. Mater. Interfaces DOI:10.1002/admi.201500700
.
- J. Wang, Z. Wu, K. Hu, X. Chen and H. Yin, J. Alloys Compd., 2015, 619, 38–43 CrossRef CAS
.
- K. Lee, S. Cho, S. H. Park, A. J. Heeger, C.-W. Lee and S.-H. Lee, Nature, 2006, 441, 65–68 CrossRef CAS PubMed
.
- C. Lee, H. Yan, L. E. Brus, T. F. Heinz, J. Hone and S. Ryu, ACS Nano, 2010, 4, 2695–2700 CrossRef CAS PubMed
.
- H. Li, Q. Zhang, C. C. R. Yap, B. K. Tay, T. H. T. Edwin, A. Olivier and D. Baillargeat, Adv. Funct. Mater., 2012, 22, 1385–1390 CrossRef CAS
.
- P. Sambyal, A. P. Singh, M. Verma, M. Farukh, B. P. Singh and S. K. Dhawan, RSC Adv., 2014, 4, 12614–12624 RSC
.
- R. Islam, R. Chan-Yu-King, J.-F. Brun, C. Gors, A. Addad, M. Depriester, A. Hadj-Sahraoui and F. Roussel, Nanotechnology, 2014, 25, 475705–475713 CrossRef PubMed
.
- Z. Tai, X. Yan and Q. Xue, J. Electrochem. Soc., 2012, 159, A1702–A1709 CrossRef CAS
.
- B.-Z. Lin, C. Ding, B.-H. Xu, Z.-J. Chen and Y.-L. Chen, Mater. Res. Bull., 2009, 44, 719–723 CrossRef CAS
.
- T. Wang, W. Liu, J. Tian, X. Shao and D. Sun, Polym. Compos., 2004, 25, 111–117 CrossRef CAS
.
- R. Gangopadhyay and A. De, Chem. Mater., 2000, 12, 608–622 CrossRef CAS
.
- A. Bhattacharya, K. M. Ganguly, A. De and S. Sarkar, Mater. Res. Bull., 1996, 31, 527–530 CrossRef CAS
.
- T. Yang, R. Yang, H. Chen, F. Nan, T. Ge and K. Jiao, ACS Appl. Mater. Interfaces, 2015, 7, 2867–2872 CAS
.
- J. M. Soon and K. P. Loh, Electrochem. Solid-State Lett., 2007, 10, A250–A254 CrossRef CAS
.
- N. A. Kumar, H.-J. Choi, Y. R. Shin, D. W. Chang, L. Dai and J.-B. Baek, ACS Nano, 2012, 6, 1715–1723 CrossRef CAS PubMed
.
- G. Xiong, C. Meng, R. G. Reifenberger, P. P. Irazoqui and T. S. Fisher, Energy Technol., 2014, 2, 897–905 CrossRef CAS
.
- Q. Wu, Y. Xu, Z. Yao, A. Liu and G. Shi, ACS Nano, 2010, 4, 1963–1970 CrossRef CAS PubMed
.
- Z. Zhou and X.-F. Wu, J. Power Sources, 2013, 222, 410–416 CrossRef CAS
.
- H.-W. Park, T. Kim, J. Huh, M. Kang, J. E. Lee and H. Yoon, ACS Nano, 2012, 6, 7624–7633 CrossRef CAS PubMed
.
- Q. Weng, X. Wang, X. Wang, C. Zhang, X. Jiang, Y. Bando and D. Golberg, J. Mater. Chem. A, 2015, 3, 3097–3102 CAS
.
- K. Zhang, L. L. Zhang, X. S. Zhao and J. Wu, Chem. Mater., 2010, 22, 1392–1401 CrossRef CAS
.
- Y. J. Kang, H. Chung, C.-H. Han and W. Kim, Nanotechnology, 2012, 23, 289501 CrossRef
.
- C. Meng, C. Liu, L. Chen, C. Hu and S. Fan, Nano Lett., 2010, 10, 4025–4031 CrossRef CAS PubMed
.
- J. Zhang, J. Jiang, H. Li and X. S. Zhao, Energy Environ. Sci., 2011, 4, 4009–4015 CAS
.
- J. Yan, T. Wei, B. Shao, Z. Fan, W. Qian, M. Zhang and F. Wei, Carbon, 2010, 48, 487–493 CrossRef CAS
.
Footnote |
| † Electronic supplementary information (ESI) available: SEM image of pure PANI, CV curve of pristine MoS2 nanosheet, galvanostatic charge/discharge curve of pristine MoS2 nanosheet, galvanostatic charge/discharge curves of PANI/MoS2 nanocomposite, table of current densities, specific capacitances, energy densities, and power densities for PANI/MoS2 nanocomposite. See DOI: 10.1039/c6ra00797j |
| This journal is © The Royal Society of Chemistry 2016 |

