 Open Access Article
Creative Commons Attribution 3.0 Unported Licence
Measuring the effects of fractionated radiation therapy in a 3D prostate cancer model system using SERS nanosensors
Victoria L.
Camus
a,
Grant
Stewart
b,
William H.
Nailon
c,
Duncan B.
McLaren
d and
Colin J.
Campbell
*a
aSchool of Chemistry, University of Edinburgh, Edinburgh, EH9 3FJ, UK. E-mail: colin.campbell@ed.ac.uk
bSchool of Clinical Surgery, University of Edinburgh EH16, 4SA, UK
cEdinburgh Radiation Research Collaborative, Oncology Physics, Western General Hospital, Edinburgh EH4 2U, UK
dEdinburgh Radiation Research Collaborative, Edinburgh Cancer Centre, Western General Hospital, Edinburgh EH4 2U, UK
First published on 16th June 2016
Abstract
Multicellular tumour spheroids (MTS) are three-dimensional cell cultures that possess their own microenvironments and provide a more meaningful model of tumour biology than monolayer cultures. As a result, MTS are becoming increasingly used as tumor models when measuring the efficiency of therapies. Monitoring the viability of live MTS is complicated by their 3D nature and conventional approaches such as fluorescence often require fixation and sectioning. In this paper we detail the use of Surface Enhanced Raman Spectroscopy (SERS) to measure the viability of MTS grown from prostate cancer (PC3) cells. Our results show that we can monitor loss of viability by measuring pH and redox potential in MTS and furthermore we demonstrate that SERS can be used to measure the effects of fractionation of a dose of radiotherapy in a way that has potential to inform treatment planning.
Introduction
Intracellular redox potential (IRP) is a measure of how oxidising or reducing the environment is within a cell. It is a function of numerous factors including redox couples, antioxidant enzymes, reactive oxygen species (ROS), pH, oxygen concentration and metabolic pathways. Disruption of the tightly regulated redox status has been linked to the initiation and progression of cancer, however, there is very limited knowledge about the quantitative nature of the redox potential in cancer tumour models.Conventionally, cells are cultured as flat monolayers where their only interactions are with the surface to which they become adhered and to the surrounding media. Such an environment is not a meaningful recreation of the complex tumour microenvironment (TME) and as a result, drugs and disease therapies that prove effective in the monolayer cell culture models often fail to carry this efficacy forward into in vivo trials. The solid TME is highly dynamic and consists of heterogeneous sub-populations of cells, characterised by gradients of O2, pH and redox potential.1 These can be modelled in vitro by 3D cell cultures known as Multicellular Tumour Spheroids (MTS). Unlike 2D cell monolayers, MTS more closely resemble in vivo tumours due to their cellular communication (cell–cell/cell–matrix), formation of extracellular matrices, anchorage-independent growth, and oxygen gradients, and as a result MTS have been widely used for studies of cancer biology and radiobiological investigations.2
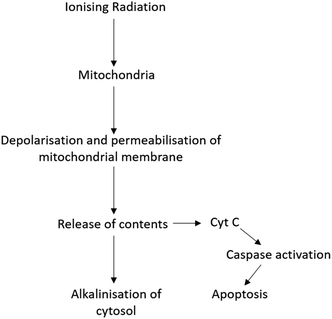
Radiation therapy (RT) is a therapeutic technique primarily used to treat localised disease and destroy cancerous cells. The ionising radiation generates ions and deposits energy in cells, killing the cancerous tissue by damaging DNA and other cell components including membranes, proteins and organelles such as mitochondria. Mitochondria play an important role in regulating apoptosis in response to ionising radiation with radiation exposure resulting in loss of mitochondrial membrane potential (ΔΨm) and permeabilisation (Fig. 1).3 As a result, mitochondria release their contents, including cytochrome C, into the cytosol.3,4 Cytochrome C release in turn induces a series of biochemical reactions that result in caspase activation and subsequent cell death.5,6 Coincident with mitochondrial membrane depolarisation and increased permeabilisation is an increase in intracellular pH, likely due to the release of mitochondrial contents that are naturally more basic pH than the cytosol.7
Despite its wide-spread use, only 33–66% of patients undergoing radiation treatment for prostate cancer are disease-free five years after initial treatment.8 As part of the ongoing effort to improve the efficiency of radiotherapy, a method for measuring and modelling potential tumour response to radiation treatments may assist in optimising the outcome of therapy.
Raman spectroscopy (RS) has been used previously to study radiation response within tumour cells and tissues including lung (H460), breast (MCF7) and prostate (LNCaP) human cell lines.9,10 Raman spectra of biological materials provide spectral fingerprints characteristic of the sample's bimolecular content hence RS can be used to detect cellular changes resulting from metabolic processes in response to radiation treatment.9 RS is a label-free technique that enables the identification of biomarkers in a non-destructive manner, however, Raman is a weak effect and spectra acquired have low signal intensity. The Raman signal can be enhanced when a reporter molecule is in close-proximity to a noble metal such as gold or silver in a technique known as surface enhanced Raman scattering (SERS). While SERS requires the delivery of nanoparticles to the sample of interest (a potential limitation) it can give targeted information such as pH and IRP in live cells and with short acquisition times.
Our group has established a novel technique that allows quantitative measurement of biomarkers, IRP and pH, in live cell cultures using SERS nanosensor technology. These nanosensors consist of redox sensitive and pH sensitive probe molecules attached to gold nanoshells (NS) whose SERS spectra report on the redox potential and pH of the intracellular environment. In this paper, we have investigated whether this novel SERS method could be useful in monitoring the viability of live 3D culture models, and furthermore we have used this method to indicate the best fractionation regimes for maximising cell death in radiotherapy treatment.
Results and discussion
Nanosensor calibrations
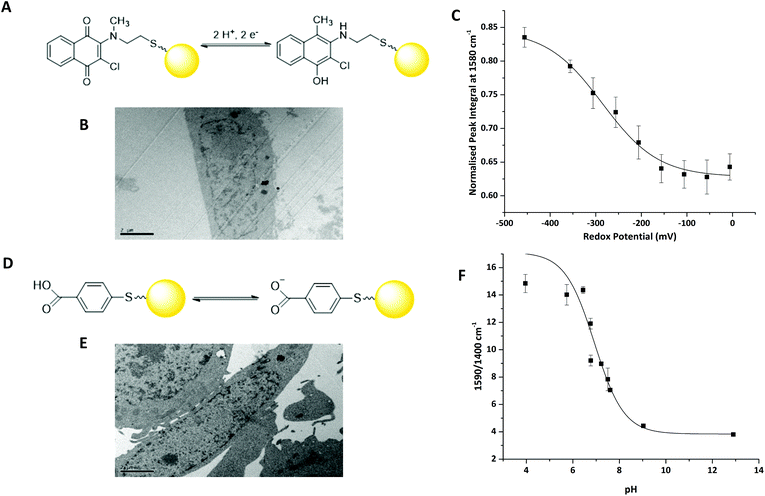
We have previously reported that 2-chloro-3-[methyl(2-sulfanylethyl)amino]-1,4-dihydronapthalene-1,3-dione (MeNQ) can be used as an intracellular redox sensor when functionalised to gold NS (MeNQ·NS, Fig. 2A).11 Using transmission electron microscopy (TEM) we investigated whether MeNQ·NS is readily taken up by the PC3 human prostate cancer cell line. Fig. 2B shows that MeNQ·NS can primarily be found in the cytoplasm of PC3 cells. Spectroelectrochemistry of the probe showed a change in intensity of several signals with varying redox potential.11 The most notable of these peaks were at 1111.47 cm−1 (aliphatic C–C stretching); 1311.47 cm−1 (symmetric ring breathing); 1576.76 cm−1 (asymmetric ring breathing and C–N stretching) and 1671.26 cm−1 (C![[double bond, length as m-dash]](https://www.rsc.org/images/entities/char_e001.gif) O stretching). The peak at ∼1576 cm−1 covers the greatest spectral area and its normalised integral was therefore used to generate the calibration shown in Fig. 2C. MeNQ can be used to measure redox potentials in the range of −100 to −450 mV.
O stretching). The peak at ∼1576 cm−1 covers the greatest spectral area and its normalised integral was therefore used to generate the calibration shown in Fig. 2C. MeNQ can be used to measure redox potentials in the range of −100 to −450 mV.
pMBA is a well-established SERS reporter used for the measurement of pH.12,13 Similar to MeNQ, pMBA can be conjugated to gold NS (Fig. 2D) and transfected into PC3 cells (Fig. 2E) where it can be found predominantly in the cytoplasm. pMBA·NS has a unique SERS fingerprint that changes with pH. The most intense peak is found at ∼1590 cm−1, it is attributed to aromatic ring breathing and most commonly used as a reference peak because it is present at both low and high pH.14 Two other characteristic peaks of pMBA·NS are at ∼1400 cm−1 and ∼1700 cm−1, corresponding to COO− and C![[double bond, length as m-dash]](https://www.rsc.org/images/entities/char_e001.gif) O stretching, respectively. The 1700 cm−1 signal increases with increasing pH, owing to increased deprotonation under acidic conditions, whereas the intensity of the 1400 cm−1 peak increases with decreasing pH.12 These peak heights and areas can potentially be combined with the shift in the centre of the peak located at 1590 cm−1 to generate an algorithm for signal processing and analysis.14 An example using the ratio of 1590/1400 cm−1 peak heights is provided in Fig. 2D. pMBA·NS covers a pH range of pH 6 to pH 8 making it suited to application in the intracellular environment.
O stretching, respectively. The 1700 cm−1 signal increases with increasing pH, owing to increased deprotonation under acidic conditions, whereas the intensity of the 1400 cm−1 peak increases with decreasing pH.12 These peak heights and areas can potentially be combined with the shift in the centre of the peak located at 1590 cm−1 to generate an algorithm for signal processing and analysis.14 An example using the ratio of 1590/1400 cm−1 peak heights is provided in Fig. 2D. pMBA·NS covers a pH range of pH 6 to pH 8 making it suited to application in the intracellular environment.
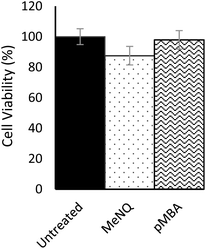
Nanosensor toxicity was assessed by an MTT assay where proliferative capability and mitochondrial function is used as an indicator of cell viability. NADPH-oxidoreductases cleave the tetrazolium ring of yellow tetrazolium dye 3-(4,5 dimethylthiazol-2-yl)-2,5-diphenyltetrazolium bromide (MTT), yielding purple formazan crystals which are insoluble in aqueous solutions. The crystals are dissolved in acidified isopropanol and the resulting purple solution spectrophotometrically measured at 570 nm. Reduction takes place only when oxidoreductase enzymes are active and therefore conversion can be directly related to the number of viable cells. Nanosensor toxicity and subsequent viability was assessed in PC3 monolayers (Fig. 3). Using an unpaired one-tailed T-test with a threshold for significance at P < 0.05, the % viability of cells transfected with pMBA·NS was not significantly different to the untreated control, whereas MeNQ·NS resulted in a small statistically significant change. The negligible toxicity of MeNQ·NS can, however, be optimised by tuning concentrations.
Measuring changes in IRP and pH by chemical treatment of MTS
Redox dysregulation is a hallmark of the aggressive phenotype of prostate cancer, facilitating the development and progression of tumours but also affecting response to therapy.15 Radiation therapy induces oxidative changes in cells by the generation of free radicals. An understanding of the relationships between redox homeostasis and radiation therapy in prostate disease, however, remains unclear.Using our novel SERS technique, the behaviour of MeNQ·NS and pMBA·NS in MTS was initially measured to demonstrate the ability to monitor changes in IRP and pH in live cultures. Oxidative and reductive stress was therefore chemically induced using AAPH and CoCl2, respectively. As shown in Fig. 4, treatment of MTS with AAPH, a membrane permeable free-radical generator, resulted in a more oxidising redox potential (−248 mV) than the untreated MTS (−264 mV). In contrast, treatment with the hypoxia mimetic CoCl2 generated a more reducing IRP (−274 mV). Both treatments resulted in redox potentials that were significantly different to the untreated condition i.e. P < 0.05. In terms of pH, only AAPH treatment resulted in a significant change (P < 0.05) with the MTS measuring an average of pH 6.97 compared to the untreated MTS (pH 7.20). CoCl2 treated MTS measured at pH 7.19 (P > 0.05). These data demonstrate that we can make measurements in 3D culture that correlate with oxidative or reductive stress and that it is important to measure both pH and redox potential in order to understand how the MTS change.
Monitoring the effects of fractionation regimes on MTS IRP and pH
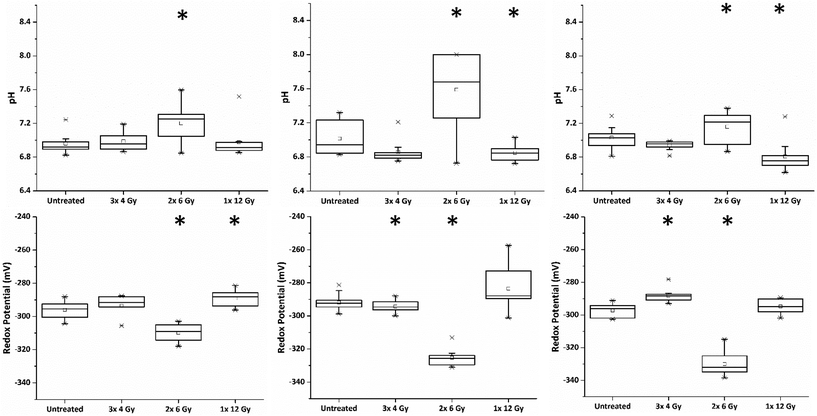
Within the clinic it is common practice to deliver radiation therapy to patients in a series of small doses or ‘fractions’ with the primary advantage being that it allows the repair of sub-lethal radiation damage to normal tissue. Additional benefits over issuing a single large dose include that tumour cells in a radioresistant phase of the cell cycle during one treatment are given an opportunity to cycle into a sensitive phase of the cycle before the next fraction is given.16 Similarly, the interval provides hypoxic (and therefore radioresistant) cancer cells a chance to re-oxygenate between fractions.17In order to investigate the impact of radiation fractionation schedules on MTS viability, a single dose of 12 Gy, and 12 Gy issued in multi-fractions (3 × 4 Gy, 2 × 6 Gy and 1 × 12 Gy) were delivered using a Faxitron X-ray cabinet. Each set of MTS received their final radiation dose on the same day and SERS spectra of MeNQ·NS and pMBA·NS recorded after 24 h incubation. Fig. 5 illustrates the IRP and pH measurement acquired from MTS treated with the aforementioned fractionation schedules from three independently replicated experiments. The resting pH's for each data set were comparable measuring at pH 6.96, 7.01 and 7.03. Treatment with 3 × 4 Gy did not result in a significant change to the untreated pH (P < 0.05) in any data set, whilst 1 × 12 Gy caused a significant decrease in pH (P > 0.05) during the second and third repeats. In contrast, 2 × 6 Gy resulted in an increase in pH (P > 0.05) across all data sets. Measured redox potentials were corrected for pH prior to ANOVA analysis. Untreated PC3 MTS had resting IRPs within the range of −292 to −297 mV. Treatment with 3 × 4 Gy and 1 × 12 Gy resulted in a general shift towards more oxidative redox potentials in the MTS whilst 2 × 6 Gy showed the greatest change in IRP relative to the untreated MTS, generating a significantly more reducing potential in all data sets.
Fluorescent images of MTS following single and fractionated treatment were also recorded so as to correlate changes in IRP and pH with MTS morphology. Untreated MTS naturally possess a rounded exterior (Fig. 6). MTS treated with 3 × 4 Gy and 1 × 12 Gy of ionising radiation showed no obvious change in shape and only small changes in granularity, however, those treated with 2 × 6 Gy demonstrated erosion of the outer layer of cells and fragmentation suggesting loss of structural integrity and viability. The deteriorating morphology of MTS treated with 2 × 6 Gy can be linked to the measured increase in intracellular pH. Alkalosis is an indicator of apoptosis resulting from depolarisation and permeabilisation of the mitochondrial membrane and subsequent release of the alkaline contents into the cytosol. The large alkaline pH change for the 2 × 6 Gy treatment contributes to the large change in redox potential and is clearly a major contributory factor.
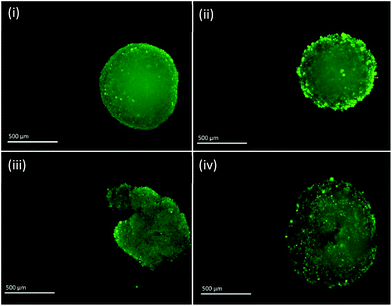 | ||
| Fig. 6 Fluorescent images of PC3 MTS untreated (i) and treated with 3 × 4 Gy (ii), 2 × 6 Gy (iii) and 1 × 12 Gy (iv). Scale bar = 500 μm. | ||
Methods
Nanosensor functionalisation
Approximately 1 mg of the redox reporter MeNQ was weighed out and dissolved in DMSO (1 mL). 8–10 μL of the DMSO solution was then diluted in EtOH to give a 10 μM solution of the probe molecule. The solution was then gravity filtrated once through cotton wool in a glass pipette into a new bijou, and then the filtrate passed through a Millex GP PES 33 mm 0.22 μM filter (Millipore): 50 μL of the resulting solution was added to 450 μL of gold nanoshells (125 nm silica core, 25 nm gold shell, Nanospectra Biosciences Ltd) in an autoclaved eppendorf and stored upright in the fridge overnight. A similar procedure was used for pMBA except the NS were functionalised with 100 μM solution of the compound in 10% EtOH.Nanosensor calibration
Cell culture
PC3 prostate cancer cells were cultured in RPMI 1640 media supplemented with penicillin/streptomycin (10![[thin space (1/6-em)]](https://www.rsc.org/images/entities/char_2009.gif) 000 units per ml) and 10% heat-inactivated Foetal Calf Serum (FCS). Cells were incubated at 37 °C and 5% CO2 in a humidified incubator.
000 units per ml) and 10% heat-inactivated Foetal Calf Serum (FCS). Cells were incubated at 37 °C and 5% CO2 in a humidified incubator.
Intracellular SERS measurements
SERS measurements were recorded using an Ocean Optics QE65 Pro spectrometer (Ocean Optics) with Ocean Optics RPB fibre optic probe. The Ocean Optics was equipped with a 785 nm laser with 350 mW power. Spectra were acquired over a 10–20 s acquisition period using Spectra Suite software and processed using Origin 9 and MATLAB software. MTS were pipetted onto glass slides sputtered with Cr (3 nm) and Au (150 nm) in a Denton Vacuum Desk III prior to measurements.Chemical treatment of MTS
15 μL of media was removed from each hanging-drop and replaced with AAPH (1 mM) or CoCl2 (500 μM) in media for 1 h and 4 h, respectively. SERS spectra of MeNQ·NS and pMBA·NS were then acquired.Radiation treatment of MTS
MTS were irradiated in a Faxitron Cabinet X-ray System (Faxitron X-ray Corporation) operated at 180 kV. The dose rate was 1 Gy per min and this protocol was used for all experiments.Conclusions
In this paper we have demonstrated the use of SERS and nanosensor technology to monitor the in vitro response of MTS to ionising radiation. The pH probe pMBA·NS and redox sensor MeNQ·NS were calibrated and shown to be responsive in the ranges of pH 6–8 and −100 to −450 mV, respectively. Their ability to measure changes in pH and IRP in live MTS cultures was also demonstrated by chemical induction of oxidative and reductive stress using AAPH and CoCl2. Establishment of this model system subsequently enabled the measurement of pH and IRP in MTS following X-ray exposure. A total radiation dose of 12 Gy was issued as a single dose or in multi-fractions (3 × 4 Gy or 2 × 6 Gy). Treatment of MTS with 2 × 6 Gy resulted in a significantly more basic pH and reducing IRP compared to the untreated MTS, as well as clear disintegration of MTS morphology thereby correlating with the link between alkalosis and cell death. In comparison, MTS treated with 3 × 4 Gy and 1 × 12 Gy showed no large changes in either pH or IRP as well as no obvious changes in morphology. Of the three regimes issued, the 2 × 6 Gy multi-fraction was therefore the optimum radiation treatment for inducing cell death.Using this technique the viability of live MTS cultures can be quantitatively assessed and fractionation regimes optimised for maximising cell death. This novel method for measuring the metabolic markers IRP and pH is therefore a potential new platform for in vitro preclinical characterisation of tumour models, enabling clinicians to design and tailor therapy better.
Acknowledgements
The authors gratefully acknowledge EaStCHEM, NHS Lothian and the Jamie King Cancer Research Fund for funding.Notes and references
- R. G. Bristow and R. P. Hill, Nat. Rev. Cancer, 2008, 8, 180–192 CrossRef CAS PubMed.
- D. Khaitan, S. Chandna, M. B. Arya and B. S. Dwarakanath, J. Transl. Med., 2006, 4, 12 CrossRef PubMed.
- N. Taneja, R. Tjalkens, M. A. Philbert and A. Rehemtulla, Oncogene, 2001, 20(2), 167–177 CrossRef CAS PubMed.
- A. Rehemtulla, A. C. Hamilton, N. Taneja, J. Fridman, T. S. Juan, J. Maybaum and A. Chinnaiyan, Neoplasia, 1999,(1), 63–70 CrossRef CAS.
- X. Jiang and X. Wang, Annu. Rev. Biochem., 2004, 73, 87–106 CrossRef CAS PubMed.
- V. Mallikarjun, D. J. Clarke and C. J. Campbell, Free Radicals Biol. Med., 2012, 53, 280–288 CrossRef CAS PubMed.
- J. J. Lemasters and A.-L. Nieminen, Mitochondria in Pathogenesis, Springer Science & Business Media, 2007 Search PubMed.
- D. A. Palacios, M. Miyake and C. J. Rosser, BMC Urol., 2013, 13, 4 CrossRef PubMed.
- S. J. Harder, M. Isabelle, L. DeVorkin, J. Smazynski, W. Beckham, A. G. Brolo, J. J. Lum and A. Jirasek, Sci. Rep., 2016, 6, 21006 CrossRef CAS PubMed.
- S. J. Harder, Q. Matthews, M. Isabelle, A. G. Brolo, J. J. Lum and A. Jirasek, Appl. Spectrosc., 2015, 69, 193–204 CrossRef CAS PubMed.
- P. I. T. Thomson, V. L. Camus, Y. Hu and C. J. Campbell, Anal. Chem., 2015, 87(9), 4719–4725 CrossRef CAS PubMed.
- L. E. Jamieson, A. Jaworska, J. Jiang, M. Baranska, D. J. Harrison and C. J. Campbell, Analyst, 2015, 140(7), 2330–2335 RSC.
- S. W. Bishnoi, C. J. Rozell, C. S. Levin, M. K. Gheith, B. R. Johnson, D. H. Johnson and N. J. Halas, Nano Lett., 2006, 6(8), 1687–1692 CrossRef CAS PubMed.
- K. M. Fisher, J. A. McLeish, L. E. Jamieson, J. Jiang, J. R. Hopgood, S. McLaughlin, K. Donaldson and C. J. Campbell, Faraday Discuss., 2016 10.1039/c5fd00216h.
- A. Paschos, R. Pandya, W. C. M. Duivenvoorden and J. H. Pinthus, Prostate Cancer Prostatic Dis., 2013, 16(3), 217–225 CrossRef CAS PubMed.
- A. J. Mundt, J. C. Roeske, T. D. Chung and R. R. Weichselbaum, Biologic Basis of Radiation Therapy, BC Decker, 2003 Search PubMed.
- J. M. Brown, Cancer Res., 1999, 59(23), 5863–5870 CAS.
| This journal is © The Royal Society of Chemistry 2016 |

