 Open Access Article
Creative Commons Attribution 3.0 Unported Licence
Structural, optical, magnetic and half-metallic studies of cobalt doped ZnS thin films deposited via chemical bath deposition
Muhammad Saeed
Akhtar
ab,
Yousef G.
Alghamdi
c,
Mohammad
Azad Malik
*a,
Rana Muhammad
Arif Khalil
d,
Saira
Riaz
b and
Shahzad
Naseem
b
aSchool of Materials, The University of Manchester, Oxford Road, Manchester M13 9PL, UK. E-mail: azad.malik@manchester.ac.uk
bCentre of Excellence in Solid State Physics, University of the Punjab, Lahore-54590, Pakistan
cFaculty of Science & Art – Rabigh, King Abdulaziz University, Jeddah, Saudi Arabia
dDepartment of Physics, Sahiwal Sub-campus, Bahauddin Zakariya University, 57000, Pakistan
First published on 19th May 2015
Abstract
The results of experimental and theoretical study on structural, optical, magnetic and half-metallic properties of cobalt doped ZnS thin films deposited via chemical bath deposition are presented. Phase pure deposition of cubic ZnS with a slight variation in the lattice constant due to the incorporation of cobalt into the ZnS lattice is observed. It is shown that the crystallite size calculated by the Scherrer equation has an average value of 12 nm. The agglomeration of nanocrystallites leads to the formation of spherical clusters having an average diameter of 170 nm on the substrate surface. Room temperature ferromagnetism in cobalt doped ZnS thin films depending on cobalt concentrations is observed. Such behavior corresponds to the dopant-induced magnetism in the host semiconductor and agrees well with the theoretical predictions in addition to the observation of half metallicity. The variation in the band gap as a function of cobalt concentration is attributed to the structural modification after cobalt doping and occurrence of the quantum confinement phenomenon. Photoluminescence emission characteristics of the samples show the formation of luminescence centers of cobalt ions causing the radiative recombination processes. The increased intensity of PL emissions indicated that the concentration quenching effect did not appear up to the doping concentration of 12 at%.
1. Introduction
ZnS based dilute magnetic semiconductors are highly desired in spintronic devices having dual functionality taking into account the spin degree of freedom along with electronic charge to achieve new functionalities in the devices. High data processing speed, high integration density, low power consumption and non-volatility of such devices make them different from conventional devices working on electronic charge only.The cobalt doped ZnS in the form of thin films is the least investigated material regarding magnetic studies. A literature survey showed that there are only few reports on the study of cobalt doped ZnS thin films. In 2011, deposition of cobalt doped ZnS thin films by spray pyrolysis1 was reported without depositing the pure phase of ZnS first. The films were proved to be cobalt doped zinc oxysulfide instead of zinc cobalt sulfide. In 2012, a study was published regarding the deposition of hexagonal cobalt doped ZnS thin films via pulsed laser deposition,2 and the growth of cobalt doped ZnS nanoparticles using the colloidal method including the investigation of optical and magnetic properties.3–7 Other methods to deposit/synthesize doped ZnS films and nanocrystals include: the aqueous method,6 chemical bath deposition,7,8 refluxing technique,9 precipitation method,10,11 pulsed laser ablation,12 solid state reaction method,13 solvothermal technique14 and hydrothermal method,15,16 aerosol assisted chemical vapour deposition and colloidal thermolysis.17–24 Among these, CBD is the simplest and most cost effective method to synthesize thin films and nano-crystals. The only report found on cobalt doping in ZnS via CBD was presented by Tang et al.7 showing the enhancement in efficient ultraviolet emission of ZnS nanospheres after cobalt doping.
Theoretical investigations on cobalt doped ZnS clusters have also been carried out earlier.25–27 Unfortunately, many experimental and theoretical findings regarding the magnetic properties of such materials are contradictory, showing spin glass or anti-ferromagnetic, paramagnetic and ferromagnetic behaviors.
In this work, we present the optimized growth of cobalt doped nanocrystalline ZnS thin films on glass substrates using the CBD method. The structural, morphological, magnetic and optical properties of deposited thin films have been studied. Theoretical (DFT) calculations on cobalt doped ZnS cubic zinc-blende clusters are also part of this work.
2. Experimental section
2.1 Chemicals
All reagents, zinc chloride, cobalt chloride, thioacetamide and urea were purchased from Sigma-Aldrich and used without further purification. De-ionized water was used as a solvent in all experiments. Acetone, isopropyl alcohol and ethanol were used for the cleaning of the substrate.2.2 Instruments
CBD experiments were carried out in jacketed beakers connected to a thermostatted water bath. A Mettler Toledo meter, which was calibrated against standard pH 2.00, 4.01, and 7.00 buffers, was used to record pH. A Bruker D8 advance diffractometer with Cu-Kα radiation was used for X-ray powder diffraction measurements. The XRD data were recorded across a 2θ range of 20–80° after scanning for three hours and twenty minutes using a step size of 0.02°. SEM and EDX analyses were carried out using a Philips XL 30 microscope. TEM, HRTEM and SAED images were collected using a Tecnai 20 F30 transmission electron microscope at an accelerating voltage of 200 kV. A Lake Shore's 7407 Vibrating Sample Magnetometer was used to obtain the magnetic measurements for these cobalt doped ZnS thin films. The absorbance and transmittance spectra were acquired using an Agilent HP 8453 UV-Vis spectrophotometer. Photoluminescence data were obtained on a Fluorolog 22, HORIBA PL. The density functional calculations were carried out using an Elk-code.2.3 Synthesis of cobalt doped ZnS thin films
The cobalt doped ZnS thin films were deposited onto glass substrates in a chemical bath containing solutions of zinc chloride (0.15 M), cobalt chloride (0.15 M), urea (5 M) and thioacetamide (1 M). All the solutions were prepared in de-ionized water separately. Urea solution was added to the solution of zinc chloride to start the hydrolysis followed by addition of the cobalt chloride solution in appropriate amounts to achieve the desired doping levels of 3, 6, 9 and 12%. Finally, the solution of thioacetamide was added and the mixture was stirred vigorously to achieve homogeneous mixing of precursors. The pH of solution was adjusted to 3.8 by dropwise addition of 0.2 M HCl. The reaction mixture was then transferred into a jacketed beaker attached to a thermostatted bath and maintained at a temperature of 80 °C along with uniform magnetic stirring. After ten minutes of reaction at 80 °C, the transparent solution started turning milky turbid. Glass substrates (1.5 × 2.5 cm2) degreased with ethanol and ultrasonically cleaned with acetone/isopropyl alcohol were immersed vertically in the chemical bath. Substrates were removed from the bath after 3, 3.15, 3.30 and 3.45 hours and washed with de-ionized water. It is important to mention here that deposition time of extra 15 minutes was given to samples as cobalt concentration increased in order to control the morphology and to obtain the grain with almost equal size for all four cobalt concentrations of 3, 6, 9 and 12%, respectively. Precipitates and loosely adhered particles on the substrate were removed by sonication. The films were allowed to dry under a nitrogen stream before further characterization.3. Computational details
A Full Potential Linearized Augmented Plane Wave (FPLAPW) approach was used to solve the Kohn–Sham equation within density functional theory28,29 formulation as it is employed in the Elk-code in order to investigate the electronic and magnetic properties of Zn1−xCoxS alloys. The generalized gradient approximation plus PBE30 along with a Hubbard functional U (GGA-PBE + U) was used for the optimization of the exchange correlation energy. Inside the non-overlapping spheres surrounding the atomic sites (muffin-tin spheres) the wave functions were expanded into spherical harmonics with angular momentum quantum number lmax = 10 and in the interstitial region the wave functions are expanded into a plane wave basis. A plane wave cutoff of rgkmax = 7 was used for the expansion of wave functions inside the interstitial regions. The cutoff for the reciprocal vector of Fourier expansion i.e. gmaxvr was set to 14 and the actual value for smearing, ‘swidth’ = 0.001. Maximum ‘G’ for potential and density was fixed at 12. Maximum angular momentum used for APW functions was 8 and the effective Wigner radius was fixed to 0.65 Å. The muffin-tin radii RMT's were fixed at the value of 1.058 Å so that there is no charge leakage from the core and total energy convergence is ensured. Spin orbit coupling was considered to observe spin polarization. A complex Hermitian eigen solver was used since the crystal has no inversion symmetry. A dense, uniformly distributed mesh of 4 × 4 × 4 k-points was used in the irreducible part of the Brillouin zone ensuring that the Brillouin zone was densely populated. The core electrons were treated fully relativistically by solving the Dirac equation, whereas the valence electrons were treated non-relativistically. Furthermore, we have included the structure optimization to relax the inter-atomic positions upon deformation.4. Results and discussion
Fig. 1 reveals the camera images of synthesis (on the left) and glass substrates (on the right) after the deposition of cobalt doped ZnS thin films with different cobalt concentrations. It is bit difficult to differentiate visually among different deposits since color (off-white) of the samples did not vary too much with the increasing concentration of cobalt.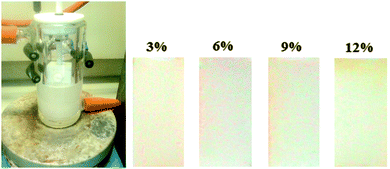 | ||
| Fig. 1 Camera pictures of cobalt doped ZnS synthesis (left) and thin films deposited onto glass substrates (right) at different concentrations of a cobalt precursor into the chemical bath. | ||
4.1 Structural studies
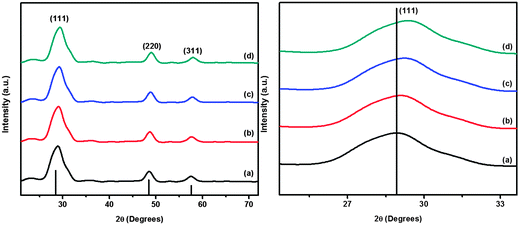
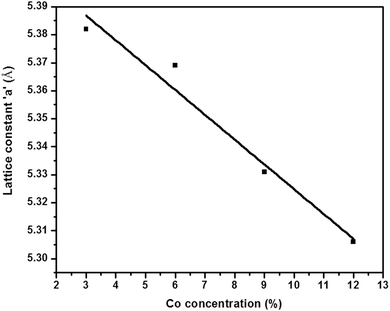
The structural study was performed using the X-ray diffraction technique. The p-XRD patterns (Fig. 2) show the polycrystalline nature of cobalt doped ZnS thin films. The observed diffraction peaks are broad due to the nano size of deposited crystallites. The peaks along the (111), (220) and (311) lattice planes correspond to the standard pattern of cubic ZnS (ICCD # 01-005-0566). The effect of cobalt incorporation into ZnS is evident from the shift of the diffraction peak corresponding to the (111) plane from standard 2θ of 28.86° to slightly higher values, since the ionic radius of Co+2 (0.72 Å) is a bit smaller than that of Zn+2 (0.74 Å). The shift of the diffraction peak (111) is also shown in Fig. 2. A slight change in the lattice constant was observed but the structure remains cubic and is not tailored by the addition of different amounts of cobalt into the ZnS lattice at least up to the detection level of p-XRD.8 Substitution of cobalt into the ZnS lattice is evident by the absence of any peaks corresponding to either cobalt, cobalt sulfide or any other impurity. The Full Width at Half Maximum (FWHM) of p-XRD peaks for all the samples have almost the same value revealing that the deposited thin films are comprised of crystallites with almost equal sizes.The crystallite size calculated using the Scherrer equation for the cobalt doped thin films has an average value of 12 nm. The value of lattice parameter ‘a’ after doping is found to be smaller (5.382 to 5.306 Å) than that of pure ZnS (5.406 Å). The observed decrement in lattice constant is close enough to the reported data in limitation to the expected change in the structure of ZnS due to cobalt doping. The variation in lattice constant as a function of dopant concentration is shown in Fig. 3.
4.2 Morphological studies
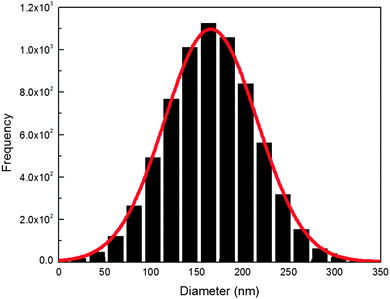
The morphology of cobalt doped ZnS thin films was observed using SEM micrographs. The SEM representative images (Fig. 4) of the ZnCoS thin films show the distribution of almost spherical nanoparticles on the surface of substrates. It was observed that agglomeration of nanocrystallites leads to the formation of spherical clusters having an average diameter of 170 nm onto the substrate surface. The uniform growth of ZnS on glass substrates has been explained earlier.31 The size distribution of particles was analyzed using an image analysis program (ImageJ) and the average diameter of the particles was found to be 170 ± 10 nm (Fig. 5).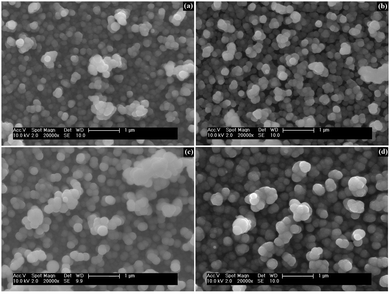 | ||
| Fig. 4 SEM images of cobalt doped ZnS thin films after addition of (a) 3% Co, (b) 6% Co, (c) 9% Co and (d) 12% Co. | ||
The presence of cobalt in ZnS was confirmed using EDX analysis. The amount of dopant (cobalt) added in the precursors was slightly greater than the amount found in the EDX analysis. For a comparative study, the amount of cobalt in the ZnS matrix obtained experimentally would have almost equal value as used for theoretical calculations. The atomic ratios of cobalt extracted through EDX analysis were found to be 3.129247, 6.245236, 9.366940 and 12.53188 at%. Glass constituents such as silicon, sodium, calcium, magnesium, potassium and aluminum were also detected using the EDX spectrum because of the thin nature of films. The atomic ratios of zinc, cobalt and sulfur obtained from EDX measurements are presented in Table 1.
| EDX analysis | 3% Co | 6% Co | 9% Co | 12% Co |
|---|---|---|---|---|
| Element | at% | at% | at% | at% |
| Zinc | 47.84327 | 46.98734 | 43.88581 | 40.99199 |
| Cobalt | 3.129247 | 6.245236 | 9.366940 | 12.53188 |
| Sulfur | 49.02748 | 44.76743 | 46.74725 | 46.47612 |
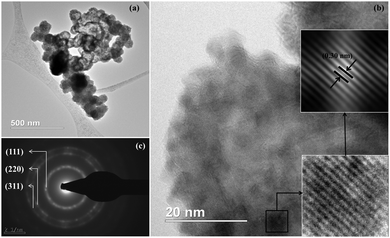
The microstructure of cobalt doped ZnS thin films was also studied in detail with the help of transmission electron microscopy (TEM), high resolution transmission electron microscopy (HRTEM) and selected area electron diffraction (SAED). TEM images of ZnCoS thin films show the clusters of nanoparticles (Fig. 6). The HRTEM image (Fig. 6b) confirms the crystalline nature of the ZnCoS thin films. Inter-planar spacing (0.30 nm) calculated experimentally is in fair agreement with that expected for the (111) plane of the cubic phase of ZnS after reducing lattice spacing due to cobalt incorporation. The SAED pattern (Fig. 6c) shows a set of three circular rings obtained due to diffraction of electrons from the (111), (220) and (311) planes of cubic ZnS. The SAED pattern thus indicates the polycrystalline nature of ZnCoS thin films.
4.3 Optical studies
The optical band gap of cobalt doped ZnS thin films was determined by extrapolating the linear part of the (αhν)2vs. hν curve to the energy axis, when (αhν)2 = 0. The average value of the band gap was found to be 3.6 eV. A slight increment in the value of band gap energy is observed with increasing cobalt concentration. This increment might be attributed to the structural modification after cobalt doping and occurrence of the quantum confinement phenomenon when the crystallites are small enough. The variation of (αhν)2 with photon energy hυ is shown in Fig. 7 representing the direct type of transition. The optical energy gap ‘Eg’ and absorption coefficient ‘α’ are related to the Tauc's relation.32 | (1) |
 | (2) |
 | (3) |
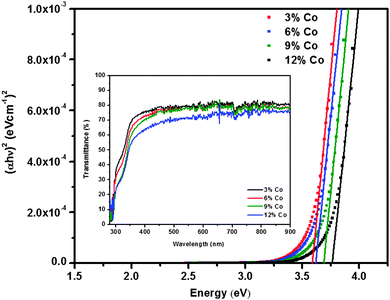 | ||
| Fig. 7 Band gap and transmission plots of cobalt doped ZnS thin films at different cobalt concentrations. | ||
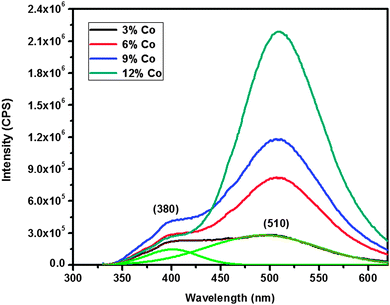
The room temperature photoluminescence spectra of cobalt doped ZnS thin films are shown in Fig. 8. The PL spectra of thin films excited at 340 nm show two emission bands at 380 and 510 nm. The emission at 380 nm results from transition of electrons from the shallow states near the conduction band to the sulfur vacancies present near the valence band in the ZnS lattice, while the emission at 510 nm is attributed to the characteristic of cobalt. The luminescence centers of cobalt ions are formed when cobalt is incorporated into the ZnS host lattice. Since Co+2 is a sensitizing agent, its presence in the host lattice would enhance the radiative recombination processes.34,35 With the increase in doping concentration, the luminescence centers substantially increase which are then responsible for the significant increase in the PL intensity of green emission at 510 nm. Hence from the PL emission spectra, it might be concluded that the Co ions are incorporated successfully into the ZnS lattice as expected, in agreement with the p-XRD results (Fig. 2). The increased intensity of PL emissions indicating that the concentration quenching effect did not appear up to the doping concentration of 12 at% is in contrast to previously reported decay in photoluminescence intensity at the cobalt concentration of 5 at%.16 This observation reveals that cobalt ions substituted the zinc ions even at a higher doping concentration of 12 at% rather than staying at the surface or at interstitial positions. It is very interesting that the cobalt dopant can effectively enhance the intensity of green emission.
4.4 Magnetic studies
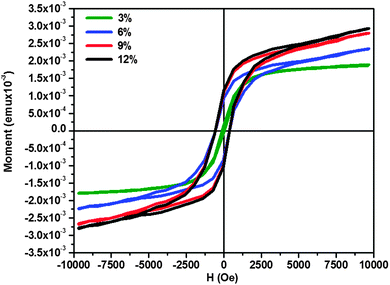
A vibrating sample magnetometer was used to study the magnetic properties of ZnCoS thin films. The M–H curves obtained for all the samples are shown in Fig. 9. A hysteresis loop with negligible values of remanence and retentivity was observed for a cobalt concentration of 3 at% but well-defined hysteresis loops were observed as evidence of room temperature ferromagnetism for higher cobalt concentrations. XRD and HRTEM show single phase deposition of cobalt doped ZnS thin films, hence it could be speculated that ferromagnetism above room temperature originates from the single crystals of ZnCoS nanoparticles. The observed findings are in close agreement with the results reported earlier.6 Thus it would be considered that substitution of cobalt in the ZnS lattice results in the ferromagnetic coupling state without changing the crystal structure which implies that this may be carrier induced ferromagnetism further confirmed using DFT calculations.The coercivity is observed to be invariable at cobalt concentrations of 6–12 at% and applied magnetic field of 293 Oe. The hysteresis loops show that the sample with 3% of cobalt concentration saturates magnetically when the applied magnetic field is 9 kOe. Further increase in cobalt concentration showed systematic increase in the value of saturation magnetization. This systematic increment in magnetization may be due to the introduction of ferromagnetic ordering with increasing cobalt concentration in ZnS thin films. The retentivity for 6 at% concentration of cobalt is 9.33 × 10⁻⁴ emu and is observed to increase for 9 and 12 at% of cobalt concentration to 1.08 × 10⁻³ emu.
4.5 Theoretical investigations
To further investigate the effect of cobalt doping, origin of magnetism and half metallicity, DFT calculations using Elk-code have been performed. The DFT calculations on cobalt doped ZnS were performed by using 64 atom supercells with 32 atoms each for zinc and sulfur. For a comparative study the doping concentration selected for DFT calculations was almost the same as that used in the experiment. Fig. 10 shows the cobalt doped ZnS supercells. The white, yellow and red spheres in Fig. 10 represent the zinc, sulfur and cobalt atoms, respectively.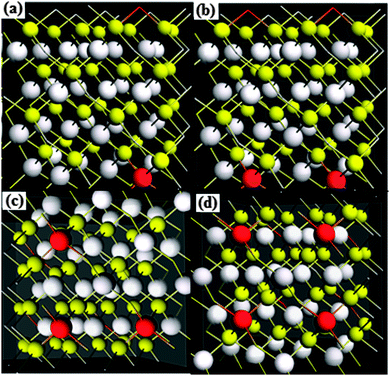 | ||
| Fig. 10 Supercells (2 × 2 × 2) of cobalt doped ZnS (a) 3.125% Co, (b) 6.25% Co, (c) 9.375% Co and (d) 12.50% Co. | ||
The lattice constants were optimized after geometry relaxation. A slight decrement in the lattice parameters was observed in comparison to the experimentally reported value of 5.416 Å,36,37 since there is small difference in the ionic radii of zinc (0.74 Å) and cobalt (0.72 Å). In order to compare the energetic stability of cobalt doped ZnS, we have calculated the formation energies for all doping concentrations. It was observed that the formation energy of cobalt doped ZnS (−2.2183 eV per atom) for a doping concentration of 12.50 at% is a bit less than that for a doping concentration of 3.125 at% (−2.0812 eV per atom) due to the exothermic nature of the reaction (Fig. 11). Energy minimization was performed by a slight variation in lattice parameters of ZnS after cobalt incorporation. The variation in theoretically calculated lattice parameters as a function of cobalt concentration is shown in Fig. 12.
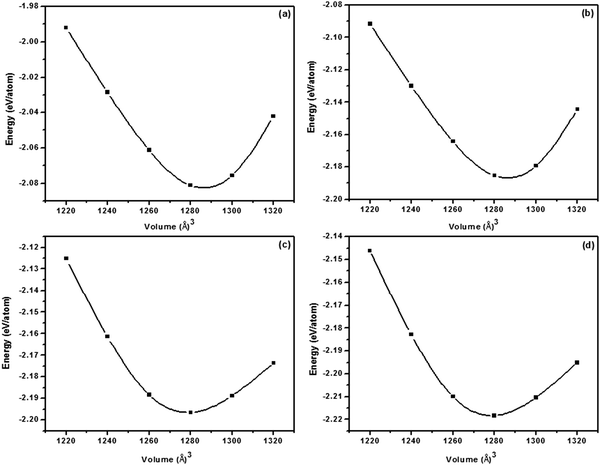 | ||
| Fig. 11 Energy vs. volume curves of cobalt doped ZnS (a) 3.125% Co, (b) 6.25% Co, (c) 9.375% Co and (d) 12.50% Co. | ||
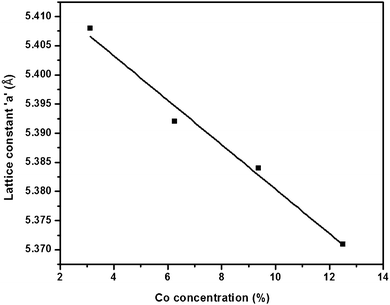 | ||
| Fig. 12 Variation in theoretically calculated lattice constant ‘a’ as a function of cobalt concentration. | ||
It is well known that when a semiconductor is doped with transition metal atoms, it is the p–d hybridization between the p-orbital of the host and the d-orbital of the dopant material that govern the ferromagnetic coupling in the system. In the present case, the p–d hybridization between the Co 3d and the S 3p has a vital role since it is a short-range interaction. The energy of the ZnCoS system is decreased by the p–d hybridization at the ferromagnetic state while at the antiferromagnetic coupling state the total energy remains unchanged. Upon the p–d hybridization interaction, a moment is established around the cobalt atom and then by RKKY interaction, the ferromagnetic coupling state among the atoms of cobalt is formed. Spin-polarized local DOS and particularly the interaction effects in the DOS introduced by the hybridization with the wave functions of neighboring atoms are of much importance. The hybridization with the unoccupied majority and occupied minority ‘d’ states of Co acts like a magnetic field on the conduction band states which induces a spin polarization in the host. The spin polarized partial densities of states of cobalt are given in Fig. 13. The magnetic moments found in the case of cobalt doping are presented in Table 2.
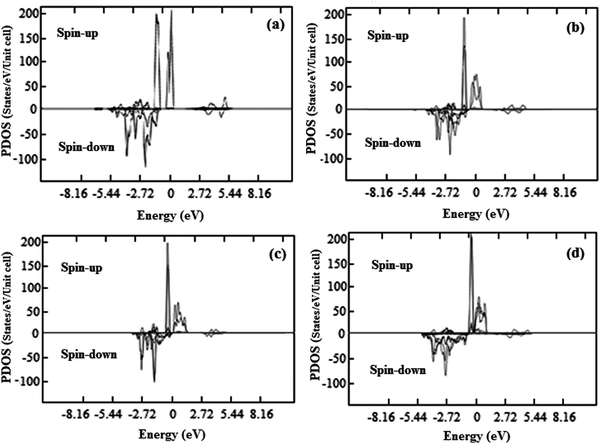 | ||
| Fig. 13 Spin polarized partial density of states (PDOS) for cobalt (a) 3.125% Co, (b) 6.25% Co, (c) 9.375% Co and (d) 12.50% Co. | ||
| Models | Supercell | Concentration of Co (at%) | Lattice constant (Å) | Moment (μB) |
|---|---|---|---|---|
| 1 | Zn31Co1S32 | 3.125 | 5.408 | 2 |
| 2 | Zn30Co2S32 | 6.250 | 5.392 | 3 |
| 3 | Zn29Co3S32 | 9.375 | 5.384 | 4 |
| 4 | Zn28Co4S32 | 12.500 | 5.371 | 4 |
An earlier study on “first-principles theory of dilute magnetic semiconductors” by Sato et al. revealed that the magnetic moment calculated for a 5% cobalt doped ZnS system is 3 μB38 which is well in agreement with that calculated in the present study. Due to the incorporation of cobalt, empty or partially filled majority states at the Fermi level are introduced keeping the minority states occupied due to double exchange (RKKY) interactions. This suggests that cobalt doping leads to 100% spin polarization and results in half metallicity in ZnS. The asymmetry in total density of states (TDOS) after cobalt doping in ZnS is shown in Fig. 14.
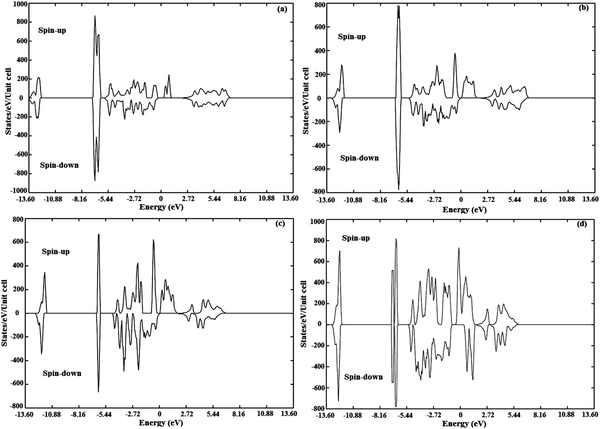 | ||
| Fig. 14 Spin polarized total density of states (TDOS) for ZnCoS (a) 3.125% Co, (b) 6.25% Co, (c) 9.375% Co and (d) 12.50% Co. | ||
5. Conclusions
Cobalt doped ZnS thin films have been deposited onto glass substrates via chemical bath deposition. The p-XRD showed broad peaks correspond to the cubic phase of ZnS with only a slight shift in 2θ values as expected. Cobalt doping resulted in a slight change of lattice parameters of ZnS; the extent of change depended on the concentration of cobalt in the ZnS lattice. SEM images showed the clusters of spherical nanoparticles with almost equal size for all the doping concentrations. TEM/HRTEM/SAED analyses confirmed the deposition of the polycrystalline cubic phase of ZnS. UV-Vis and PL studies revealed that the deposited thin films are highly transparent in the visible region in addition to exhibiting enhanced green emission at higher cobalt concentrations. Magnetic analysis revealed the presence of room temperature ferromagnetism in all the samples. Theoretical investigations were consistent with the experimental data in all aspects in addition to the observation of half metallicity in cobalt doped ZnS clusters. These films have potential applications in advanced optoelectronic and spintronic devices.Acknowledgements
M S Akhtar would like to acknowledge the Higher Education Commission (HEC) of Pakistan for providing financial support as indigenous scholarship (Grant no. 17-5-4(Ps4-264)/HEC/Sch./2007) and Batch-IV and IRSIP scholarship (Grant no. 1-8/HEC/HRD/2013/2503).References
- I. Polat, S. Aksu, M. Altunbas and E. Bacaksiz, Mater. Chem. Phys., 2011, 130, 800–805 CrossRef CAS PubMed.
- S. P. Patel, J. C. Pivin, M. K. Patel, J. Won, R. Chandra, D. Kanjilal and L. Kumar, J. Magn. Magn. Mater., 2012, 324, 2136–2141 CrossRef CAS PubMed.
- L. Ma and W. Chen, Nanotechnology, 2010, 21, 385604 CrossRef PubMed.
- L. Liu, L. Yang, Y. Pu, D. Xiao and J. Zhu, Mater. Lett., 2012, 66, 121–124 CrossRef CAS PubMed.
- S. Sambasivam, D. P. Joseph, J. G. Lin and C. Venkateswaran, J. Solid State Chem., 2009, 182, 2598–2601 CrossRef CAS PubMed.
- W. J. Fang, Y. S. Liu, B. Z. Guo, L. Peng, Y. B. Zhong, J. C. Zhang and Z. J. Zhao, J. Alloys Compd., 2014, 584, 240–243 CrossRef CAS PubMed.
- L. J. Tang, G. F. Huang, Y. Tian, W. Q. Huang, M. G. Xia, C. Jiao, J. P. Long and S. Q. Zhan, Mater. Lett., 2013, 100, 237–240 CrossRef CAS PubMed.
- M. S. Akhtar, M. A. Malik, S. Riaz, S. Naseem and P. O'Brien, Mater. Sci. Semicond. Process., 2015, 30, 292–297 CrossRef CAS PubMed.
- B. Poornaprakash, D. A. Reddy, G. Murali, N. M. Rao, R. P. Vijayalakshmi and B. K. Reddy, J. Alloys Compd., 2013, 577, 79–85 CrossRef CAS PubMed.
- C. S. Pathak, M. K. Mandal and V. Agarwala, Mater. Sci. Semicond. Process., 2013, 16, 467–471 CrossRef CAS PubMed.
- V. Ramasamy, K. Praba and G. Murugadoss, Spectrochim. Acta, Part A, 2012, 96, 963–971 CrossRef CAS PubMed.
- M. Jadraque, A. B. Evtushenko, D. Avila-Brande, M. Lopez-Arias, V. Loriot, Y. G. Shukhov, L. S. Kibis, A. V. Bulgakov and M. Martin, J. Phys. Chem. C, 2013, 117, 5416–5423 CAS.
- Q. Hou, K. Chen, H. Zhang, Y. Li, H. Liu, X. Dong, Y. Huang and Q. Li, J. Phys.: Conf. Ser., 2013, 430, 012076 CrossRef.
- X. B. Chen, N. Yang, X. F. Liu and R. H. Yu, Phys. Scr., 2013, 88, 035703 CrossRef.
- L. Zhang, D. Z. Qin, G. R. Yang and Q. X. Zhang, Chalcogenide Lett., 2012, 9, 93–98 CAS.
- L. Y. Liu, L. Yang, Y. T. Pu, D. Q. Xiao and J. G. Zhu, Mater. Lett., 2012, 66, 121–124 CrossRef CAS PubMed.
- M. A. Malik, M. Motevalli and P. O'Brien, Inorg. Chem., 1995, 34, 6223–6225 CrossRef CAS.
- N. Revaprasadu, M. A. Malik, P. O'Brien and G. Wakefield, J. Mater. Res., 1999, 14, 3237–3240 CrossRef CAS.
- M. A. Malik, M. Motevalli, J. R. Walsh and P. Obrien, Organometallics, 1992, 11, 3136–3139 CrossRef CAS.
- A. A. Memon, M. Afzaal, M. A. Malik, C. Q. Nguyen, P. O'Brien and J. Raftery, Dalton Trans., 2006, 4499–4505 RSC.
- D. J. Binks, S. P. Bant, D. P. West, P. O'Brien and M. A. Malik, J. Mod. Opt., 2003, 50, 299–310 CAS.
- C. Q. Nguyen, A. Adeogun, M. Afzaal, M. A. Malik and P. O'Brien, Chem. Commun., 2006, 2182–2184 RSC.
- M. A. Malik, M. Motevalli, T. Saeed and P. Obrien, Adv. Mater., 1993, 5, 653–654 CrossRef CAS PubMed.
- A. Panneerselvam, C. Q. Nguyen, M. A. Malik, P. O'Brien and J. Raftery, J. Mater. Chem., 2009, 19, 419–427 RSC.
- H. N. Dong, B. Zhang, P. D. Chen, C. L. Zhang and J. Liu, Chin. J. Inorg. Chem., 2012, 28, 1447–1452 CAS.
- J. H. Zhang, J. W. Ding, J. X. Cao and Y. L. Zhang, J. Solid State Chem., 2011, 184, 477–480 CrossRef CAS PubMed.
- H. X. Chen, D. N. Shi and J. S. Qi, J. Appl. Phys., 2011, 109 Search PubMed.
- W. Kohn and L. J. Sham, Phys. Rev., 1965, 140, A1133–A1138 CrossRef.
- P. Hohenberg and W. Kohn, Phys. Rev., 1964, 136, B864–B871 CrossRef.
- J. P. Perdew, K. Burke and M. Ernzerhof, Phys. Rev. Lett., 1996, 77, 3865–3868 CrossRef CAS.
- A. Bayer, D. S. Boyle and P. O'Brien, J. Mater. Chem., 2002, 12, 2940–2944 RSC.
- J. Tauc and A. Menth, J. Non-Cryst. Solids, 1972, 8–10, 569–585 CrossRef CAS.
- S. H. Mohamed, J. Phys. D: Appl. Phys., 2010, 43, 035406 CrossRef.
- P. Yang, M. Lü, D. Xü, D. Yuan, C. Song and G. Zhou, J. Phys. Chem. Solids, 2001, 62, 1181–1184 CrossRef CAS.
- R. Sarkar, C. S. Tiwary, P. Kumbhakar and A. K. Mitra, Phys. Rev. B: Condens. Matter Mater. Phys., 2009, 404, 3855–3858 CrossRef CAS PubMed.
- J. K. Furdyna, J. Appl. Phys., 1988, 64, R29–R64 CrossRef CAS PubMed.
- R. A. Stern, T. M. Schuler, J. M. MacLaren, D. L. Ederer, V. Perez-Dieste and F. J. Himpsel, J. Appl. Phys., 2004, 95, 7468–7470 CrossRef CAS PubMed.
- K. Sato, L. Bergqvist, J. Kudrnovský, P. H. Dederichs, O. Eriksson, I. Turek, B. Sanyal, G. Bouzerar, H. Katayama-Yoshida, V. A. Dinh, T. Fukushima, H. Kizaki and R. Zeller, Rev. Mod. Phys., 2010, 82, 1633–1690 CrossRef CAS.
| This journal is © The Royal Society of Chemistry 2015 |

