 Open Access Article
Creative Commons Attribution 3.0 Unported Licence
On the faradaic selectivity and the role of surface inhomogeneity during the chlorine evolution reaction on ternary Ti–Ru–Ir mixed metal oxide electrocatalysts
Aleksandar R.
Zeradjanin†
a,
Nadine
Menzel‡
b,
Wolfgang
Schuhmann
*a and
Peter
Strasser
*b
aAnalytical Chemistry and Center for Electrochemical Sciences – CES, Ruhr-Universität Bochum, Universitätsstr. 150, D-44780 Bochum, Germany
bThe Electrochemical Energy, Catalysis and Material Science Laboratory – Technical University Berlin, Straße des 17. Juni 124, D-10623 Berlin, Germany. E-mail: pstrasser@tu-berlin.de
First published on 31st March 2014
Abstract
The faradaic selectivity of the chlorine evolution reaction (CER) and oxygen evolution reaction (OER) on the industrially important Ti–Ru–Ir mixed metal oxide is discussed. Absolute evolution rates as well as volume fractions of Cl2 and O2 were quantified using differential electrochemical mass spectrometry (DEMS), while the catalyst surface redox behavior was analyzed using cyclic voltammetry. The spatial inhomogeneity of the surface catalytic reaction rate was probed using Scanning Electrochemical Microscopy (SECM). Although the nature of the competition between electrochemical discharging of chloride ions and water molecules remains elusive on a molecular scale, new insights into the spatial reactivity distribution of the CER and OER were obtained. Oxidation of water is the initial step in corrosion and concomitant deactivation of the oxide electrodes; however, at the same time the nature of interaction between the oxide surface and water is used as a rational indicator of selectivity and catalytic activity. An experimental procedure was established that would allow the study of selectivity of a variety of different catalyst materials using polycrystalline electrode surfaces.
1. Introduction
Controlling selectivity, while reducing the energy consumption of economically important reaction processes for the purpose of chemical energy conversion or industrial synthesis of chemicals, is of high importance, particularly in electrochemical technologies such as brine electrolysis where the chemical reaction is driven by electricity.1 Even though brine electrolysis is an age-old large-scale industrial process, fundamental knowledge of the electrocatalytic reaction, e.g. the impact of the electrode material on the rate of the electrode reaction, which is of utmost importance for improving the reaction efficiency, is still incomplete.2–7 In spite of significant efforts being invested in the fundamental understanding of electrocatalysis, many aspects concerning the nature and reactions occurring at the electrochemical interface are still not known. The main reason for this is probably the lack of analytical tools and procedures that allow realistic insight into the performance of a given catalyst.8 Identification of critical points in the performance of a catalyst is considered to be the basis for the rational design of improved or new catalytic materials.9This is of particular importance in the understanding of electrocatalytic gas evolving reactions (GER) like the hydrogen evolution reaction (HER), the chlorine evolution reaction (CER) or the oxygen evolution reaction (OER). Especially delicate is the case where OER is a side reaction which needs to be minimized or even completely eliminated. This is the case in a CER in which selectivity is a major concern due to the fact that activation of water is a source of an additional oxidation of the transition metal oxides used as catalysts and the main pathway for degradation of the catalyst layer.10,11
Dimensionally stable anodes (DSA)12 based on ternary oxides13–16 such as e.g. Ti–Ru–Ir oxides had been intensively evaluated, and strategies were proposed for improving stability, activity,17,18 or selectivity of ternary oxide electrodes during CER and/or OER.19–25 However, despite regions enriched with one of the components existing on real catalysts usually homogenous mixing of the oxides at the atomic level was assumed.26 These local variations in composition are evidently leading to changes in the local catalytic activity.27,28
This work combines a wide array of complementary analytical techniques, such as differential electrochemical mass spectrometry (DEMS) for the quantification of volume fractions of evolved chlorine and oxygen, cyclic voltammetry (CV) for the analysis of surface redox alterations, scanning electron microscopy and energy dispersive X-ray spectroscopy (SEM/EDX) for monitoring of Ru displacement and scanning electrochemical microscopy (SECM) for monitoring of changes in the local chemistry. The present results provide new insights into the selectivity, faradaic efficiency and surface reactivity on Ti–Ru–Ir ternary oxide surfaces.
2. Experimental part
Cyclic voltammetry was performed in a three electrode setup at room temperature. The working electrode was a Ti–Ru–Ir-based dimensionally stable anode (DSA; Bayer Materials, Leverkusen, Germany) in the form of a chip with a diameter ‘d’ of 15 mm. The exposed diameter ‘ds’ of the sample during analysis was 5 mm. The reference electrode was a Ag/AgCl/3 M KCl electrode (0.207 V per NHE) and the counter electrode was a Pt mesh. The Pt mesh and Ag wire were provided by Goodfellow (Bad Nauheim, Germany). 3.5 M NaCl (99.5%, J. T. Baker, Deventer, The Netherlands) was used as the electrolyte. HCl (37–38%, J. T. Baker, Deventer, The Netherlands) was added until a pH value of 3 was reached. For an estimation of the level of oxidation of the oxide surface during CER NaCl concentrations of 1, 2, 3 and 4 M were used while a pH value of 3 was maintained using HCl and the ionic strength was kept constant using NaNO3 (99%, Roth, Karlsruhe, Germany). The potential of the working electrode was controlled by a bipotentiostat/galvanostat (Jaissle PG 100, Waiblingen, Germany). Samples were pretreated by potential cycling.Differential electrochemical mass spectroscopy
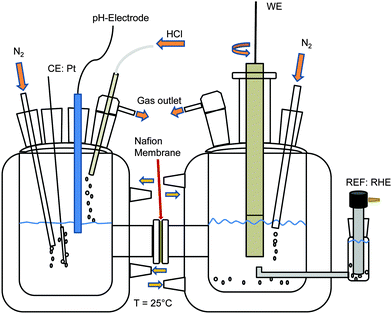
A mass spectrometer with an integrated gas analytic system (OmniStar GSD 301 C; Pfeiffer Vacuum, Asslar, Germany) and a mass range of 1 to 300 amu was used. A quartz capillary with an inner/outer diameter of 150/220 μm, respectively, was connected to the gas outlet of the electrochemical cell.Fig. 1 shows the two compartment cell used in this study, comprising a separate counter electrode (Pt mesh, Alfa Aesar, Karlsruhe, Germany) chamber with pH value control and a working electrode chamber using a 15 mm diameter Ti–Ru–Ir based DSA together with a rotating disk electrode setup (PINE Instruments, Raleigh NC, USA) at a rotation rate of 2000 rpm. Galvanostatic measurements were performed at an industrially relevant current density of 400 mA cm−2 (4 kA m−2) and 25 °C with a flow of 100 ml min−1 N2 through the working electrode chamber at a pH value of 3 and electrolyte concentrations of 1, 2, 3 and 4 M NaCl (99.5%, ChemPur, Karlsruhe, Germany). The reference electrode was a reversible hydrogen electrode (RHE, Gaskatel, Kassel, Germany) which was separated from the working electrode chamber by means of a Haber-Luggin capillary. All electrochemical measurements were controlled by a Gamry Reference 3000 potentiostat/galvanostat (C3 Prozess-und Analysentechnik, Haar, Germany). Calibration of the mass spectrometer with N2 (100 ml min−1), O2 (50 ml min−1) and Cl2 (50 ml min−1) was performed using mass flow controllers (Bronkhorst Mättig, Kamen, Germany).
Scanning electron microscopy and energy dispersive X-ray spectroscopy
SEM/EDX mapping was done using a FEI ESEM Dual Beam Quanta 3D FEG electron microscope equipped with an EDAX Genesis XM2i EDX system. The spatial distribution of Ru was monitored before and after electrolysis.Scanning electrochemical microscopy (SECM)
A modified SECM set-up (Sensolytics, Bochum, Germany) was used. The local activity of the electrodes for CER was evaluated using the sample-generator/tip-collector (SG/TC) and the redox competition (RC) modes of SECM. Details of the measurement strategy and its validity have been described previously.29 Samples with an area of 15 mm in diameter were used exposing only a diameter ‘ds’ of the sample of 5 mm during analysis. The SECM tip current is a measure of the catalytic activity of the sample underneath the tip. In the SG/TC mode the SECM tip (Pt microelectrode, 25 μm) was used for scanning of the sample at a tip-to-sample distance of 20 μm. The sample was continuously polarized at a potential of 1.4 V vs. Ag/AgCl for invoking CER by oxidation of Cl− while the Pt-tip was polarized at a potential of 0.950 V vs. Ag/AgCl to detect changes in the local Cl2 concentration caused by the reaction at the sample. The RC-mode was used to investigate local equilibrium perturbations. The sample was polarized at potentials in the interval from 1.3 to 2.0 V vs. Ag/AgCl while the tip potential was 1.4 V vs. Ag/AgCl. The electrolyte was 5 M NaCl (pH 2). SECM measurements were carried out at room temperature. Data processing was done using OriginPro8G (OriginLab, Northampton MA, USA) and Mira (G. Wittstock, University Oldenburg).3. Results and discussion
In a concentrated aqueous solution of NaCl both OER and CER can occur during anodic polarization at potentials above 1.05 V vs. Ag/AgCl/3 M KCl (see reactions (1) and (2)). The OER is thermodynamically favored over CER. This is why the faradaic selectivity of the CER is an important concern and has to be addressed. The two half-cell processes proceed according to:| 2Cl− ⇄ Cl2 + 2e− E° = 1.15 V/(Ag/AgCl/3 M KCl) | (R1) |
| H2O ⇄ O2 + 4H+ + 4e− E° = 1.02 V/(Ag/AgCl/3 M KCl) | (R2) |
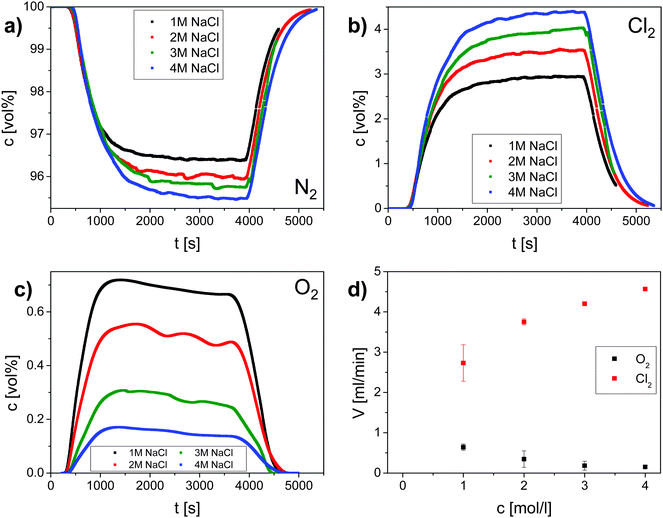
To quantify the faradaic selectivity of each process, that is, the electric charge used exclusively for either reaction, differential electrochemical mass spectrometry (DEMS) was utilized30 (Fig. 2). Gas monitoring and galvanostatic polarization were initiated at the same time (t = 0 s). After an initial phase (∼500 s) a decrease of the nitrogen carrier stream (Fig. 2a) and an increase of the evolved oxygen and chlorine (Fig. 2b and c) were observed. The gas evolution was monitored until it reached a stationary state after about 3600 s when the electrochemical cell was switched off. An increase of the nitrogen carrier stream and a decrease of the evolved gases were observed after around 400 s. According to the literature, OER is supposed to be negligible already at 0.1 M NaCl.31 However, our data here evidence that molecular oxygen is co-evolved even in an electrolyte containing 4 M NaCl (Fig. 2).
Stationary volumetric flows of Cl2 and O2 (Vx, Table 1, columns 5 and 6) were calculated using the measured volume fractions (cx, Table 1, columns 2–4) and the large, quasi-constant flow rate of nitrogen (VN2) according to:
 | (1) |
These stationary gas evolution flow rates represent the electrochemical yields of each gas product. From the calculated flow rates of Cl2 and O2 the selectivity S (Table 1, column 7) for CER was calculated as the ratio between the flow of Cl2 and the sum of the flows for Cl2 and O2. The gas current efficiency (Table 1, columns 8 and 9) was derived by taking the ratio of the measured flow rates of Cl2 and O2 and their corresponding theoretical flow rates (Vtheo) calculated using the total applied current and assuming ideal gas behavior according to:
 | (2) |
To calculate the theoretical flow rates the number of electrons z was 2 in the case of the chlorine evolution reaction and 4 for the oxygen evolution reaction.
| c chloride (M) | c (vol%) | V (ml min−1) | Selectivity S (%) | Gas current efficiency (%) | ||||
|---|---|---|---|---|---|---|---|---|
| NaCl | N2 | O2 | Cl2 | O2 | Cl2 | Cl2 | Cl2 | Cl2 + O2 |
| 1 | 96.77 | 0.63 | 2.60 | 0.65 ± 0.04 | 2.69 ± 0.36 | 80 ± 1 | 50 ± 7 | 74 ± 8 |
| 2 | 96.09 | 0.33 | 3.58 | 0.35 ± 0.14 | 3.72 ± 0.05 | 91 ± 3 | 69 ± 1 | 82 ± 4 |
| 3 | 95.77 | 0.20 | 4.03 | 0.21 ± 0.10 | 4.21 ± 0.05 | 95 ± 2 | 78 ± 1 | 85 ± 3 |
| 4 | 95.48 | 0.15 | 4.36 | 0.16 ± 0.01 | 4.57 ± 0.01 | 97 ± 1 | 84 ± 1 | 90 ± 1 |
From DEMS measurements it becomes clear that the selectivity S for CER increases with increasing chloride concentration and reaches nearly 100% for chloride concentrations above 3 M (Table 1). This can be rationalized by a competition between chloride ions and water molecules for active surface sites considering the experimentally determined kinetic exponent of one for chloride ions during CER. Anodic water activation, which was identified to be the main source for corrosion of DSA, initiates further oxidation of the oxide surface under the formation of unstable higher oxidation states of RuOx according to:32
| H2O + RuOx ⇄ RuOx+1 + 2H+ + 2e− | (R3) |
The values of the gas current efficiency of 74 to 90% (Table 1, column 9) confirm charge consumption due to parasitic processes such as e.g. surface oxidation.
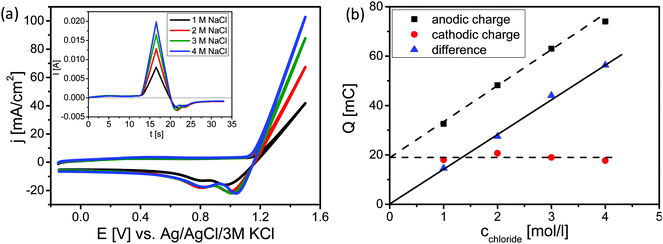
Cyclic voltammetry (CV) was used to estimate the level of oxidation of the surface during the CER (Fig. 3). CVs of the Ti–Ru–Ir based DSA were recorded at the same scan rate, in the same potential range, at the same pH value; however, at different concentrations of NaCl (Fig. 3a).
As expected, with increasing Cl− concentrations higher currents are observed (Fig. 3a). Converting the recorded CVs into the time domain (inset of Fig. 3a) demonstrates that the charge consumed during the anodic sweep increases with the Cl− concentration while the charge during the cathodic sweep is almost constant. Integration of the current over time plot (inset of Fig. 3a) demonstrates that the charge consumed during the anodic sweeps increases linearly with the Cl− concentration. This can be easily understood as the total amount of the produced gases (Cl2 + O2) is increasing with the availability of Cl− ions. It is hence expected that the extrapolation of the dependence between anodic charge and chloride concentration should go nearly through the origin due to the fact that the contribution of OER is supposed to be small (below 20%). However, extrapolation to zero Cl− concentration leads to a residual charge of about 20 mC. It was supposed that CER and OER are increasing in parallel during concomitant oxidation of the DSA surface during the anodic sweep and that reduction of Cl2 and O2 further proceeds during the cathodic sweep while the previously oxidized surface is reduced. However, the charge transferred during the cathodic sweep is identical at all four concentrations of NaCl. Either reduction of Cl2 and O2 is almost negligible at the observed current densities due to a rapid convective transport of Cl2 and O2 away from the rotating solid/liquid interface towards the gas phase. In this case, the charge transferred during the cathodic sweep arises predominantly from the reduction of the higher oxide formed during the anodic sweep. Subtracting the cathodic charge i.e. the charge needed for the reduction of the oxide from the charge during the anodic half scan, the linear correlation of the difference charge and the Cl− concentration starts at zero (see Fig. 3b). Thus, taking into consideration the current efficiencies as obtained in the stationary measurements (Table 1) and the non-stationary measurements we conclude that the constant amount of charge is used for catalyst oxidation.
In an earlier analysis of the CER33 the reaction rate as expressed by the exchange current density was correlated with parameters describing the intrinsic catalytic behavior. Importantly it was found that an increase in the exchange current density corresponds to a decreased charge necessary for the oxidation of the catalyst surface during CER. Thus, the oxidation of the catalyst surface can be interpreted as a redox process that is associated with compositional, geometric and/or electronic alteration processes of the surface or near-surface region promoting the formation of active sites for CER (or OER). The catalytically active sites are non-stoichiometric oxides with coordinately unsaturated sites. Evidently, during anodic polarization, RuOx is converted to a higher oxidation state while simultaneously Cl− ions or water molecules located in the inner Helmholtz plane partially compensate the charge from their free electron pair(s) into the vacant d-orbitals of the transition metal. This is at least partly re-reducing RuOx. The correlation of the kinetics of CER and OER with the enthalpy of the bulk oxidation of RuOx4 as well as with the binding energy of the adsorbed species5 does not sufficiently explain the observed catalytic activity. It was proposed that for a facilitated electrocatalytic reaction the redox potential for the transition from the lower to the higher oxidation state of RuOx has to be close to the potential of the catalyzed reaction.34,35 Evidently, if the reaction occurred at low potentials the catalytic process could not contribute to prevent overoxidation of the surface causing a decrease of the catalytic activity. However, even though the voltammetric surface redox properties can be correlated with the intrinsic catalytic properties of a catalyst, the low faradaic efficiency of only 90% has to be due to a parasitic chemical reaction which consumes electricity. This aspect is generally not discussed and is not accessible using conventional electroanalytical methods.
In order to gain a deeper understanding of the catalytic performance of ternary oxides for CER and OER we focused on the correlation of experimental selectivity and spatial distribution of surface catalytic activity. To achieve this, we analyzed the local catalytic properties of the ternary catalyst coatings. The selectivity of CER is decreasing if the relative amount of RuO2 in the ternary oxide becomes too high. In the case of a Ti/(TiO2 + RuO2) DSA with 40 mol% RuO2 OER becomes more significant.36 Thus, the potential local enrichment of RuO2 was evaluated. The morphology of the investigated DSA coating are shown in Fig. 4a together with an EDX elemental map over the same region (Fig. 4b). Surface enrichment of Ru can be seen.
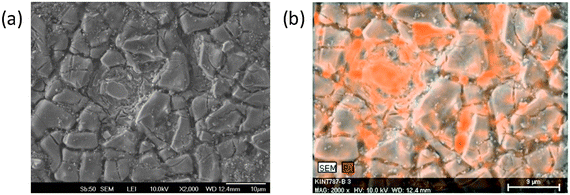 | ||
| Fig. 4 (a) SEM micrograph of the morphological surface structure of a ternary Ti–Ru–Ir oxide DSA. (b) EDX confirms local Ru enrichment at the electrode surface after electrochemical testing. | ||
Due to the local accumulation of RuOx the selectivity between CER and OER is modulated at these sites in favor of OER.
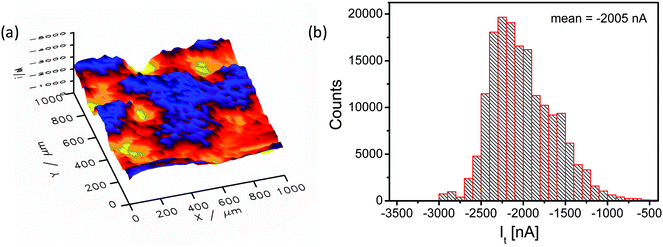
Fig. 5 shows a SECM image of a selected area of the catalyst layer. Cl2 generated at the sample is reduced at the microelectrode tip (Pt disk, 25 μm diameter), thus, visualizing the local CER activity via the tip current. The SECM image is – even at the resolution determined by the rather large tip diameter – displaying local modulations of the electrocatalytic activity (Fig. 5a) in accordance with the EDX mapping (compare Fig. 4b). Obviously, the nanostructured catalyst surface that exhibited a rather homogenous composition after synthesis is locally modified due to surface compositional and structural changes.
The current distribution histogram (Fig. 5b) illustrates the large local variation in the catalytic activity of the sample and hence the amount of generated Cl2. The lowest and highest current values differ by a factor of almost 6 (from −500 to −3000 nA). In the spatial distribution of the electrocatalytic activity (Fig. 5a) two characteristic areas can be distinguished, namely one area with very low activity (x = 450 μm, y = 950 μm) and one with very high activity (x = 500 μm, y = 700 μm).
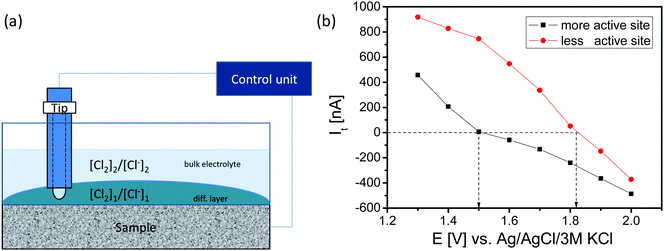
The SECM tip was positioned above these areas and a redox-competition mode experiment was performed in which the SECM tip is polarized to 1400 mV vs. Ag/AgCl to compete with the sample for the available Cl− ions in the gap between the tip and the sample (Fig. 6). In the redox competition mode a more active site is recognized by a sharper decrease of the anodic tip current. The tip senses the concentration ratio [Cl2]/[Cl−] near the sample surface which differs from the one in the bulk of the electrolyte. Upon increasing of the sample potential the tip current initially decreases as expected. However, the tip current even changed to cathodic despite the applied tip potential of 1400 mV. Evidently, due to the high concentration of the formed Cl2 at the sample and the completely diminished Cl− concentration in the gap between tip and sample the Nernst potential of the Cl2/2Cl− redox couple is sufficiently high that Cl2 reduction at the tip becomes possible (Fig. 6b). The sample potential at which the tip current changes from anodic to cathodic is the equilibrium point at which the local Nernst potential of the Cl2/2Cl− redox couple is equal to the applied tip potential. For a less active sample area the initial anodic tip current is higher and the applied sample potential has to be higher for the transition from the anodic to the cathodic tip current.
While the ohmic drop at the tip is supposed to be negligible due to the small current response, the local value of the potential at the sample depends on the ohmic drop. The ohmic resistance was estimated using electrochemical impedance spectroscopy keeping the distance between the sample and the reference electrode constant at 1 cm. The obtained value of 15 Ω, is supposed to be representative for both sample areas because their distance is negligible in comparison to the distance from the reference electrode assuming that the main contribution to the ohmic resistance is from the electrolyte with its gas fraction. At potentials of e.g. 1.5 V and 1.8 V vs. Ag/AgCl, the potentials at which the tip currents change from anodic to cathodic for the two different sample areas, the measured sample currents and derived ohmic drops were 6.1 mA and 92 mV as well as 12.8 mA and 192 mV, respectively. Thus, the local electrode potential at the highly active site was around 1.41 V vs. Ag/AgCl while the local electrode potential at the site with low activity was around 1.63 V vs. Ag/AgCl. Surprisingly, the potential difference between two adjacent sites of a DSA can be as high as 200 mV. Taking into account the local Nernst potential of the Cl2/2Cl− redox couple it becomes possible that during Cl2 formation at one site of the sample Cl2 can be simultaneously reduced at an adjacent site with lower catalytic activity. Consequently, the efficiency and selectivity of CER and OER strongly depend on the control of the local properties of the catalytic surface and in particular on the spatial distribution of the catalytically active sites.
4. Conclusions
The evaluation of the selectivity of simultaneously occurring OER and CER at a ternary Ti–Ru–Ir oxide based DSA sample was performed by combining DEMS and CV. The selectivity of CER over OER is high and is increasing with the Cl− ion concentration to 97% as confirmed by DEMS. The gas current efficiency was constant with values of 80–90% for all Cl− concentrations. The remaining faradaic current is used for the oxidation of the catalyst surface. CV measurements additionally revealed that the inevitable oxidation of the catalyst surface is not only a consequence of the simultaneously occurring OER, but rather an important part of the process of formation of active surface sites which is unequivocally necessary for sustained efficient CER. However, the faradaic efficiency was only 90% which suggested evaluating local properties of the catalyst surface. On the one hand, the displacement of Ru causing a high density of active sites at some regions may be responsible for an inhomogeneous distribution of the current density. Using SECM in the redox competition mode allowed extracting sample potentials for differently active sample areas at which the tip current changed from anodic to cathodic. This suggest that due to local varying equilibria between the sample potential and the local Nernst potential of the Cl2/2Cl− redox couple the anodically produced Cl2 can be re-reduced at nearby sites of the same DSA surface. This could explain the “disappearance” of charge used for electrolysis.Acknowledgements
The authors are grateful to the BMBF in the framework of the project “Innovative Technologien für Ressourceneffizienz rohstoffintensiver Produktionsprozesse: Effizienzsteigerung bei der Chlorherstellung” (FKZ: 033R018E). Financial support by the German Research Foundation (DFG) through grant STR 596/3-1 under the Priority Program 1613 “Regeneratively formed fuels by light driven water splitting” is gratefully acknowledged.References
- S. Trasatti, Electrochim. Acta, 2000, 45, 2377–2385 CrossRef CAS
.
- J. O. Bockris, Science, 1972, 176, 1323 CAS
.
- B. E. Conway and B. V. Tilak, Electrochim. Acta, 2002, 47, 3571–3594 CrossRef CAS
.
- S. Trasatti, Electrochim. Acta, 1984, 29, 1503–1512 CrossRef CAS
.
- I. C. Man, H.-Y. Su, F. Calle-Vallejo, H. A. Hansen, J. I. Martínez, N. G. Inoglu, J. Kitchin, T. F. Jaramillo, J. K. Nørskov and J. Rossmeisl, ChemCatChem, 2011, 3, 1159–1165 CrossRef CAS
.
- H. Dau, C. Limberg, T. Reier, M. Risch, S. Roggan and P. Strasser, ChemCatChem, 2010, 2, 724–761 CrossRef CAS
.
- I. Katsounaros, S. Cherevko, A. R. Zeradjanin and K. J. J. Mayrhofer, Angew. Chem., Int. Ed., 2014, 53, 102–121 CrossRef CAS PubMed
.
- A. R. Zeradjanin, E. Ventosa, A. S. Bondarenko and W. Schuhmann, ChemSusChem, 2012, 5, 1905–1911 CrossRef CAS PubMed
.
- A. S. Bandarenka, E. Ventosa, A. Maljusch, J. Masa and W. Schuhmann, Analyst, 2014, 139, 1274 RSC
.
- A. R. Zeradjanin, A. A. Topalov, Q. Van Overmeere, S. Cherevko, X. Chen, E. Ventosa, W. Schuhmann and K. J. J. Mayrhofer, RSC Adv., 2014, 4, 9579 RSC
.
- G. N. Martelli, R. Ornelas and G. Faita, Electrochim. Acta, 1994, 39, 1551–1558 CrossRef CAS
.
- H. B. Beer, J. Electrochem. Soc., 1980, 127, 303C CrossRef CAS PubMed
.
- T. A. F. Lassali, J. F. C. Boodts and S. Trasatti, Electrochim. Acta, 1994, 39, 1545–1549 CrossRef CAS
.
- L. A. De Faria, J. F. C. Boodts and S. Trasatti, Electrochim. Acta, 1997, 42, 3525–3530 CrossRef CAS
.
- N. Menzel, E. Ortel, K. Mette, R. Kraehnert and P. Strasser, ACS Catal., 2013, 3, 1324–1333 CrossRef CAS
.
- K. C. Neyerlin, G. Bugosh, R. Forgie, Z. Liu and P. Strasser, J. Electrochem. Soc., 2009, 156, B363 CrossRef CAS PubMed
.
- J. F. C. Boodts, J. Electrochem. Soc., 1990, 137, 3784 CrossRef CAS PubMed
.
- K. C. Neyerlin, G. Bugosh, R. Forgie, Z. Liu and P. Strasser, J. Electrochem. Soc., 2009, 156, B363–B369 CrossRef CAS PubMed
.
- K. Macounová, M. Makarova, J. Jirkovský, J. Franc and P. Krtil, Electrochim. Acta, 2008, 53, 6126–6134 CrossRef PubMed
.
- V. Petrykin, K. Macounova, O. A. Shlyakhtin and P. Krtil, Angew. Chem., 2010, 122, 4923–4925 CrossRef
.
- V. Petrykin, K. Macounova, J. Franc, O. Shlyakhtin, M. Klementova, S. Mukerjee and P. Krtil, Chem. Mater., 2011, 23, 200–207 CrossRef CAS
.
- T. Reier, M. Oezaslan and P. Strasser, ACS Catal., 2012, 2, 1765–1772 CrossRef CAS
.
- N. Menzel, E. Ortel, R. Kraehnert and P. Strasser, ChemPhysChem, 2012, 13, 1385–1394 CrossRef CAS PubMed
.
- B. Johnson, F. Girgsdies, G. Weinberg, D. Rosenthal, A. Knop-Gericke, R. Schlögl, T. Reier and P. Strasser, J. Phys. Chem. C, 2013, 117, 25443–25540 CAS
.
- E. Ortel, T. Reier, P. Strasser and R. Kraehnert, Chem. Mater., 2011, 23, 3201–3209 CrossRef CAS
.
- J. Gaudet, A. C. Tavares, S. Trasatti and D. Guay, Chem. Mater., 2005, 17, 1570–1579 CrossRef CAS
.
- R. Chen, V. Trieu, A. R. Zeradjanin, H. Natter, D. Teschner, J. Kintrup, A. Bulan, W. Schuhmann and R. Hempelmann, Phys. Chem. Chem. Phys., 2012, 14, 7392 RSC
.
- A. R. Zeradjanin, F. La Mantia, J. Masa and W. Schuhmann, Electrochim. Acta, 2012, 82, 408–414 CrossRef CAS PubMed
.
- A. R. Zeradjanin, T. Schilling, S. Seisel, M. Bron and W. Schuhmann, Anal. Chem., 2011, 83, 7645–7650 CrossRef CAS PubMed
.
- M. Wohlfahrt-Mehrens and J. Heitbaum, J. Electroanal. Chem. Interfacial Electrochem., 1987, 237, 251–260 CrossRef CAS
.
- S. Ardizzone, J. Electrochem. Soc., 1982, 129, 1689 CrossRef CAS PubMed
.
- A. R. Zeradjanin, N. Menzel, P. Strasser and W. Schuhmann, ChemSusChem, 2012, 5, 1897–1904 CrossRef CAS PubMed
.
-
P. Gu, Doctoral Thesis, University of Otawa, Canada, 1990
.
- Y. Matsumoto and E. Sato, Mater. Chem. Phys., 1986, 14, 397–426 CrossRef CAS
.
- A. C. C. Tseung and S. Jasem, Electrochim. Acta, 1977, 22, 31–34 CrossRef CAS
.
- L. D. Burke and O. J. Murphy, J. Electroanal. Chem. Interfacial Electrochem., 1980, 109, 199–212 CrossRef CAS
.
Footnotes |
| † Present address: Max Planck Institute for Iron Research, Interface Chemistry and Surface Engineering, Max Planck Straße 1, D-40237 Düsseldorf, Germany. |
| ‡ Present address: Fraunhofer Institute for Mechanics of Materials IWM, Walter-Huelse-Straße 1, D-06120 Halle, Germany. |
| This journal is © the Owner Societies 2014 |

