 Open Access Article
Creative Commons Attribution 3.0 Unported Licence
Microkinetics of oxygenate formation in the Fischer–Tropsch reaction†
Rutger A.
van Santen
*ab,
Minhaj
Ghouri
ab and
Emiel M. J.
Hensen
a
aLaboratory of Inorganic Materials Chemistry, Department of Chemical Engineering and Chemistry, Eindhoven University of Technology, PO Box 513, 5600MB, Eindhoven, The Netherlands. E-mail: r.a.v.santen@tue.nl
bInstitute for Complex Molecular Systems, Eindhoven University of Technology, PO Box 513, 5600MB, Eindhoven, The Netherlands
First published on 29th January 2014
Abstract
Microkinetics simulations are presented on the intrinsic activity and selectivity of the Fischer–Tropsch reaction with respect to the formation of long chain oxygenated hydrocarbons. Two different chain growth mechanisms are compared: the carbide chain growth mechanism and the CO insertion chain growth mechanism. The microkinetics simulations are based on quantum-chemical data on reaction rate parameters of the elementary reaction steps of the Fischer–Tropsch reaction available in the literature. Because the overall rate constant of chain growth remains too low the CO insertion chain growth mechanism is not found to produce higher hydrocarbons, except for ethylene and acetaldehyde or the corresponding hydrogenated products. According to the carbide mechanism available quantum-chemical data are consistent with high selectivity to long chain oxygenated hydrocarbon production at low temperature. The anomalous initial increase with temperature of the chain growth parameter observed under such conditions is reproduced. It arises from the competition between the apparent rate of C–O bond activation to produce “CHx” monomers to be inserted into the growing hydrocarbon chain and the rate of chain growth termination. The microkinetics simulations data enable analysis of selectivity changes as a function of critical elementary reaction rates such as the rate of activation of the C–O bond of CO, the insertion rate of CO into the growing hydrocarbon chain or the rate constant of methane formation. Simulations show that changes in catalyst site reactivity affect elementary reaction steps differently. This has opposing consequences for oxygenate production selectivity, so an optimizing compromise has to be found. The simulation results are found to be consistent with most experimental data available today. It is concluded that Fischer–Tropsch type catalysis has limited scope to produce long chain oxygenates with high yield, but there is an opportunity to improve the yield of C2 oxygenates.
1. Introduction
In addition to hydrocarbons the Fischer–Tropsch reaction, which is an important conversion step in the overall process that converts coal or natural gas into liquid hydrocarbon fuels, can also produce oxygenates.1–3 The selectivity towards their formation strongly depends on reaction conditions as well as the catalytic material used. To produce oxygen containing hydrocarbons from synthesis gas (a mixture of CO and H2) instead of by selective oxidation of the corresponding hydrocarbons may have advantages in terms of raw materials used or processing requirements. In heterogeneous catalysis the oxygenated long-chain hydrocarbon product can be formed through two essentially different reaction processes that are excellently reviewed in ref. 4 and 5.CO can be initially hydrogenated to methanol and the methanol undergoes aldol type reactions that lead to a mixture of branched alcohols. The main investigated catalysts for this process are modified methanol catalysts, based on Cu, promoted by ZnO, Cr2O3 or additional additives to catalyze formation of higher alcohol oligomers.6
Alternative catalyst systems to be considered here are based on the Fischer–Tropsch reaction. In this reaction instead of becoming hydrogenated CO initially decomposes into an adsorbed “CHx” intermediate that initiates an oligomerisation reaction. Oxygenate formation arises from the insertion reaction of CO in the growing adsorbed hydrocarbon chain. A transition metal component of such catalysts, that has been extensively studied, is Rh.7,8
We will present results of microkinetics simulations that address the improvement of selectivity of oxygenate formation versus that of hydrocarbon formation, which is a key issue with respect to the application of this catalytic system.
In order to study the microkinetics of this reaction two main competitive mechanistic proposals for the hydrocarbon chain growth reaction have to be considered.9 The most generally accepted is the carbide mechanism.10 According to this mechanism chain growth occurs by consecutive insertion of CHx intermediates. This is different from the alternative proposal, originally by Pichler and Schulz11 that proposes hydrocarbon growth through CO molecule insertion into the growing hydrocarbon chain. There is no consensus on which of the two mechanisms is preferred. For a recent analysis we refer to the literature.12,13 To decide between the two mechanistic options of chain growth is practically important because it provides different criteria for catalyst composition and structure choices to optimize CO conversion rates and product selectivity.
We will compare these criteria with experimental information as mainly summarized in the two review papers.4,5
All of the known Fischer–Tropsch catalysts produce oxygenates, but with widely varying selectivities, which not only depend on the catalyst material, but also strongly on reaction conditions.14
Important additional questions with respect to the optimization of the catalyst relate to structure dependence, the role of promoters and the use of alloys.
The microkinetics simulations to be presented are based on consideration of the complete set of elementary reaction steps leading to such products. An earlier study also based on such an approach was reported by Storsaeter et al.15 Since several elementary reaction steps compete, the microkinetics simulations will have to be solved without making a priori assumptions on rate controlling steps. For this reason the ordinary differential equations that follow from the kinetics schemes used will be solved directly using the ordinary differential equations (ODE) suite which comes with the software program Matlab©.
The simulation strategy is similar to that we used in previous papers,12,13 which however only considered hydrocarbon formation and did not include oxygenate formation as will be done here.
The experimental distribution of Fischer–Tropsch hydrocarbon chains shows an approximately ASF (Anderson–Schulz–Flory) distribution.3,16 When the product distribution is plotted as a function of hydrocarbon chain length an exponential distribution is found. This implies that the chain growth rate is independent of hydrocarbon chain length beyond a particular chain length that is typically for C3 and higher chain length. The slope of this distribution plot gives chain growth probability α (see also eqn (1)). We have also used this property in the simulations by assuming the microkinetics chain growth parameters to be independent of chain length.
The molecular data on reaction intermediates and activation energies of elementary reaction steps will be based on published quantum-chemical data, which we have extensively reviewed elsewhere for the carbide mechanism12,13 and for the CO insertion chain growth mechanism in ref. 21. The input data used can be considered representative of Co, Ru or Rh metal surfaces with different structures. For consistency the microkinetics elementary reaction rate data have been adapted to confirm with the overall thermodynamics of the relevant Fischer–Tropsch products.
Different surface topologies change significantly the relative rate constants of CO activation versus that of methane formation, chain growth termination and C–C bond formation.
In the case of the chain growth reaction through CO insertion proposed by Cheng et al.17 for stepped and non-stepped Co (0001) surfaces and in a later paper we demonstrated that most of the additional published quantum-chemical data lead to the conclusion that this reaction mechanism can be excluded.13,21 However recently an interesting paper by Saeys et al.18 appeared that demonstrated a high sensitivity of key activation energy parameters to surface coverage. Of special interest is their suggestion that at high coverage lateral effects decrease the activation barriers for CO insertion into the growing hydrocarbon chain substantially, which would favour high chain growth according to this reaction route. This is important because simulations indicate12 that long chain hydrocarbon selectivity is consistent with a high coverage of CO. For this reason we took the high surface coverage reaction energy data of Saeys et al.18 calculated for the Co(0001) surface as the default values for the CO insertion chain growth reaction.
In the microkinetics simulations to be presented here we will calculate selectivity and CO conversion rates under practical conditions. We will be interested in catalyst performance changes as a consequence of different choices of rate parameters that reflect catalyst composition as well as structure.
It will appear that selectivity to long chain oxygenate formation depends on the balance of several elementary rate constants that sometimes counteract. In the discussion and conclusion section the optimum microkinetics relations between elementary rate constants will be discussed. Through quantum-chemistry this can be related to composition and catalyst structure requirements, which provide a basis to compare theory with experiment in the Conclusion: comparison of theory and experiment section.
2. Method
Microkinetics model descriptions including the mechanistic schemes in terms of the complete set of elementary reactions and their corresponding rate parameters for both the carbide chain growth mechanism as well as CO insertion mechanism studied in this report are presented in this section.2.1 Carbide chain growth mechanism
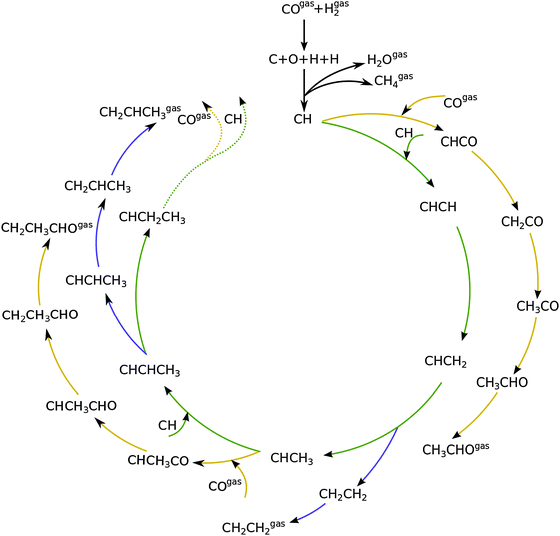
Fig. 1 shows a schematic presentation of the kinetic model according to the carbide chain growth model explored in the present work. Mechanistic pathways leading to the formation of up to C3 olefin and oxygenates can be seen in the figure. Based on previous work13,19 the CHads monomer is considered as the building block that gets incorporated into the growing chain. The chain growth pathways are green color coded in the figure. Oxygenate termination pathways via a CO insertion step are represented in yellow and elementary steps leading to the termination of olefins are shown in blue. The CHads monomer, which is formed by the hydrogenation of carbon from the directly dissociated CO, is considered to be the building block for subsequent chain growth.There are three prerogatives for the initial CHads monomer. It can undergo further hydrogenation steps desorbing as methane. Another path for it is the coupling with CO to form CHCO. This species further goes through three hydrogenation steps to terminate as acetaldehyde. The final option for the CHads monomer is to couple with another CHads species leading to the pathway towards chain growth. This CHCH species on the surface can now go through a hydrogenation step to form CHCH2. Further addition of a hydrogen atom to the primary carbon leads to the termination of the chain as an olefin, ethylene in this case. Addition of the hydrogen atom to the secondary carbon atom leads it towards further chain growth. This alkylidene type of chain can either terminate into a corresponding aldehyde by going through CO insertion and subsequent hydrogenation steps; recombination of this with CH leads to either its termination into an olefin or towards further chain growth. The work presented here includes the formation of olefins and oxygenates up to a chain length of C50.
As discussed elsewhere, another important technical aspect of first principle microkinetics simulations is that simulations are to be done including production of hydrocarbon chains of sufficient length so as to prevent spurious cut-off effects that result from reversibility of all the chain growth reactions included.20 The chain growth parameter α for oxygenate formation and alkane formation has to be the same, which can be used as a test criterion for convergence of the simulations.
Fig. 2 shows the relative adsorption energies and the activation barriers for various intermediates leading to the formation of propionaldehyde. Based on available quantum chemical data we have constructed the energy profiles of this reaction. Formation of all longer hydrocarbons as well as oxygenates is considered to be homologous and proceeds through insertion of a CH species in agreement with the chain growth model proposed before for Ru.19 CHads is the monomer that is incorporated into the growing adsorbed hydrocarbon chain. This mechanism corresponds to the generally accepted carbide mechanism in which CHx species is the surface species to be inserted into the growing hydrocarbon chain. The reaction energy diagrams of all higher carbon number products (hydrocarbons as well as oxygenates) have similar elementary reaction rate parameters, so that the product distribution may be expected to correspond to the logarithmic ASF distribution with chain growth parameter α independent of the chain length.
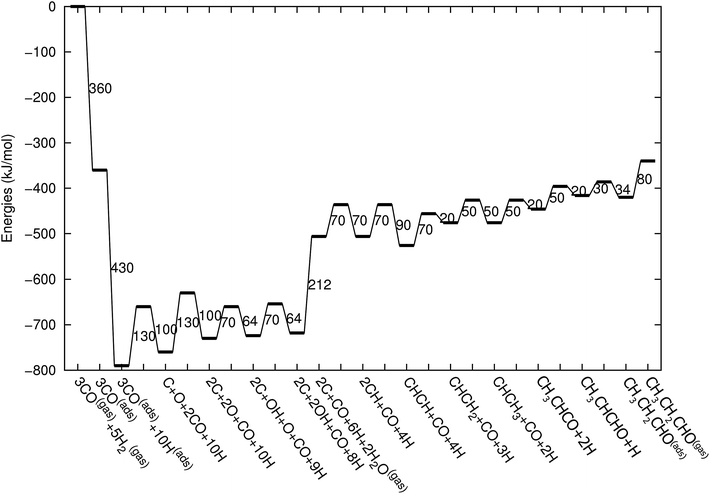 | ||
| Fig. 2 The reaction energy diagram, with default values of activation energies and reaction energies for the formation of propionaldehyde as a function of progress of the reaction. Reaction intermediate energies and relative stabilities with respect to the gas phase are given. For additional details we refer to ESI.† | ||
Activation entropies have been chosen to be different from zero only for reactions between the gas phase and the solid. Further details about the actual prefactors used and their calculation details can be found in the ESI† accompanying this article. Readsorption from the gas phase is ignored in the simulations.
The rate constants used in the microkinetics schemes are based on activation energies available from recent DFT quantum-chemical calculations reviewed in ref. 21. Activation energies of elementary reaction rate constants and relative energies of surface intermediates will depend on surface structure as well as catalyst composition. In the simulations we have selected default values that are representative for reactive Co or Ru surfaces. Variation of parameters as the activation energies of the CO dissociation reaction or the CHads to methane transformation reaction represent different choices of surface or composition.
Quantum-chemical data based on DFT computations cannot be expected to be more accurate than 10 kJ mol−1. For this reason absolute values of predicted elementary reaction rates in comparison to experiment may be expected to have a significant error. In microkinetics studies the systematic errors that lead to the inaccuracies of the quantum-chemical calculations lead sometimes to approximate cancellations, which reduces the error in predicted temperature maxima in such simulations. So may errors in energies of adsorption cancel errors in activation energies.
In the comparative kinetic studies considered here we have maintained most of the reaction energy data invariant, but have changed reaction rate data of elementary reaction steps of interest by altering the activation energies substantially more than 10 kJ mol−1. The results obtained should be considered qualitative in an absolute sense, but reliable in a comparative sense.
Fig. 3 shows the energy diagrams for the production of propylene as well as higher olefins when the oxygenate products are included in the model and when there is no oxygenate production. An important reference to the quantum-chemical data is Kapur et al.22 For a review we refer to Van Santen et al.21
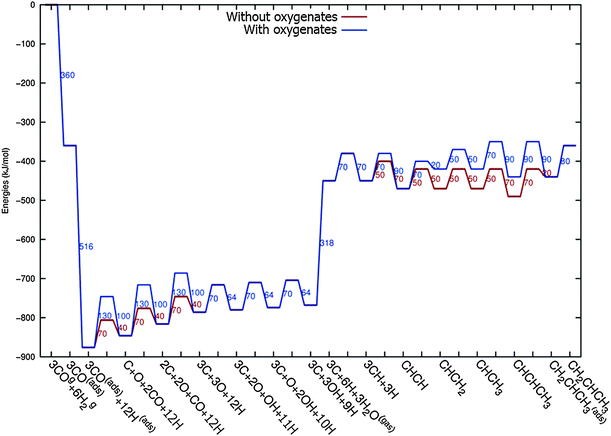 | ||
| Fig. 3 The reaction energy diagram for the formation of propylene when the product selectivity is biased towards the production of oxygenates (blue line) and when the oxygenates are not included in the model (red line). Default values for (activation) energies are used in the diagram. Energies are given with respect to the gas phase. For additional details we refer to ESI.† | ||
The energy diagram when no oxygenates are produced is the same as used earlier.12,13 As in previous simulations we have chosen H2O formation to be a relatively fast reaction.
2.2. CO insertion chain growth mechanism
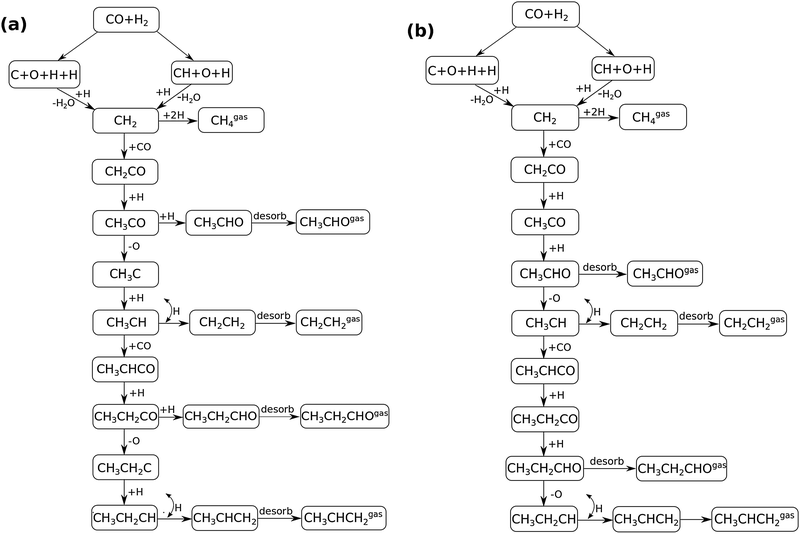
In Fig. 4 the two reaction mechanistic schemes studied for the CO insertion chain growth mechanism are shown. They differ by a choice of which oxygen containing surface intermediate cleaves its bond. In scheme (a) the C–O bond cleaves in the CH3CO species, in scheme (b) this occurs in the aldehyde molecule. Which of the two steps occur determines the competitive reaction steps with chain growth. While in case (a) rapid hydrogenation of CH3CO would cause interference with a high chain growth rate, in case (b) this would be the desorption of aldehyde. The corresponding reaction diagrams shown in Fig. 5 and 6 have been constructed using the high coverage data of Saeys and co-workers on Co(0001).18 Since their data are not complete and do not close the catalytic reaction cycle we have used representative data from available literature.12,21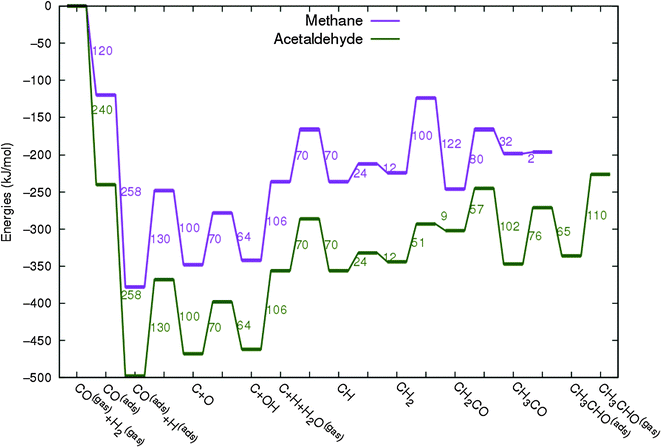 | ||
| Fig. 5 The reaction energy diagram for the formation of methane and acetaldehyde via the CO insertion chain growth model. The formyl route of CO activation leading to CH species from CO is included in the simulations but is not implied here. Higher oxygenates formation is homologous to the rate of formation of acetaldehyde. The last steps in methane formation reaction energy diagram concern CH3,ads and CH4,ads formation. Part of the reaction energies data is adapted from Saeys et al.18 Default values for (activation) energies have been used. Energies are given with respect to the gas phase. For additional information we refer to ESI.† | ||
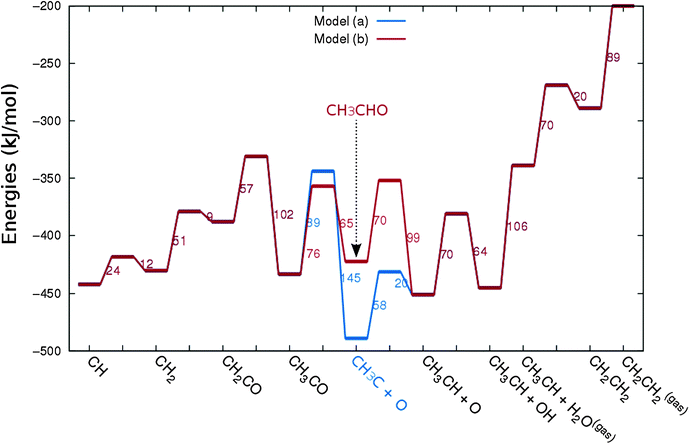 | ||
| Fig. 6 The reaction energy diagram for the formation of ethylene via the CO insertion chain growth mechanism. Higher olefin formation is homologous to the rate of formation of ethylene. This energy diagram corresponds to the scheme shown in Fig. 4(a) and (b). Reaction energies data are adapted from Saeys et al.18 Default values for the (activation) energies have been used. Energies are given with respect to the gas phase. For additional information we refer to ESI.† | ||
3. Results and discussion
The results to be presented enable us to address the relative importance of the hydrogen activated CO versus the path of C–O bond cleavage through direct CO activation and the validity of the different mechanistic proposals of the formation of oxygenated higher hydrocarbons.We will analyze in Section 3.1 oxygenate formation according to the carbide mechanism and in Section 3.2 oxygenate and olefin formation according to the CO insertion chain growth mechanism.
The issue of hydrogen activated C–O bond cleavage23–27 is especially relevant to the carbide mechanism of the Fischer–Tropsch reaction and will be discussed in Section 3.1.1. In the carbide chain growth mechanism chain growth proceeds by intermediate formation of “CH” that we identified previously as the monomer species inserted into the growing hydrocarbon chain.13
As we have reviewed elsewhere12,28 Fischer–Tropsch catalysis using transition metals such as Ru29 or Co,30,31 or oxygenate production on Rh32,33 is strongly particle size dependent. The CO consumption rate and chain growth parameter α steeply decrease when transition metal particle sizes decrease below a few nanometers. This can be ascribed to the requirement of step-edge type sites, which are not present on the small particles.61
The step-edge sites provide low barriers for CO activation, reduce the rate of methane formation and chain growth termination.
In the simulations to be presented CO activation barriers as well as hydrogenation barriers of CHx formation have been varied to simulate changes in surface structure of the catalysts and to provide a prediction of optimum site structure. The choice of metal tunes such effects. Activation barriers for C–O bond cleavage will be higher on Co or Rh than Ru,34 whereas the M–C bond strengths tend to be stronger on Ru than Rh or Co34 and hence the relative chain growth termination and methanation elementary rate constants. On the same surface site the activation energy of C–O bond activation on Rh is lower than that of Co, which makes Rh a more attractive catalyst material for oxygenate formation.35
Microkinetics simulations are indispensable because of the sometimes counteracting effects of reaction parameter changes when site structure or composition changes.
3.1 Oxygenate formation according to the carbide chain growth mechanism
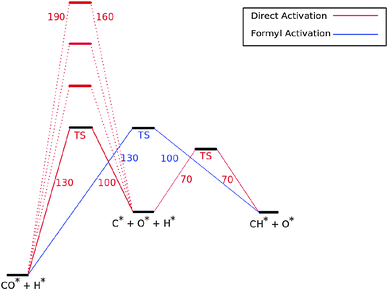
Fig. 7 shows the reaction energy diagram of the kinetic model constructed which includes both the direct and the hydrogen assisted paths of CO dissociation. The reaction schemes of direct CO dissociation and hydrogen activated C–O bond cleavage are based on calculations of Ru.26,27,38,39 In the simulations to be presented the activation energy of direct CO activation will be varied with respect to that of the hydrogen activated case.
Earlier we argued26 that in contrast to direct CO activation, the C–O bond cleavage path through intermediate CHO formation is relatively surface structure independent. On the dense Ru(0001) surface the corresponding low barrier of CH formation will make this route the preferred one,27 but on reactive step-edge sites direct CO activation will become the preferred elementary reaction.
When there is direct CO dissociation, the CHads surface species is formed in two steps: CO dissociation to give Cads and Oads and the subsequent hydrogenation of C to give CHads (red lines in Fig. 7). In the hydrogen activated CO dissociation path CHads is the direct product. Transformation of COads to CHads takes place through intermediate formyl formation and subsequent C![[double bond, length as m-dash]](https://www.rsc.org/images/entities/char_e001.gif) O bond cleavage. In Fig. 7 and the simulations the two relevant transition states and relative energy of the formyl intermediate have been taken together into a single transition state.
O bond cleavage. In Fig. 7 and the simulations the two relevant transition states and relative energy of the formyl intermediate have been taken together into a single transition state.
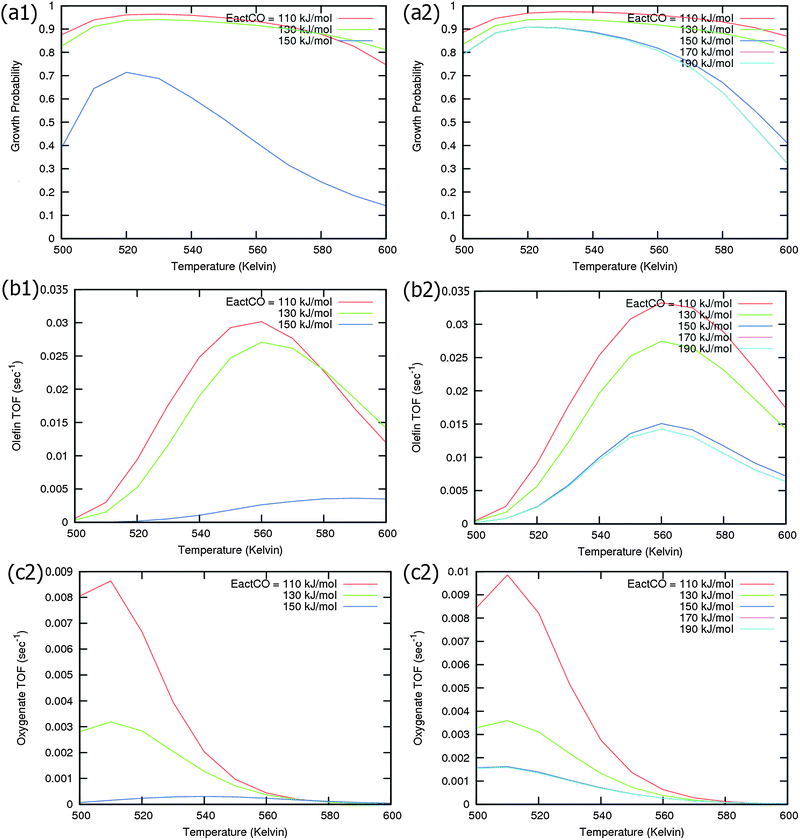
Calculated chain growth probability α and Turnover Frequencies (TOFs) for olefin and oxygenate yield are compared in Fig. 8 for the two models when CO activation only goes through direct dissociation (Fig. 8(a1), (b1), and (c1)) and when the formyl path of CO activation is included in the simulation (Fig. 8(a2), (b2), and (c2)). The activation barrier for direct CO dissociation is varied within a range from 110 kJ mol−1 to 170 kJ mol−1 while keeping the formyl path barrier constant at 130 kJ mol−1. The thermodynamics between these two competing pathways is the same and is endothermic by 30 kJ mol−1.
Fig. 8a and b compare simulated chain growth parameters α, rates of C2+ olefin and the rate of C2+ oxygenate formation as a function of temperature. The rates of product formation are normalized per unit “C” consumed.
In Fig. 8a we observe a steep decrease in α and C2+ yield when the activation energy of direct CO activation exceeds 130 kJ mol−1, whereas in Fig. 8b this decrease is absent since hydrogen activated C–O bond cleavage is included, which remains fixed at the overall activation energy of 130 kJ mol−1.
At the lower activation energies, representative of CO activation on step-edge sites, we observe a high chain growth as well as a high CO consumption rate. At the higher activation energies of CO it starts to compete with hydrogen activated CO dissociation, which then becomes dominating. Then with our chosen parameters chain growth parameter α initially remains relatively high, but decreases steeply with temperature when total C2+ yield becomes maximum.
Initially at low temperature the selectivity towards oxygenate formation exceeds that of hydrocarbon formation, but this selectivity rapidly declines with temperature. The latter is due to the high activation barrier of CO insertion compared to the activation energy of alkene chain growth termination.
The dominating production of oxygenates at low temperature, and decrease of oxygenate selectivity with temperature is in agreement with experimental observations on nanoparticles of Ru.40
Of interest also is the agreement between these experimental results and the anomalous initial increase in chain growth parameter α with temperature. Whereas usually chain growth parameter α decreases with temperature we observe in the simulations that it increases with temperature, when low temperature oxygenate formation is also included.
This maximum in the α value as a function of temperature is due to the need to dissociate the C–O bond to form the “CH” intermediate that is to be inserted into the growing hydrocarbon chain. This unique behavior of chain growth parameter α is nicely illustrated by consideration of the course grained kinetics expressions for α that one deduces for the case of only oxygenate formation (eqn (5)) versus that for alkene formation (eqn (4)). They follow from the general lumped kinetics expression for α:9
 | (1) |
 | (2) |
 | (3) |
 | (4a) |
 | (4b) |
 | (5a) |
 | (5b) |
The low initial value of α at low temperature may arise when surface vacancies have to be created for CO dissociation. However, when the activation energy of the termination reactions is high, this will dominate the temperature dependence and α shows regular behaviour and decreases with temperature. The mathematical condition for the occurrence of a maximum in α with temperature is given by:
| ECOact + ECOads > 2Et − En,n−1 (θCO ≈ 1) | (6) |
The sum of activation energy of CO dissociation and adsorption energy of CO (ECOads), that defines the apparent activation energy of a CO covered surface, has to be relatively large and the activation energy of the termination reactions should not be too high.
As can be readily verified from the parameter choices presented in Section 2, eqn (6) will be usually satisfied. The anomalous temperature dependence of α can be expected at low temperatures when the selectivity towards oxygenate formation dominates. The selectivity of oxygenate formation decreases with temperature since the apparent activation energy of kOt strongly increases with decreasing θCO so that the rate constant of oxygenate formation is overtaken by the rate constant of olefin termination. The physical reason for the appearance of the temperature maximum in α is that at low temperature the surface is blocked by the high coverage with adsorbed CO. Once surface vacancies arise due to CO desorption, CO dissociation occurs and chain growth begins. As is especially seen in Fig. 8(a1) the maximum becomes more pronounced when the activation energy for CO dissociation increases.
Because of the very small additional effect on reaction yield of the inclusion of hydrogen activated C–O bond cleavage we take in the simulations that follow only the direct CO dissociation path into account and use a default value of 130 kJ mol−1. This activation barrier of CO activation is representative of the activation barrier of CO on stepped Co or Ru surfaces of intermediate reactivity,9 with not too high activation barrier of CO so that oxygenate formation will occur.
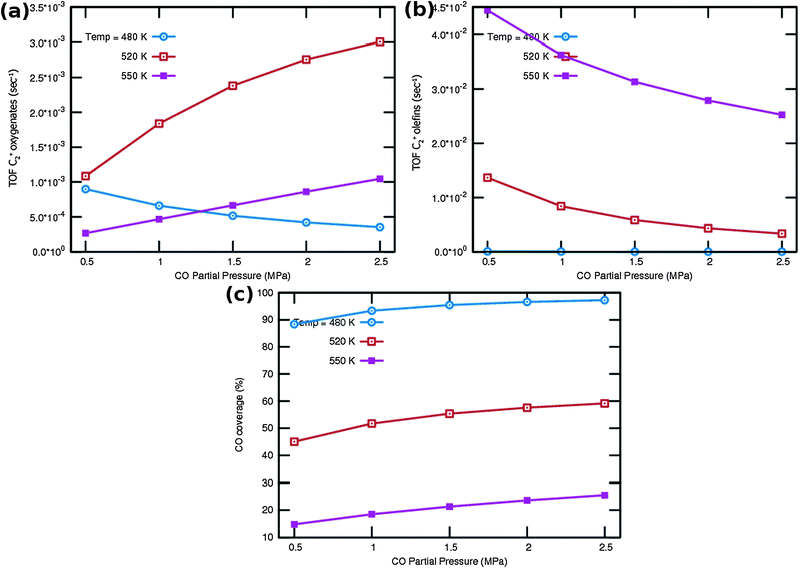
One notes again the very different dependence of oxygenate and hydrocarbon yields as a function of temperature and in addition a very different CO partial pressure dependence. Fig. 9a indicates that at very low temperature oxygenate yield is low and decreases with increasing partial pressure of CO. This is because CO dissociation is inhibited by the increased CO pressure. However at the higher temperatures the oxygenate yield increases and shows a maximum at the lower of the additional temperatures used. At the higher temperature hydrocarbon formation takes over. At these temperatures the C2+ yield of oxygenates has a positive order in CO pressure. The CO coverages have substantially decreased (see Fig. 9c), the positive order in partial pressure of CO arises to maintain a finite rate of the CO insertion termination reaction. At the temperatures selected in Fig. 9b one observes a uniform increase in C2+ yield of hydrocarbons and the expected decrease in C2+ yield as a function of CO partial pressure for olefin formation.
One notes from the surface coverages shown in Table 1 that adsorbed CO is replaced by adsorbed “C2” intermediates when the temperature increases. The increasing rate of CO consumption with temperature reduces the surface coverage with CO. The temperature maxima in yields of oxygenate formation correspond to a CO surface coverage of approximately 0.5.
| Temp. (K) | CO | C | CH2 | CHCH | Vacancies | Others |
|---|---|---|---|---|---|---|
| p CO = 0.5 Mpa | ||||||
| 480 | 0.8839 | 0.0025 | 0.0249 | 0.0786 | 0.0053 | 0.0048 |
| 520 | 0.4502 | 0.0466 | 0.0551 | 0.3925 | 0.0359 | 0.0197 |
| 550 | 0.1478 | 0.1602 | 0.0464 | 0.5515 | 0.0652 | 0.0289 |
| p CO = 1.5 Mpa | ||||||
| 480 | 0.9546 | 0.0009 | 0.0094 | 0.0313 | 0.0019 | 0.0019 |
| 520 | 0.5533 | 0.0285 | 0.0337 | 0.3591 | 0.0147 | 0.0107 |
| 550 | 0.2131 | 0.1148 | 0.0332 | 0.5886 | 0.0314 | 0.0189 |
| p CO = 1.5 Mpa | ||||||
| 480 | 0.9726 | 0.0006 | 0.0057 | 0.0188 | 0.0012 | 0.0011 |
| 520 | 0.5916 | 0.0223 | 0.0264 | 0.3423 | 0.0094 | 0.008 |
| 550 | 0.2552 | 0.0968 | 0.028 | 0.582 | 0.0225 | 0.0155 |
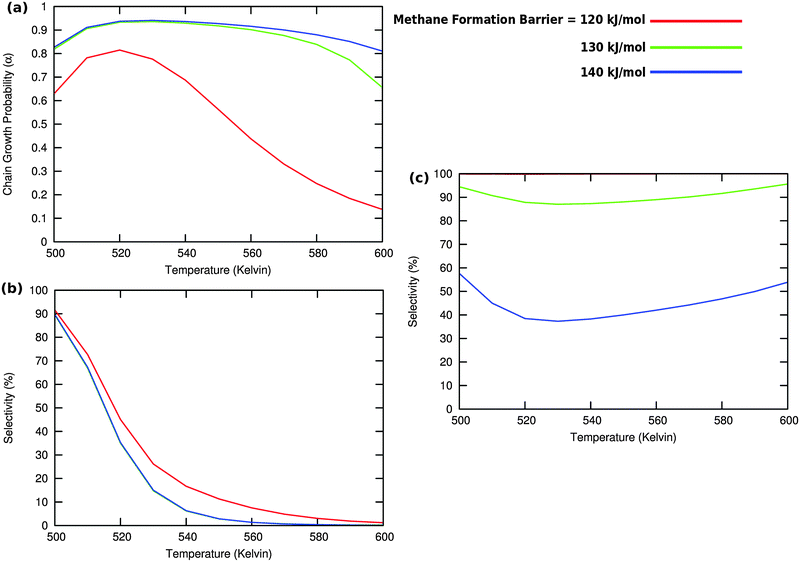
Fig. 10 illustrates competition between methane selectivity and selectivity of oxygenate formation. The relative rate of methane formation is altered by changing the activation energies of the transformation of “CHads” to “CH2,ads”. This would correspond to a relative increase in the M–C bond energy for instance by an increase of surface metal atom coordinative unsaturation. The selectivity of oxygenate formation increases with increased methane selectivity. This is because chain growth through “CHads” insertion competes with termination through CO insertion. As a consequence chain growth parameter α decreases as can be observed from Fig. 10a.
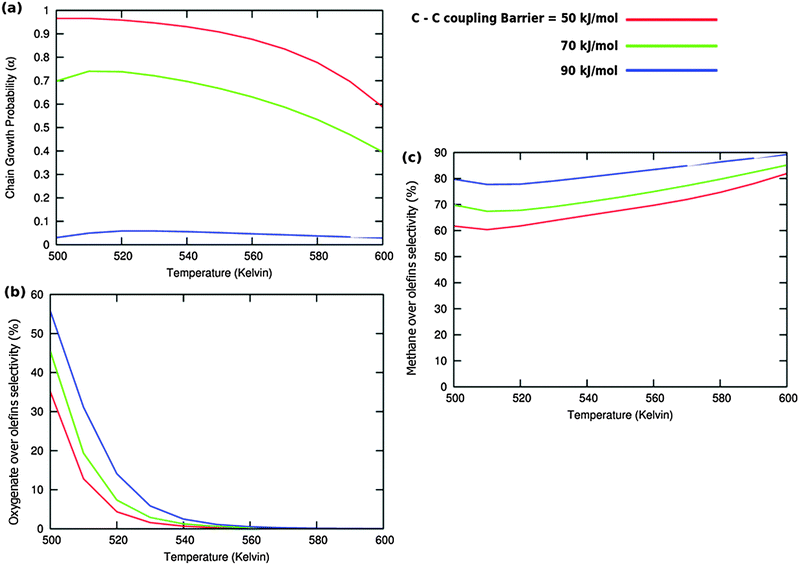
A related effect is illustrated in Fig. 11. Now the activation barrier of the chain growth rate constant is varied. As in the previous case the selectivity of oxygenate formation is negatively affected when the chain growth rate constant is increased.
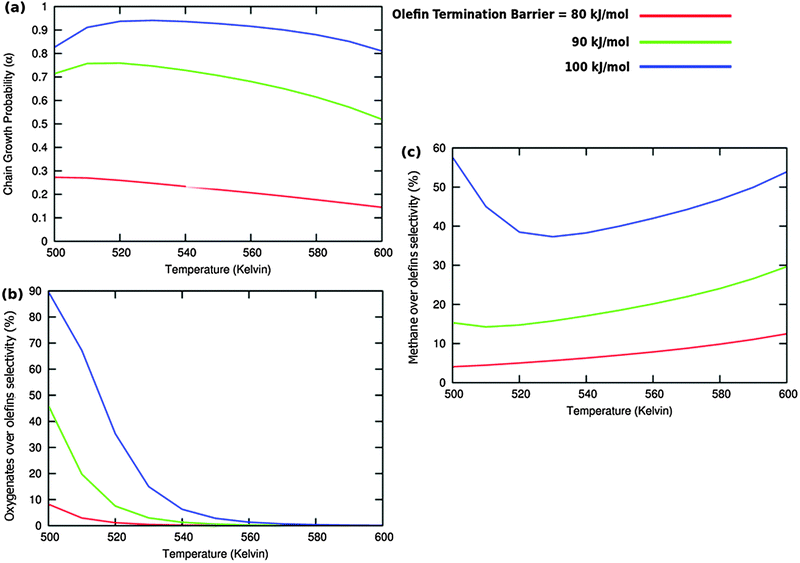
The selectivity of oxygenate formation is of course negatively affected when the olefin termination rate is increased (Fig. 12c). An increase of the rate constant of olefin termination will decrease α (Fig. 12a) and thus the selectivity of oxygenate formation. As a consequence the selectivity of methane formation (Fig. 12c) will increase.
Table 2 shows that the surface coverages are hardly affected by variation of the hydrocarbon termination rate. This is expected as long as there is no change in the rate controlling step, the interconversion of CO to surface “CH” species.
| Olefin term. barrier (kJ mol−1) | CO | C | CH2 | CHCH | Vacancies | Others |
|---|---|---|---|---|---|---|
| Temp. = 480 K | ||||||
| 80 | 0.8876 | 0.0025 | 0.0244 | 0.0755 | 0.0053 | 0.0047 |
| 90 | 0.8696 | 0.0027 | 0.0266 | 0.0911 | 0.0052 | 0.0048 |
| 100 | 0.8681 | 0.0027 | 0.0267 | 0.0924 | 0.0052 | 0.0049 |
| Temp. = 520 K | ||||||
| 80 | 0.4095 | 0.0469 | 0.0554 | 0.4365 | 0.0327 | 0.019 |
| 90 | 0.4074 | 0.0469 | 0.0554 | 0.4387 | 0.0325 | 0.0191 |
| 100 | 0.5403 | 0.0445 | 0.0526 | 0.2986 | 0.0431 | 0.0209 |
| Temp. = 550 K | ||||||
| 80 | 0.1385 | 0.1576 | 0.0456 | 0.5692 | 0.0611 | 0.028 |
| 90 | 0.1188 | 0.1508 | 0.0437 | 0.6081 | 0.0524 | 0.0262 |
| 100 | 0.1749 | 0.1663 | 0.0481 | 0.5023 | 0.0772 | 0.0312 |
According to quantum-chemical calculations21 the activation energy of CO insertion in the growing hydrocarbon chain is of the order of 50 kJ mol−1 and the overall activation energy to form the aldehyde is 90 kJ mol−1. The overall reaction of the CO insertion reaction is endothermic by 60 J mol−1. The CO insertion reaction competes with the chain growth reaction by insertion of a “CH” monomer into the growing hydrocarbon chain. The activation barrier for this reaction is of the order of 50–70 kJ mol−1.
We have used activation energies of CO insertion into the growing hydrocarbon chain and formation of final products by successive hydrogen addition steps representative of values as found in the literature from quantum-chemical calculations typical for metals such as Co, Ru or Rh.21
We have varied the activation energies of some critical reaction steps in order to deduce chemical information to improve selectivity for long chain oxygenates.
When the activation energy for CO bond cleavage is low, the probability of long chain hydrocarbon formation is high. The relative rate of CO insertion is low because of its competition with CO dissociation. Hence there is an optimum in the chain growth probability versus oxygenate selectivity. The preference of Rh for oxygenate formation and also its limited yield of higher oxygenated hydrocarbons are due to its relatively increased barrier of CO dissociation with respect to Co and Ru.35 The competition between oxygenate formation selectivity and chain growth probability becomes even more apparent when we discuss the chain growth mechanism through CO insertion in the next section.
3.2 Microkinetics according to the chain growth through the CO insertion mechanism
A high probability for chain growth requires that the rate of monomer insertion into the growing hydrocarbon chain is fast compared to the rate of the chain growth termination step. In the case of the carbide mechanism this implies the “CH” species that is inserted into the growing hydrocarbon chain is not rapidly removed as methane, but is rapidly inserted into the growing hydrocarbon chain. The monomer to be inserted into the growing hydrocarbon chain within the CO insertion chain growth mechanism is CO. A “C2O” intermediate is formed by recombination of “CHx” with CO. The higher hydrocarbons result from insertion of CO into “Cn” species that are generated by C–O bond cleavage of the “CnO” intermediate. Since the “C1” intermediate is only used to initiate the growing hydrocarbon chain, differently from the carbide chain growth mechanism, in this case high chain growth probability αCO does not require relatively fast CO dissociation. Instead of expression eqn (1) for α according to the carbide mechanism, the coarse grained kinetics expression for chain growth αCO becomes eqn (7):21 | (7) |
We have previously shown21 that then available quantum-chemical data relevant to this mechanism give too slow apparent rate constants for chain growth (determined by kp and kf) compared to the rate constants of surface intermediate conversion to the product, kHt and kt′′, for the CO insertion chain growth mechanism to give high chain growth probabilities.
Recently it has been argued that the rate of chain growth within the CO insertion chain growth mechanism is underestimated in these microkinetics simulations because coverage dependent adsorbate–adsorbate interactions have been ignored.18,41 Indeed as the microkinetics simulations of the previous section indicate under the Fischer–Tropsch conditions the surface can be considered highly covered with reaction intermediates.
One can implement the consequences of such adsorbate–adsorbate interactions in microkinetics simulations by using the corresponding calculated values of the activation energies of the elementary reaction rate constants and reaction intermediates in the simulations.42 Generally one expects elementary association reactions to have reduced activation energies, but bond cleavage reactions to have increased activation energies.
We will present here microkinetics simulations based on reaction intermediate adsorption energies and rate constant activation energy values of the Saeys group18 that represent the case of a highly covered Co(0001) surface. Their data have been used to construct the two micro-mechanistic models of the CO insertion chain growth model shown in Fig. 4a and b. Since in the two respective cases the carbonaceous intermediates that are generated have very different relative stabilities the corresponding reaction energy diagrams are quite different.
Results of the microkinetics simulations for the CO insertion chain growth reaction with high coverage are shown in Fig. 13.
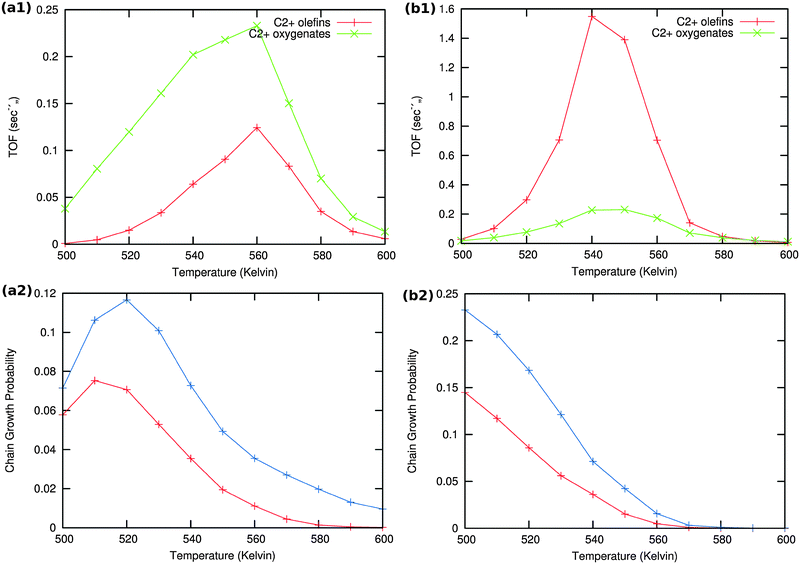 | ||
| Fig. 13 Microkinetics results of the two mechanistic schemes depicted in Fig. 4a and b. Total TOFs and individual product yields are shown. Figures to the left (a1) & (a2) correspond to scheme in Fig. 4a and figures to the right (b1) & (b2) correspond to scheme 4b. In figure (a2) the red curve shows the chain growth probability (α) with the default rate constants given in Table S2 (ESI†), and blue curves show the chain growth probability (α) with a decreased rate constant of olefin desorption obtained by lowering the respective pre exponential values from 1016 to 1012. In figure (b2) the red curve shows the chain growth probability (α) with the default rate constants given in Table S2 (ESI†), and blue curves show the chain growth probability (α) with a decreased rate constant of olefin desorption obtained by increasing the respective activation barriers from 70 kJ mol−1 to 100 kJ mol−1. | ||
Clearly no long chain hydrocarbons are formed, but C2 formation is possible. In case (a) also a substantial amount of oxygenate is found. The results are consistent with many quantum-chemical results22,43–47 that indicate that C1 and CO recombination can occur with relatively low activation barriers.
This recombination is essentially different from subsequent insertions of CO in the adsorbed longer hydrocarbon chains that have higher activation energies.
Selective C2 formation without methane formation is a technologically important reaction.48
Next to the apparent activation energies of the overall C–C bond formation reaction, the other parameter that determines chain growth probability is the rate constant kHt of the “Cn” intermediate termination that produces the olefin product.
In order to test the sensitivity of the results in Fig. 13(a2) and (b2) we have compared values of the chain growth probabilities for decreased values of the rate of desorption of the olefins. In case (a) the pre-exponential value of the olefin desorption rate has been decreased from 1016 to 1012, in case (b) the activation barrier of olefin desorption rate has been increased from 70 kJ mol−1 to 100 kJ mol−1.
As can be observed in the corresponding Fig. 13 the chain growth probabilities in both cases are slightly increased, but remain low. This confirms the conclusion that the CO insertion chain growth path mechanism will not lead to long chain hydrocarbon products.
The microkinetics results of this section and previous sections reveal that one has to be careful when concluding the validity of the CO insertion mechanism for chain growth based on arguments that relate to a relation between surface concentration and transient kinetics as recently done by Kruse et al.49 It can be clearly seen also from the simulations presented in Section 3.1, that a high surface concentration of CO can be consistent with the carbide mechanism and is no proof of the CO insertion chain growth mechanism. This is consistent with the elegant demonstration by in situ PM-RAIRS experiments by Beitel et al.50,51 that CO adsorbed to step edges is consumed during Fischer–Tropsch reaction, which illustrates that it is replaced by different species. We observe from our simulations that within the carbide mechanism CO is replaced by growing adsorbed hydrocarbons. Previously published quantum-chemical calculations of the chain growth at the stepped Ru(1121) surface52 have shown that at the step-edges C atoms generated by CO dissociation upon addition of a hydrogen atom move from their four-fold adsorbed position within the step to three-fold position at the step-edge, which is also the site of the chain growth reaction. The movement of the C atom away from the internal part of the step to its edge prevents deactivation of the step site.
We have reviewed elsewhere13 the very elegant early isotope labeling experiments by Biloen and Sachtler10 and the work of Brady and Pettit53,54 and of Maitlis,55,56 which provide strong experimental support for the carbide chain growth reaction path.
4. Conclusion: comparison of theory and experiment
In this section we will discuss the critical rate parameter relations that determine the selectivity of long chain oxygenate formation and we will relate this with available experimental results. For a comparison with experimental results we will mainly base ourselves on material reviewed in papers.4,5Direct comparison of the microkinetics simulations as presented here with experimental data of practical catalysts with often complex composition will have to remain speculative. We will therefore limit the discussion to a general comparison of trends in catalyst performance data with the microkinetics simulations results. Since we will mainly compare with experiments that concern alcohol production, we will consider the alcohols to be rapidly formed by consecutive hydrogenation once the aldehyde is produced as the primary product.
Most of the experimental Fischer–Tropsch catalyst studies on oxygenate formation are based on Rh, Fe (carbide), Co, MoC2 or MoS2. When not modified by added promoting components such as alkali metals or additional transition metals, these materials produce only alkanes or alkenes except when Rh and Fe catalyst materials are used. We earlier referred to nanoparticle Ru catalysts40 that also produce long chain oxygenates, but only in a very low temperature regime where syngas conversion has a low turnover frequency.
Promotion substantially increases the oxygenate production of most of the catalysts, but oxygenate versus hydrocarbon selectivity rarely exceeds 50% (the catalysts of highest selectivity are Rh/ZrO2 or Rh/TiO2) and is usually substantially less. Interesting with respect to the microkinetics simulation results of Section 3.2 is that C1 and C2 oxygenate production is usually far in excess of that of C3+ oxygenates, except for MoC2 or MoS2 based systems, where it may become comparable. Clearly there is a significant scope for improvement.
According to the microkinetics simulations the relatively high overall barrier for C–C bond formation by the CO insertion chain growth mechanism makes this reaction route unsuitable for long hydrocarbon formation. One has to note however that the mechanism of C2H4O formation is similar to that in the carbide chain growth route.
Within the carbide mechanism the relatively low activation energy of the rate of chain growth and relatively high activation energy for CO insertion into the adsorbed growing hydrocarbon chain are consistent with the possibility of long chain oxygenate formation.
Long chain oxygenate product formation competes with the following reactions:
(a) methane (methanol) formation
(b) recombination of “CHx” with another “CHx” that produces ethylene or “CnHy” with another “CHx” (n > 1) that produces alkene. These recombination steps are to be compared with reaction of COads with “CHx” or “CnHy”
(c) decomposition of “CHxCO” or “CnHyCO” into “CHxC” or “CnHyC” and “Oads”.
Ad (a)
The rate of methane formation depends on the relative rate of C–O bond cleavage to give “CHx” versus the rate of “CHx” hydrogenation to methane. Within the carbide mechanism methane formation from “CHx”, the building unit of the chain growth reaction, competes with the rate of incorporation of “CHx” into the adsorbed growing hydrocarbon chain.We have studied in Section 3.1.1 the sensitivity of catalyst performance with respect to the activation barrier for C–O bond activation. As long as the CO activation barrier is low, as is the case on stepped reactive surfaces, the chain growth probability does not depend on the activation energy of C–O bond cleavage. The rate of CO consumption as well as chain growth probability is then controlled by the rate constant of chain growth termination.12 This we have called preciously the Fischer–Tropsch chain growth kinetics limit case. Then the reactive catalyst center becomes covered with mainly hydrocarbon intermediates.
When the activation energy of C–O bond activation increases, for instance when a more reactive metal such as Ru is replaced by Co or a less reactive surface is chosen with different step-edges, the CO consumption rate and chain growth probability can become limited by the rate of “CHx” production. Then the rate of CO consumption becomes controlled by the elementary rate constant of C–O bond cleavage. This kinetics limit we have previously identified as the monomer formation kinetics limit.12 It is in this kinetics regime that most Fischer–Tropsch catalysts operate.13
When the activation energy of CO activation increases further, the route towards C–O bond cleavage starts to compete with that of the hydrogen activated bond cleavage reaction. This is typically the situation for CO activation on the dense surfaces of Co, Rh or Ru or metal surfaces of low reactivity as for Ni.26 Recently Salmeron et al.57 have demonstrated hydrogen activated C–O bond cleavage on nanoparticles of Co.
Clearly direct CO activation to give “CHx” as well as hydrogen activated C–O bond cleavage contain hydrogen atom addition as an important step, so that kinetically the difference between the two is not essential but the apparent activation energy to produce CHx. We have found that on the reactive Rh(211) surface58 both reaction paths have the same apparent activation energies.
To produce oxygenate the rate of CO bond cleavage has to be reduced. C–O bond cleavage and CO insertion into “CHx” or longer adsorbed hydrocarbon fragments are competing reactions and will also compete with methanol formation.
Ad (b)
To produce long chain oxygenates we find that the overall activation barrier of C–O bond cleavage of the CO to “CHx” transformation reaction should not be too low, since otherwise competition with CO insertion into the growing hydrocarbon chain becomes too unfavourable. On the other hand the activation energy of CO activation should not be too high, otherwise no “CHx” species will be generated to be inserted into the growing hydrocarbon chain. Then “CHx” will be mainly converted into methane. In the extreme case of a very high activation energy of CO activation methanol will be formed, as for instance on the Cu methanol catalyst.59On Ni the rate of CO activation is too low,60 which makes it the preferred catalyst for methane formation. In order to compete with methane formation the upper bound to the activation energy of C–O bond cleavage has to be between 90 and 120 kJ mol−1, dependent on the reactivity of the metal surface to hydrogenate surface “CHx” intermediates to methane. On dense surfaces that have a low M–C interaction energy the lower value applies, on the more open reactive surfaces the higher value.
The lower bound for the activation barrier of C–O bond cleavage due to competition with the activation energy of CO insertion into the growing hydrocarbon chain to give the aldehyde is of the order of 90 kJ mol−1. It is consistent with a high chain growth probability because within the carbide mechanism the apparent activation energies for C–C bond formation are in the regime between 50 and 70 kJ mol−1.
The lower bound to the activation energy of C–O bond activation implies that the reactive stepped Ru surfaces are no suitable catalysts for oxygenate formation. This conclusion agrees with experiment40 that indicates that only small nanoparticles, which may be expected to have a low concentration of step-edge sites,61 show high long chain oxygenate selectivity at low temperature, but with a very low CO consumption rate. Because of the increased CO activation barrier at a higher temperature less reactive Rh shows a higher oxygenate formation selectivity. A high selectivity can be maintained with acceptable turnover frequencies, however at a cost of longer chain oxygenates.
Alloys that combine a metal that binds CO strongly but does not activate C–O bond cleavage, such as Ir, with a metal that dissociates CO with an activation energy, such as Co have been demonstrated to show significant selectivity towards formation of C2 oxygenates, with minor coproduction of methanol.5
The additional condition that has to be satisfied in order to obtain long chain oxygenates is that termination through CO insertion is favourable compared to termination as alkene.
The quantum-chemistry of CO insertion has been studied extensively within the context of hydroformulation.62 The availability of empty d-valence electron states of surface metals atoms of low energy that reduce repulsive interaction between the lone pair electrons of CO and the occupied C atoms of the reacting adsorbed hydrocarbon intermediate by electron donation to the metal atoms reduces the CO insertion barrier. Also Lewis acid activation of CO63 lowers the activation energy of C–O bond cleavage. Possibly for these reasons addition of reducible metal oxide catalysts as vanadium or Mn oxides to Rh shows significantly enhanced yields of oxygenate formation.63
From scaling law arguments64 it is known that the activation energies for hydrogen transfer reaction increase with an increase of the surface metal M–C bond energy. Since the intermediate to be hydrogenated to the olefin is an alkenyl or alkylidyne intermediate, to which a hydrogen atom has to be added13 a stronger M–C bond will reduce the rate of hydrocarbon formation since the rate constant of chain growth termination will be decreased.
A larger M–C bond interaction will not only decrease the rate constant of methane formation, but also decrease the rate of C–C bond formation compared to that of CO insertion. This is possibly the reason that promoted MoC2 or MoS2 based catalysts have been reported5 to produce the highest fraction of linear C3+ oxygenates.
Ad (c)
Rh catalysts have been experimentally4,5 as well computationally21 most extensively investigated with respect to oxygenate formation. We have shown in Section 3.2 that according to the data of Saeys et al.18 on Co, CO insertion into adsorbed CH proceeds with a relatively low barrier and that because of the ease of cleavage of the C–O bond the main reaction product according to this reaction path is ethylene. Computational quantum-chemical data of comparable elementary reaction steps for C2 oxygenate formation on different surfaces of Rh22 summarized in ref. 20 and Ru surfaces13 are also available. They indicate that the recombination reaction of COads and “CHads” will readily occur on Rh, but show a higher activation energy barrier on Ru.13 On Rh activation of the C–O bond of inserted CO has a substantially higher barrier than on Ru. Whereas the relative rate of methane formation from adsorbed “CHx” is faster on Rh than Ru (the M–C bond is stronger on the latter), Rh CO insertion into CHx will more favourably compete with “CHx” recombination and the rate of bond cleavage of C![[double bond, length as m-dash]](https://www.rsc.org/images/entities/char_e001.gif) O will be suppressed.37
O will be suppressed.37
Since of the three metals considered more reactive Ru has the stronger M–C bond the observation of low temperature long chain oxygenate formation is consistent with the theoretical considerations. At higher temperatures Rh should be the better catalyst for shorter chain oxygenates.
Takeuchi et al.32 found that highly dispersed Co catalysts that are Sr promoted show enhanced production of C2 oxygenates compared to prediction according to the ASF product distribution plot. But for hydrocarbon formation ethylene production is suppressed. It is suggested by Spivey et al.4 that this demonstrates preferred CO insertion into “CHx”. The recent observation by Galvis et al.48 that at high temperature nanosized carbided Fe particles promoted by S and alkali are selective ethylene and propylene catalysts suggests that they are also produced through recombination of a “CHads” and COads species. More reactive Fe compared to Co now rapidly catalyses C–O bond cleavage after the CO insertion reaction.
To conclude we will address the question whether significant improvements of the production of linear long chain oxygenates by further adaptation of Fischer–Tropsch catalysis may be expected.
The low temperature nanoparticle Ru catalyzed reaction21 illustrates that a high chain growth oxygenate probability is possible. But the CO consumption rate is too low to be of practical interest.
Important at the low temperature are the low relative overall rate constants of methane formation and CO insertion versus the overall rate constant of chain growth through CHx insertion.
A strong M–C bond will be beneficial since it will suppress methane formation, except that it will slow down C–C bond formation, which becomes endothermic when the M–C bond becomes too strong.20
The increased M–C bond energy will also lower the activation energy of C–O bond activation. Oxygenate formation is maximum when the rate constant of C–O bond activation of CO is approximately equal to the rate constant of the oxygenate termination reaction.21
Whereas this will be beneficial to the chain growth reaction it will decrease the oxygenate yield. The choice of a reaction center that is less electronegative will be beneficial, since a decrease of the M–O bond energy will decrease the elementary rate constants of CO activation and favour oxygenate formation.
As shown by Arakawa et al.33,65 a small metal particle size will enhance the probability of oxygenate formation. On a small metal particle CO dissociation will have a low rate, but also the rate constant of chain growth, so primarily C2 oxygenates can be expected.
The resulting conflicting dependencies on surface reactivity imply an optimum in oxygenate selectivity and the CO consumption rate, which not necessarily has to coincide. This is confirmed by experiments with promoted Rh catalysts,4 that give maximum oxygenate yield for the vanadium promoted catalyst, but maximum selectivity of the TiO2 promoted catalyst.
A computational study by Jenness et al.66 indicates that reducible oxides promote a small charge deficit on the small Rh particles that enhances the M–C interaction energy and reduces the interaction with oxygen. This appears to agree with experimental data on vanadium promoted Rh catalysts67,68 that show decreased methane formation due to an increased M–C interaction.
The complex catalyst formulations developed so far lack optimum catalyst performance, due to excess hydrocarbon formation. Whereas further improvement of long chain oxygenate formation through Fischer–Tropsch type catalysis is unlikely, improvements in selectivity and yield of C2 oxygenates should be possible.
References
- R. B. Anderson, H. Kölbel and M. Rálek, The Fischer–Tropsch Synthesis, Academic Press, 1984 Search PubMed.
- Fischer–Tropsch Technology, ed. A. P. Steynberg and M. E. Dry, Elsevier, Amsterdam, 2004 Search PubMed.
- H. H. Storch, N. Golumbic and R. B. Anderson, The Fischer–Tropsch and Related Syntheses, Wiley, New York, 1951 Search PubMed.
- A. Egbebia and J. J. Spivey, Chem. Soc. Rev., 2007, 36, 1514–1528 RSC.
- S. K. Gangwal and V. Subramani, J. Phys. Chem., 1986, 90, 4752–4758 CrossRef.
- E. B. M. Doesburg, X. Xiaoding and J. J. F. Scholten, Catal. Today, 1987, 2, 125–170 CrossRef.
- T. Fukushima, M. Ichikawa, T. Yokohama, N. Kosugi and H. Kurodan, J. Phys. Chem., 1986, 90, 1222–1224 CrossRef.
- V. Ponec, Studies in Surface Science and Catalysis, 1991, p. 64 Search PubMed.
- I. M. Ciobîcă, R. A. van Santen, E. van Steen and M. M. Ghouri, in Advances in Catalysis, ed. H. Knozinger, B. C. Gates, Academic Press, 2011, vol. 54, pp. 127–187 Search PubMed.
- P. Biloen and W. M. H. Sachtler, Adv. Catal., 1981, 30, 165–216 CAS.
- H. Pichler and H. Schulz, Chem. Ing. Tech., 1970, 42, 1162–1174 CrossRef CAS.
- R. A. van Santen, A. J. Markvoort, M. M. Ghouri, P. A. J. Hilbers and E. J. M. Hensen, J. Phys. Chem. C, 2013, 117, 4488–4504 CAS.
- R. A. van Santen, A. Markvoort, I. A. W. Filot, M. M. Ghouri and E. J. M. Hensen, Phys. Chem. Chem. Phys., 2013, 15, 17038–17063 RSC.
- H. Schulz, in Catalysis: From Principles to Applications, ed. M. Beller, A. Renken and R. A. van Santen, Wiley-VCH, Weinheim, 2012 Search PubMed.
- S. Storsaeter, D. Chen and A. Holmen, Surf. Sci., 2006, 600, 2051–2063 CrossRef CAS PubMed.
- H. Kölbel, R. B. Anderson and M. Rálek, The Fischer–Tropsch Synthesis, Academic Press, 1984 Search PubMed.
- P. Hu, J. Cheng, P. Ellis, S. French, G. Kelly and C. M. Lok, J. Phys. Chem. C, 2008, 112, 1308–1311 Search PubMed.
- M. Zhuo, A. Borgna and M. Saeys, J. Catal., 2013, 297, 217–226 CrossRef CAS PubMed.
- I. M. Ciobîcă, G. J. Kramer, Q. Ge, M. Neurock and R. A. van Santen, J. Catal., 2002, 212, 136–144 CrossRef.
- A. J. Markvoort, R. A. Van Santen, P. A. J. Hilbers and E. J. M. Hensen, Angew. Chem., Int. Ed., 2012, 51, 9015–9019 CrossRef CAS PubMed.
- R. A. van Santen and A. Markvoort, ChemCatChem, 2013, 5, 3384–3397 CrossRef CAS.
- N. Kapur, J. Hyun, B. Shan, J. B. Nicholas and K. Cho, J. Phys. Chem. C, 2010, 114, 10171–10182 CAS.
- O. R. Inderwildi, S. J. Jenkins and D. A. King, J. Phys. Chem. C, 2008, 112, 1305–1307 CAS.
- J. W. Mirwald and O. R. Inderwildi, Phys. Chem. Chem. Phys., 2012, 14, 7028–7031 RSC.
- M. Ojeda, R. Nabar, A. U. Nilekar, A. Ishikawa, M. Mavrikakis and E. Iglesia, J. Catal., 2010, 272, 287–297 CrossRef CAS PubMed.
- S. Shetty, A. P. J. Jansen and R. A. van Santen, J. Am. Chem. Soc., 2009, 131, 12874–12875 CrossRef CAS PubMed.
- I. M. Ciobîcă and R. A. van Santen, J. Phys. Chem. B, 2003, 107, 3808–3812 CrossRef.
- R. A. van Santen, I. M. Ciobîcă, E. van Steen and M. M. Ghouri, in Advances in Catalysis, ed. B. C. Gates and H. Knozinger, Academic Press, 2011, ch. 3, vol. 54, pp. 127–187 Search PubMed.
- J. Yang, J. M. G. Carballo, A. Holmen, S. García-Rodríguez, S. Rojas, M. Odeja and J. L. G. Fierro, J. Catal., 2011, 284, 102–108 CrossRef PubMed.
- P. B. Radestake, J. P. Den Breejen, G. L. Bezemer, J. H. Bitter, V. Frøseth, A. Holmen and K. P. de Jong, J. Am. Chem. Soc., 2009, 131, 7197–7203 CrossRef PubMed.
- J. H. Bitter, G. L. Bezemer, H. P. C. E. Kuipers, H. Oosterbeek, J. E. Holewijn, X. Xu, F. Kapteijn, A. K. van Dillen and K. P. de Jong, J. Am. Chem. Soc., 2006, 128, 3956–3964 CrossRef PubMed.
- K. Takeuchi, H. Arakawa, T. Matsuzaki and Y. Sugi, Chem. Lett., 1984, 13, 1607 Search PubMed.
- H. Arakawa, T. Hanaoka, T. Matsuzaki, Y. Sugi, K. Kanno and Y. Abe, Catal. Today, 2000, 58, 271–280 CrossRef.
- M. Neurock and R. A. van Santen, Molecular Heterogenous Catalysis, Wiley-VCH, 2006 Search PubMed.
- Z.-P. Liu and J. Chen, J. Am. Chem. Soc., 2008, 130, 7929–7937 CrossRef PubMed.
- C. H. Bartholomew and R. J. Farrauto, Fundamentals of Industrial Catalytic Processes, Wiley, Hoboken, New Jersey, 2nd edn, 2005 Search PubMed.
- M. C. Valero and P. Raybaud, Catal. Lett., 2013, 143, 1–17 CrossRef.
- I. M. Ciobîcă and R. A. van Santen, J. Phys. Chem. B, 2002, 106, 6200–6205 CrossRef.
- I. M. Ciobîcă, F. Frechard, R. A. van Santen, A. W. Kleyn and J. Hafner, Chem. Phys. Lett., 1999, 311, 185–192 CrossRef.
- Y. Guan, X. Y. Quek, R. A. van Santen and E. J. M. Hensen, ChemCatChem, 2011, 3, 1735–1738 CrossRef.
- B. T. Loveless, C. Buda, M. Neurock and E. Iglesia, J. Am. Chem. Soc., 2013, 135, 6107–6121 CrossRef CAS PubMed.
- J. W. Niemantsverdriet and R. A. van Santen, Chemical Kinetics and Catalysis, Plenum Press, 1995 Search PubMed.
- J. Cheng, X.-Q. Gong, P. Hu, C. M. Lok, P. Ellis and S. French, J. Catal., 2008, 254, 285–295 CrossRef CAS PubMed.
- Y. Choi and P. Liu, J. Am. Chem. Soc., 2009, 131, 13054–13061 CrossRef CAS PubMed.
- Y.-H. Zhao, K. Sun, X. Ma, J. Liu, D. Sun, H.-Y. Su and W.-X. Li, Angew. Chem., Int. Ed., 2011, 50, 5335–5338 CrossRef CAS PubMed.
- M. Zhuo, K. F. Tan, A. Borgna and M. Saeys, J. Phys. Chem. C, 2009, 113, 8357–8365 CAS.
- D.-B. Cao, Y.-W. Li, J. Wang and H. Jiao, J. Mol. Catal. A: Chem., 2011, 346, 55–69 CrossRef CAS PubMed.
- H. M. T. Galvis, J. H. Bitter, C. B. Khare, M. Ruitenbeek, A. I. Dugulan and K. P. de Jong, Science, 2012, 335, 835–838 CrossRef PubMed.
- A. Bundhoo, J. Schweicher, A. Frennet, N. Kruse, D. Helen and F. Meunier, J. Phys. Chem. C, 2010, 114, 2248–2255 Search PubMed.
- A. Laskov, G. A. Beitel, H. Oosterbeek and E. W. Kuipers, J. Phys. Chem., 1996, 100, 12494–12502 CrossRef.
- C. P. M. de Groot, G. A. Beitel, H. Oosterbeek and J. H. Wilson, J. Phys. Chem. B, 1997, 101, 4035–4043 CrossRef.
- I. M. Ciobîcă, S. Shetty, E. J. M. Hensen and R. A. van Santen, Chem. Commun., 2011, 47, 9822–9824 RSC.
- R. Pettit and R. C. Brady III, J. Am. Chem. Soc., 1981, 103, 1287–1289 CrossRef.
- R. Pettit and R. C. Brady III, J. Am. Chem. Soc., 1981, 102, 6181–6182 Search PubMed.
- R. Quyoum, P. M. Maitlis, H. C. Long and M. L. Turner, Appl. Catal., A, 1999, 186, 363–374 CrossRef.
- P. M. Maitlis and V. Zanotti, Catal. Lett., 2007, 122, 80–83 CrossRef.
- S. Carenco, A. Tuxen, M. Chintapalli, C.-H. Chuang, C. Escudero, E. Pach, P. Jiang, F. Borondics, B. Beberwyck, A. P. Alivisatos, G. Thornton, W.-F. Pong, J. Guo, R. Perez, F. Besenbacher and M. Salmeron, J. Am. Chem. Soc., 2013, 135, 2273–2278 CrossRef PubMed.
- P. W. van Grootel, T. Zhu, I. A. W. Filot, S.-G. Sun, R. A. van Santen and E. J. M. Hensen, J. Catal., 2013, 297, 227–235 CrossRef PubMed.
- S. Lee, Methanol Synthesis Technology, CRC Press, 1989 Search PubMed.
- F. Abild-Pedersen, M. P. Andersson, I. N. Remediakis, T. Bligaard, G. Jones, J. Engbæk, O. Lytken, S. Horch, J. H. Nielsen, J. Sehested, J. R. Rostrup-Nielsen, J. K. Nørskov and I. Chorkendorff, J. Catal., 2008, 255, 6–12 CrossRef PubMed.
- A. Hellman, K. Honkala, I. N. Remediakis, A. Logadottir, A. Carlsson, S. Dahl, C. H. Christensen and J. K. Nørskov, Science, 2005, 307, 555–558 CrossRef PubMed.
- R. Hoffman and D. L. Thorn, J. Am. Chem. Soc., 1978, 100, 2079–2090 CrossRef.
- M. Ichikawa and W. M. H. Sachtler, J. Phys. Chem., 1986, 90, 4752–4758 CrossRef.
- J. Greely, F. Abild-Pedersen, F. Studt, J. Rossmeisl, T. R. Munter, P. G. Moses, E. Skúlason, T. Bligaard and J. K. Nørskov, Phys. Rev. Lett., 2007, 99, 016105 CrossRef.
- K. Takeuchi, H. Arakawa, T. Matsuzaki and Y. Sugi, Chem. Lett., 1985, 1315–1318 Search PubMed.
- J. R. Schmidt and G. R. Jenness, ACS Catal., 2013, 3, 2881–2890 CrossRef.
- R. A. van Santen and T. Koerts, Catal. Lett., 1990, 6, 49–57 CrossRef.
- R. A. van Santen and T. Koerts, J. Catal., 1992, 134, 12–23 Search PubMed.
Footnote |
| † Electronic supplementary information (ESI) available. See DOI: 10.1039/c3cp54950j |
| This journal is © the Owner Societies 2014 |

