 Open Access Article
Expanding proton-insertion coupled electron transfer into tungsten oxides to non-aqueous organic acid electrolytes
Saeed Saeed a,
Zhou Lu
 b,
Ellen M. Matson
 b and
Veronica Augustyn
 *a
*a
aDepartment of Materials Science and Engineering, NC State University, Raleigh, NC 27606, USA. E-mail: vaugust@ncsu.edu
bDepartment of Chemistry, University of Rochester, Rochester, NY 14627, USA
First published on 24th October 2025
Abstract
We investigated proton insertion-coupled electron transfer (PICET) into tungsten oxide films using non-aqueous organic acid electrolytes. Operando UV-vis-NIR spectroelectrochemistry confirms PICET, showing respective broadband and dual-band transmittance changes for WO3 and WO3·H2O in the visible and NIR regions. WO3·H2O retains facile PICET kinetics in the absence of water.
The ability of transition metal oxides (TMOs) to undergo electrochemical proton-coupled electron transfer (PCET) reactions renders them useful as electrodes for electrochemical energy storage and as electrocatalysts for electrochemical synthesis.1–3 Despite this broad application space, most studies of electrochemical PCET with TMOs have been limited to conditions where the electrolyte is a strong acid or base in water. While this can lead to facile interfacial and mass transport kinetics, it limits fundamental understanding of PCET in TMOs to conditions at the extremes of the pH scale and in water. On the other hand, investigations of PCET in polyoxometalates, considered as molecular-scale analogs of TMOs, typically utilize non-aqueous solvents and organic acids to explore electrochemical PCET reactivity with proton donors over a broad pKa range.4–6 The nature of the electrolyte proton donor is important as it influences both the thermodynamics and kinetics of the PCET reaction. Reports on electrochemical PCET into TMOs from non-aqueous electrolytes are limited but include TiO2 and VO2(B)7,8 and NiO and CeO2.9–11
Here, we investigate the electrochemical PCET reactivity of a model TMO, WO3, and its hydrated, Brønsted acid relative, WO3·H2O, in organic acids in a non-aqueous solvent. Like other early TMOs, tungsten oxides can undergo PCET reactions at the surface followed by accommodation of the protons within the oxide bulk, a process termed proton-insertion coupled electron transfer (PICET).1,12,13 Fig. 1 shows the primary steps involved during PICET with WO3.
Here, we provide the first report of electrochemical PICET into tungsten oxides in the absence of water using electrolytes containing organic acids in acetonitrile (MeCN) and compare the behavior to a more common inorganic aqueous acid electrolyte, 0.5 M H2SO4. We used cyclic voltammetry and operando UV-vis-NIR spectroelectrochemistry to study PICET into tungsten oxide thin films in non-aqueous electrolytes containing organic acids ranging in pKa from 5.07 to 19.35. We found that the redox features associated with PICET shift in a Nernstian fashion. Comparing their behavior in non-aqueous vs. aqueous acid electrolytes, WO3 shows slower PICET kinetics while those of WO3·H2O remain the same. We hypothesize that the structural water in WO3·H2O helps maintain fast interfacial PCET kinetics even in the absence of water. WO3 and WO3·H2O both show suppressed redox peaks in non-aqueous organic acid electrolytes, which we hypothesize occurs from kinetic limitations in the organic acid electrolyte. UV-vis-NIR spectroelectrochemistry shows that WO3 has a single broadband change in transmission across all visible and IR wavelengths even at low states of PICET. WO3·H2O shows dual-band behavior where low states of PICET lead to changes in the IR before activating a visible response. This study expands PICET into tungsten oxides to non-aqueous electrolytes, facilitating the electrochemical conditions available for electrochemical transformations involving PCET to and from TMO surfaces.
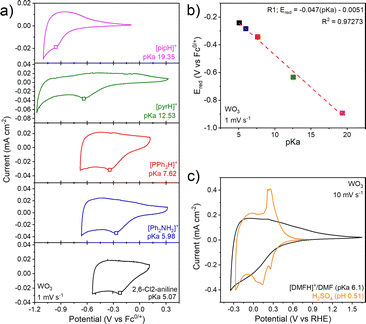
Physical characterization of the electrodeposited WO3·H2O and WO3 films is shown in Fig. S4 and S5. We performed cyclic voltammetry of the WO3 thin film electrode in non-aqueous electrolytes containing organic acids whose pKa ranged from 5.07 to 19.35 in MeCN (Fig. 2a). Such a pKa range is not accessible in aqueous electrolytes without dissolution of WO3 to WO42−. In the absence of organic acids (e.g., in 0.1 M NBu4PF6 in MeCN), WO3 shows a rectangular cyclic voltammetry response as expected for non-faradaic double layer charging (Fig. S7). The presence of organic acids leads to an order of magnitude increase in the current density and broad but notable cathodic and anodic current peaks, likely from faradaic PICET. In line with this hypothesis, the cathodic peak potential, Ered, shows near-Nernstian dependencies of 47 mV pKa−1 unit (Fig. 2b). The decrease from an ideal Nernstian process of 59 mV pKa−1 unit suggests the possibility of <1H+, 1e− transfer. Because of the poorly-resolved anodic features, this sub-Nernstian behavior may also be due to kinetically-limited PICET. This trend is opposite to aqueous electrolytes, where many TMOs exhibit super-Nernstian (>59 mV pKa−1) behavior.14 The broad nature of the anodic peak prevented us from determining its pKa dependence.
Fig. 2c shows a comparison of WO3 in an aqueous inorganic acid electrolyte (0.5 M H2SO4) and a non-aqueous electrolyte containing a weak organic acid buffer, 0.1 M [DMFH]+/DMF, both at 10 mV s−1. We observed significantly smaller and less defined currents in the organic acid vs. the inorganic acid aqueous electrolyte, especially for the anodic sweep. To verify that our current response under non-aqueous conditions was not limited by the concentration of the organic acid in solution, we cycled WO3 in a non-aqueous electrolyte containing either 20 mM or 100 mM [DMFH]+ (Fig. S8b). The CV showed a slight cathodic shift in the redox potential, perhaps due to drift of the Ag pseudoreference electrode. There were no other changes suggesting that the proton donor was in sufficient excess at these concentrations. At 10 mV s−1, WO3 inserts 0.2 H+/e− in both 0.5 M H2SO4 and 0.1 M [DMFH]+/DMF (Fig. 2c). In [DMFH]+/DMF at 2 mV s−1, WO3 can take up to ∼0.25 H+/e− per W, which decreases to ∼0.1 H+/e− at 200 mV s−1 for a capacity retention of 47% (Fig. S10a, b and Fig. S11a). In 0.5 M H2SO4, the capacity retention at 200 mV s−1 is 60%,15 indicating more limited PICET kinetics in the non-aqueous electrolyte. The comparison of charge as a function of potential in the aqueous and non-aqueous electrolytes at 10 mV s−1 is shown in Fig. S12. This comparison shows that the same amount of charge is taken up in both electrolytes, but that it occurs over a broader potential range and with larger hysteresis in the non-aqueous electrolyte. Our previous work showed that CV redox peaks in 0.5 M H2SO4 are associated with first-order solid state phase transitions.16 The lack of well-defined redox peaks in the non-aqueous electrolytes indicates that PICET occurs over a broader potential window. Interfacial water is a key contributor to fast PCET kinetics in mechanistic studies of hydrogen spillover into tungsten oxides.17,18 We thus hypothesize that the changes in CV features in organic acid non-aqueous electrolytes vs. inorganic aqueous electrolytes for WO3 originate from the absence of water to promote PCET at its interface.
We further quantified the PICET kinetics of WO3 in [DMFH]+/DMF by considering the relationship between the peak current (ip) and scan rate (v) between 2–200 mV s−1:
| ip = avb | (1) |
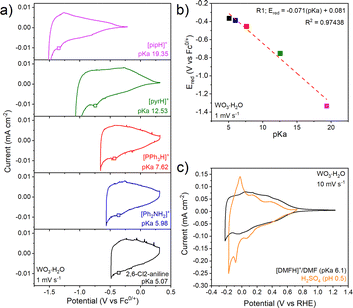
Next, we consider the electrochemistry of WO3·H2O in non-aqueous electrolytes containing organic acids (Fig. 3a). In each case the CVs are similar, with a broad current response that increases upon cathodic polarization and reverses upon anodic polarization, consistent with electron transfer to a semiconducting oxide. WO3·H2O exhibits super-Nernstian behavior, with the cathodic redox peak exhibiting a 71 mV pKa−1 unit shift (Fig. 3b). The changes (Fig. 3b) in linearity suggest changes in the mH+/ne− ratios at different pKa ranges, however, further investigation is required to understand the origin of these changes. The total charge passed in WO3·H2O corresponds to ∼0.06 e−/H+ per formula unit in [DMFH]+/DMF at 2 mV s−1, with ∼85% capacity retention at 200 mV s−1 (Fig. S11b). At 10 mV s−1 (Fig. 3c), WO3·H2O inserts 0.06 H+/e− in the organic acid-containing electrolyte, slightly lower than the 0.08 H+/e− observed in H2SO4. Compared to H2SO4 (Fig. 3c), the overall CV shape of WO3·H2O in [DMFH]+/DMF is relatively similar above 0 V vs RHE. Below 0 V vs. RHE, the CV shape in the organic acid deviates from the aqueous case, showing no sharp redox peaks, as in WO3, likely due to kinetic limitations in the electrolyte. We hypothesize that the Brønsted acidity of WO3·H2O allows for fast interfacial PCET kinetics even in the absence of water in the electrolyte. b-value analysis of WO3·H2O (Fig. S11d) shows b ≈ 0.99, indicating a surface-controlled process as seen in aqueous inorganic acids.20 Raman spectroscopy shows that neither WO3 nor WO3·H2O undergoes noticeable structural change after electrochemical cycling (Fig. S13).
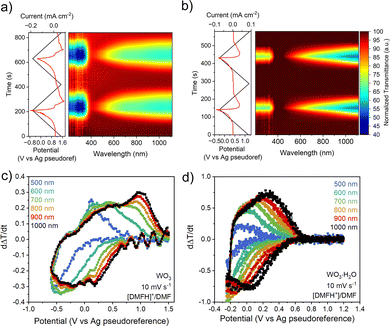
To conclusively determine whether the electrochemical response in non-aqueous electrolytes occurs due to PICET, we performed operando electrochemical UV-VIS-NIR spectroscopy, since ion insertion into tungsten oxides leads to electrochromism.13,21–23 Upon reduction in [DMFH]+/DMF at 10 mV s−1, WO3 shows a decrease in transmittance between 200–390 nm and 400–1100 nm corresponding to the formation of HxWO3, followed by a reversible increase in transmittance during oxidation (Fig. 4a). Transmittance changes below 400 nm are associated with interband transitions from the valence band to the conduction band.21,24 With increasing states of charge, WO3 undergoes structural transformations from a monoclinic, to a tetragonal, to a cubic bronze structure with near-ideal WO6 octahedral environments.25 Overlapping low-lying d-orbitals of the higher symmetry HxWO3 results in simultaneous transmittance in the visible and NIR regime.26 At 100 mV s−1, WO3 exhibits a lower decrease in transmittance due to the lower degree of PICET (Fig. S14a). WO3·H2O exhibits nonsynchronous optical changes, with low states of charge leading to transmittance decreases first in the NIR regime, and with continued reduction resulting in changes in the visible regime. This asynchronous transmittance change is associated with the impact of the structural water ligand on the electronic structure.26 For WO3·H2O, the magnitude of the transmittance changes is maintained when cycled at 10 mV s−1 and 100 mV s−1 (Fig. 4b and Fig. S14b). UV-vis transmittance spectra at select potentials are shown in Fig. S15. The behavior in organic acid electrolytes is consistent with the response in aqueous inorganic acid electrolytes, which we attribute to the influence of the octahedral ligand environment in WO3 vs. WO3·H2O and the state of charge (n) accessible in each electrolyte at different scan rates.26
To further analyze the electrochromic responses in organic acid electrolytes, we quantified the rate of transmittance change, dΔT/dt, at wavelengths between 500 and 1000 nm. The dΔT/dt vs., potential (Fig. 4c and d) correlates to the electrochemical current response in cyclic voltammetry for insertion hosts.21,26 The response of WO3 at 10 mV s−1 (Fig. 4c) shows that although the operando UV-vis data suggests a nearly simultaneous transmittance response across the wavelength range of interest, the rate of transmittance change is slightly larger at NIR wavelengths than in the visible regime. This effect is intensified at faster scan rates (Fig. S14c), as the transmittance rate of change at 500 nm becomes significantly weaker. The response of WO3·H2O (Fig. 4d) shows a systematic increase in dΔT/dt from 500 nm (visible) to 1000 nm (NIR). This wavelength-dependent optical modulation remains consistent even at faster scan rates (Fig. S14d), indicating that the electrochromic response of WO3·H2O is less kinetically limited than in WO3, in line with the CV results.
We characterized PICET into tungsten oxide thin films from non-aqueous electrolytes containing organic acids. We compared the PICET behavior of WO3 and WO3·H2O by electrochemically cycling the films in electrolytes containing organic acids ranging in pKa from 5.07 to 19.35, finding that both oxides exhibit a near-Nernstian shift in the redox peaks. CV comparisons of aqueous inorganic acid and non-aqueous organic acid electrolytes show more sluggish PICET kinetics in the latter, which we hypothesize originate from the organic acid electrolyte and not the oxide electrodes. The response of WO3·H2O was less medium-dependent, which we hypothesize occurs due to the Brønsted acidity of the WO3·H2O which allows for more facile interfacial proton transfer in the absence of water in the electrolyte. Using operando electrochemical UV-vis-NIR spectroscopy, we observed transmittance changes across the visible and NIR wavelengths in both oxides upon reduction and oxidation in the organic-acid containing electrolytes, confirming the PICET mechanism. While WO3 shows an almost simultaneous transmittance change across the visible and NIR regime, WO3·H2O shows gradual changes in transmittance at lower states of charge only inducing NIR optical changes. To the best of our knowledge, this study provides the first report of electrochemical PICET from non-aqueous electrolytes into tungsten oxides.
This material is based upon work supported by the U.S. Department of Energy (DOE), Office of Science, Office of Basic Energy Sciences under award number DE-SC0023465. Characterization was performed in part at the Analytical Instrumentation Facility (AIF) at NC State University, which is supported by the State of North Carolina and the National Science Foundation (award number ECCS-2025064). The AIF is a member of the North Carolina Research Triangle Nanotechnology Network (RTNN), a site in the National Nanotechnology Coordinated Infrastructure (NNCI).
Conflicts of interest
There are no conflicts to declare.Data availability
Data for this article, including electrochemistry and UV-vis measurements, are available at Zenodo at https://doi.org/10.5281/zenodo.16903644.Supplementary information is available. See DOI: https://doi.org/10.1039/d5cc04875c.
References
- N. P. Holzapfel, V. Augustyn and V. Balland, ACS Energy Lett., 2025, 10, 1143–1164 CrossRef CAS.
- T. Takashima, K. Ishikawa and H. Irie, ACS Catal., 2019, 9, 9212–9215 CrossRef CAS.
- Y. Zhu, Z. He, Y. M. Choi, H. Chen, X. Li, B. Zhao, Y. Yu, H. Zhang, K. A. Stoerzinger, Z. Feng, Y. Chen and M. Liu, Nat. Commun., 2020, 11, 4429 CrossRef PubMed.
- A. A. Fertig and E. M. Matson, Inorg. Chem., 2022, 62, 1958–1967 CrossRef PubMed.
- K. R. Proe, E. Schreiber and E. M. Matson, Acc. Chem. Res., 2023, 56, 1602–1612 CrossRef CAS PubMed.
- S. E. Cooney, M. R. A. Walls, E. Schreiber, W. W. Brennessel and E. M. Matson, J. Am. Ceram. Soc., 2024, 146, 2364–2369 CrossRef CAS PubMed.
- S. Park, S. I. Nishimura, A. Kitada and A. Yamada, ACS Appl. Energy Mater., 2024, 7, 4347–4352 CrossRef CAS.
- H. S. Nedzbala, D. Westbroek, H. R. M. Margavio, H. Yang, H. Noh, S. V. Magpantay, C. L. Donley, A. S. Kumbhar, G. N. Parsons and J. M. Mayer, J. Am. Chem. Soc., 2024, 146, 10559–10572 CrossRef CAS PubMed.
- R. G. Agarwal, H. J. Kim and J. M. Mayer, J. Am. Chem. Soc., 2021, 143, 2896–2907 CrossRef CAS PubMed.
- H. Noh and J. M. Mayer, Chem, 2022, 8, 3324–3345 CAS.
- C. F. Wise and J. M. Mayer, J. Am. Chem. Soc., 2019, 141, 14971–14975 CrossRef CAS PubMed.
- N. Makivić, K. D. Harris, J. M. Tarascon, B. Limoges and V. Balland, Adv. Energy Mater., 2023, 13, 2203122 CrossRef.
- T. Rocca, A. Gurel, D. Schaming, B. Limoges and V. Balland, ACS Appl. Mater. Interfaces, 2024, 16, 23567–23575 CAS.
- J. M. Mayer, J. Catal., 2024, 439, 115725 CrossRef CAS.
- J. B. Mitchell, N. R. Geise, A. R. Paterson, N. C. Osti, Y. Sun, S. Fleischmann, R. Zhang, L. A. Madsen, M. F. Toney, D. Jiang, A. I. Kolesnikov, E. Mamontov and V. Augustyn, ACS Energy Lett., 2019, 4, 2805–2812 CrossRef CAS.
- M. A. Spencer, N. P. Holzapfel, K. E. You, G. Mpourmpakis and V. Augustyn, Chem. Sci., 2024, 15, 5385–5402 RSC.
- H. Li, M. Abdelgaid, J. R. Paudel, N. P. Holzapfel, V. Augustyn, J. R. McKone, G. Mpourmpakis and E. J. Crumlin, J. Am. Chem. Soc., 2025, 147, 6472–6479 CrossRef CAS PubMed.
- J. E. Benson, H. W. Kohn and M. Boudart, J. Catal., 1966, 5, 307–313 CrossRef CAS.
- M. Chagnot, S. Abello, R. Wang, J. Dawlaty, J. Rodríguez-López, C. Zhang and V. Augustyn, J. Electrochem. Soc., 2025, 172, 049002 CrossRef CAS.
- J. B. Mitchell, W. C. Lo, A. Genc, J. Lebeau and V. Augustyn, Chem. Mater., 2017, 29, 3928–3937 CrossRef CAS.
- J. Fortunato, B. Z. Zydlewski, M. Lei, N. P. Holzapfel, M. Chagnot, J. B. Mitchell, H. C. Lu, D. E. Jiang, D. J. Milliron and V. Augustyn, ACS Photonics, 2023, 10, 3409–3418 CrossRef CAS.
- B. Z. Zydlewski, H. C. Lu, H. Celio and D. J. Milliron, J. Phys. Chem. C, 2022, 126, 14537–14546 CrossRef CAS.
- S. Heo, C. J. Dahlman, C. M. Staller, T. Jiang, A. Dolocan, B. A. Korgel and D. J. Milliron, Nano Lett., 2020, 20, 2072–2079 CrossRef CAS PubMed.
- M. Duan, C. Hu, H. Li, Y. Chen, R. Chen, W. Gong, Z. Lu, N. Zhang, R. Long, L. Song and Y. Xiong, JACS Au, 2022, 2, 1160–1168 CrossRef CAS PubMed.
- N. P. Holzapfel, M. Chagnot, P. S. Abdar, J. R. Paudel, E. J. Crumlin, J. R. McKone and V. Augustyn, Chem. Mater., 2024, 36, 11684–11696 CrossRef CAS.
- M. Chagnot, N. P. Holzapfel, L. Kollias, Y. Yue, G. Mpourmpakis and A. Veronica, Phys. Rev. Mater., 2025, 9, 085201 CrossRef CAS.
| This journal is © The Royal Society of Chemistry 2025 |


