 Open Access Article
Evaporation-induced self-assembly of liquid crystal biopolymers
Soon Mo
Park
ab and
Dong Ki
Yoon
 *a
*a
aDepartment of Chemistry, Korea Advanced Institute of Science and Technology (KAIST), Daejeon, 34141, Republic of Korea. E-mail: nandk@kaist.ac.kr
bDepartment of Chemical and Biomolecular Engineering, Cornell University, Ithaca, NY 14853, USA
First published on 8th February 2024
Abstract
Evaporation-induced self-assembly (EISA) is a process that has gained significant attention in recent years due to its fundamental science and potential applications in materials science and nanotechnology. This technique involves controlled drying of a solution or dispersion of materials, forming structures with specific shapes and sizes. In particular, liquid crystal (LC) biopolymers have emerged as promising candidates for EISA due to their highly ordered structures and biocompatible properties after deposition. This review provides an overview of recent progress in the EISA of LC biopolymers, including DNA, nanocellulose, viruses, and other biopolymers. The underlying self-assembly mechanisms, the effects of different processing conditions, and the potential applications of the resulting structures are discussed.
Wider impactEvaporation-induced self-assembly (EISA) has increasingly captured the spotlight owing to its foundational scientific principles and the vast potential it holds for application in materials science and nanotechnology. Notably, liquid crystal biopolymers have emerged as promising candidates for EISA, primarily due to their highly organized structures and the biocompatible nature they acquire post-deposition. The review at hand provides a comprehensive panorama of recent strides in EISA concerning liquid crystal biopolymers and the intrinsic mechanisms propelling self-assembly and explores the ramifications of diverse processing conditions. Looking ahead, the insights unveiled in this review are poised to play a pivotal role in steering the trajectory of materials science by informing strategic advancements and enabling tailored approaches within the burgeoning domain of evaporation-induced self-assembly. |
1. Introduction
Evaporation of solutions is a natural phenomenon closely related to our life and fundamental science.1,2 And it offers valuable insights for industrial applications, such as coating, printing, and patterning.3–7 Thus, comprehending and effectively controlling the underlying principles of evaporation are essential. However, this proves to be challenging, given that diffusion and flow occur spontaneously during the drying and deposition processes.8 Moreover, a solution's characteristics continuously change, including concentration, density, viscosity, and interfacial area.9 To gain a comprehensive understanding of this spatiotemporal system, extensive research has been carried out on evaporation, delving into different aspects, encompassing initial concentrations,10,11 solution components,5,12 and boundary conditions.13 Beyond internal factors, manipulating external conditions, such as temperature, humidity,14 surface wettability,10,15 and exposed interfacial area,7 has led to intriguing phenomena. These phenomena include the Marangoni flows,5,12,16 stick-and-slip motion,10,11 and various deposition patterns.6 Especially, in the deposition process, suspended particles exhibiting anisotropy develop condensed phases near the contact line, giving rise to unique morphologies that reflect the phase information.17Anisotropic polymeric materials found in nature tend to undergo self-assembly once a specific concentration threshold is surpassed, displaying distinctive collective behavior owing to their unusual elasticity.18,19 For instance, when a diluted deoxyribonucleic acid (DNA) aqueous solution is evaporated on a substrate, the DNA chains extend linearly along the moving direction of the contact line due to the receding force.20,21 However, with an increase in the initial concentration, the DNA solution undergoes sequential transitions into chiral nematic and columnar phases during the drying process, and these structures in the phases are manifested in the resulting deposited film.22 Moreover, biopolymers exhibiting cholesteric phases, such as cellulose nanocrystals and collagen, create diverse hierarchical structures not observed in the building blocks which can form only uniaxial alignment.23–25 While their condensed phases, featuring various structural morphologies, have been extensively studied in equilibrium systems, there are limited cases demonstrating collective behavior in dynamic systems, particularly regarding phase transition processes near the liquid–air interface. Hence, comprehensive insights can give protocols for the evaporation of various anisotropic biomaterials with inspiring related research.
Here, we present the evaporation-induced self-assembly (EISA) of representative biopolymers and colloids that reveal the liquid crystal (LC) phases (Fig. 1 and Table 1). First, we commence with an examination of the physical properties of aqueous biopolymer solutions such as hydrodynamics, rheology, and LC elasticity. This analysis explores molecular attributes such as the length scale, morphology, and surface chemistry, subsequently correlated with extensive research on lyotropic LC phases. We delineate anisotropic morphologies in the deposited film depending on the building blocks and highlight their potential for practical applications. Knowledge of evaporation holds significance not only for comprehending collective behavior within non-equilibrium systems but also for gaining fresh insights into leveraging biopolymers as fundamental building blocks in materials sciences.
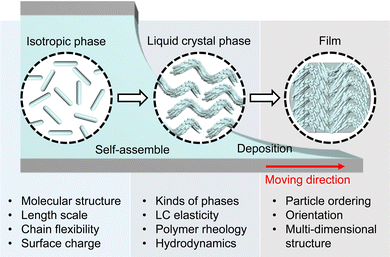 | ||
| Fig. 1 Overview of evaporation-induced self-assembly of anisotropic biopolymers. The figure is reproduced from ref. 123 with permission from John Wiley and Sons, copyright 2021. | ||
| Category | Material specification | Methodology | Experimental condition | Driving force | Deposited structure | Ref. |
|---|---|---|---|---|---|---|
| DNA | λ-phage DNA (48.5 kbp, New England Biolabs Inc.) | Drop casting | Conc. 50 pg mL−1 | Chain extension | Line pattern | 155 |
| Vol. 0.5 μL | ||||||
| T4-phage DNA (166 kbp) | Drop casting | Conc. 0.1 μM | Chain extension | Line pattern | 156 | |
| Vol. 1 μL | ||||||
| E. coli DNA | Sandwich cell (Thickness: 20 um) | Chain extension | Line pattern | 20 | ||
| λ-phage DNA (48.5 kbp, New England Biolabs Inc.) | Template-assisted (Microchannel) | Δ Surface Hydrophilicity | Chain extension | Line-based various pattern | 157 | |
| Δ Template geometry | ||||||
| λ-phage DNA (48.5 kbp, New England Biolabs Inc.) | Template-assisted (Micropost), Shear coating | Conc. 20-100 μg mL−1 | Chain extension | Line-based various pattern | 158 | |
| Δ Template geometry | ||||||
| λ-phage DNA (48.5 kbp, GibcoBRL) | Spin coating | Conc. 0.4 μg mL−1 | Chain extenstion | Line pattern | 159 | |
| λ-phage DNA (48.5 kbp, New England Biolabs Inc.) | Blade coating | Conc. 5–10 μg mL−1 | Chain extension | Line pattern | 160 | |
| DNA sodium salt from salmon sperm (BioChem Co.) | Drop casting | Conc. 3.1–31 mg mL−1 | Nematic | Circular alignment | 22 | |
| Molecular weight 1.4–29 kbp | ||||||
| λ-phage DNA (48.5 kbp, New England Biolabs Inc.) | Drop casting | Conc. 0.02–5 mg mL−1 | Columnar | Zigzag alignment | 42 | |
| Vol. 1–50 μL | ||||||
| DNA (Chitose Institute of Science and Technology) | Shear coating | Conc. ∼20 wt % | Nematic | Uniaxial alignment | 145 | |
| DNA sodium salt from herring testes | Shear coating | Conc. 8 wt% | Nematic | Uniaxial alignment | 161 | |
| DNA sodium salt from calf thymus (Sigma Aldrich) | Shear coating | Conc. 200–300 mg mL−1 | Nematic | Uniaxial alignment | 143 | |
| DNA sodium salt from salmon testes (∼2000 bp, Sigma Aldrich) | Shear coating | Nematic and columnar | Uniaxial and zigzag alignment | 71, 72 and 162 | ||
| DNA sodium salt from salmon testes (∼2000 bp, Sigma Aldrich) | Template-assisted (Microtemplate), Blade coating | Δ Template geometry | Nematic and columnar | Periodic two-dimensional structure | 73 and 74 | |
| CNC | Cotton powder hydrolyzed by sulfuric acid | Drop casting, Sandwiched cell | Conc. 0.5–8 wt% | Nematic and Cholesteric | Circular alignment | 23 |
| Radially aligned wavy structure (P ∼1–100 μm) | ||||||
| Resinous tree hydrolyzed by sulfuric acid | Template-assisted (Petri dish) | Smectic and lamellar | Smectic-like and multilamellar structures | 163 | ||
| Purified cellulose powder (CF-11; Whatman Co.) hydrolyzed by hydrobromic acid | Drop casting Shear coating | Additive (Polyvinyl alcohol, PVA) | Nematic | Circular and Uniaxial alignment | 88 | |
| Purified cellulose powder (CF-11; Whatman Co.) hydrolyzed by hydrobromic acid | Template-assisted (Embossed pattern) | Conc. 0.01–0.5 wt% of PVA | Nematic | Multi-directional alignment (parallel to the boundary condition) | 89 | |
| Additives (PVA) | ||||||
| Wood pulp (CelluForce) hydrolyzed by sulfuric acid | Drop casting | Additives (Xylan) | Nematic | Uniaxial and multi-directional (orthogonal) alignment | 90 | |
| Conc. 0–10 mg mL−1 | ||||||
| Temp. 20–60 °C | ||||||
| Vol. 3–100 μL | ||||||
| Δ Enzymatic reaction | ||||||
| CNCs hydrolyzed by sulfuric acid (The University of Maine Process Development Center) | Drop casting | Conc. 0.1–3.9 wt% | Nematic | Uniaxial and Multi-directional (orthogonal) alignment | 87 | |
| Vol. 0.25–5 μL | ||||||
| Δ Substrate hydrophilicity | ||||||
| Microcrystal cellulose hydrolyzed by sulfuric acid (Sinopharm Chemical Reagent Co.) | Drop casting | Conc. 10 mg mL−1 | Nematic | Circular alignment | 92 | |
| Temp. 25–65 °C | ||||||
| Vol. 10−4–102 μL | ||||||
| Microcrystal cellulose hydrolyzed by sulfuric acid (Thermo Fisher Scientific) | Template-assisted (Spatial confinement) | Conc. 9 mg mL−1 | Nematic | Tailored circular and multi-directional alignment (parallel to the boundary condition) | 93 | |
| Vol. 1–10 μL | ||||||
| Softwood sulfite pulp lapsheets hydrolyzed by sulfuric acid (Temalfa 93, Tembec Inc.) | Template-assisted (Petri dish) | Conc. 10 mL | Cholesteric | Parabolic focal conic structure | 164 | |
| Cellulose hydrolyzed by sulfuric acid (The U.S. Forest Products Laboratory at University of Maine) | Drop casting | Conc. 6 wt% | Cholesteric | Polydomain structure with fingerprint texture | 165 | |
| Vol. 50 μL | ||||||
| Amyloid fibrils | Protein extracted from β-Lactoglobulin | Drop casting | Conc. 2 wt% | Cholesteric | Cholesteric fingerprint and Parabolic focal conic structure (P ∼2–6 μm) | 108 |
| Vol. 5 μL | ||||||
| Protein extracted from β-Lactoglobulin | Template-assisted (Sandwiched cell, Microchannel) | Δ Template geometry | Nematic | Uniaxial alignment | 109 | |
| Line-shaped structure | ||||||
| (P ∼10–100 μm) | ||||||
| Tobacco Mosaic Virus (TMV) | Drop casting | Vol. 20–30 uL | Nematic | Uniaxial, zigzag, and LC defect-like alignment | 166 | |
| Conc. 0.5–50 mg mL−1 | ||||||
| Template-assisted (Capillary tube) | Nematic | Periodic band structure and multi-directional (Orthogonal) alignment | 167 | |||
| M13 Bacteriophage | Engineered M13KE phage (New England Biolabs Inc.) amplified by E. Coli | Template-assisted (Microtube) | Conc. 1–10 mg mL−1 | Chiral smectic C | Zigzag, helicoidal, and vertical-striped structures | 119 |
| Engineered M13KE phage (New England Biolabs Inc.) amplified by E. Coli | Droplet | Smectic | Nematic and Smectic-like structure | 168 | ||
| Engineered M13KE phage (New England Biolabs Inc.) amplified by E. Coli | Droplet | Smectic | Nematic and Smectic-like structure | 169 | ||
| Solution Coating process | ||||||
| Engineered M13KE phage (New England Biolabs Inc.) amplified by E. Coli | Solution (Dip) coating process | Conc. 0.1–6 mg mL−1 | Nematic | Nematic orthogonal twist | 120 | |
| Coating speed 1–100 μm min−1 | Cholesteric helical ribbon | |||||
| Smectic helicoidal nanofilament (P ∼100–200 μm) | ||||||
| Engineered M13KE phage (New England Biolabs Inc.) amplified by E. Coli | Solution (Dip/blade) Coating process | Conc. 5-20 mg mL−1 | Cholesteric | Helicoidal structure (P∼ 1–10 μm) | 123 | |
| Coating speed 3–18 μm s−1 | ||||||
| Engineered M13KE phage (New England Biolabs Inc.) amplified by E. Coli | Solution (Dip) coating process | Conc. 0.1–1 mg mL−1 | Nematic and cholesteric | Two-dimensional dot pattern | 122 | |
| Coating speed 0.01–5 mm min−1 | Smectic-like and arch-shaped structures (P∼ 50–200 μm) | |||||
| Ionic strength 0.001–10 mM | ||||||
| Collagen fibrils | Type 1 from calf skin | Drop casting | Conc. 10 mg mL−1 | Cholesteric | Undulating and arch-shaped structure (P ∼1–10 μm) | 130 |
| Vol. 50 μL | ||||||
| pH 3–7 | ||||||
| Type 1 from calf skin | Template-assisted (Sandwiched cell) | Conc. 5 mg mL−1 | Cholesteric | Undulating and helicoidal structure (P ∼ 1–10 μm) | 125 | |
| pH 3 | ||||||
| 90% Type 1 and 10% Type 2 from steer skin | Drop casting | Conc. 0.005–23 mg mL−1 | Cholesteric | Concentric ring pattern | 135 | |
| Vol. 30–50 μL | Undulating structure (P ∼5–50 μm) | |||||
| Δ Evaporation rate | ||||||
| Type 1 from rat tail tendons | Template-assisted (Microchamber) | Cholesteric | Arch-shaped structure | 24 | ||
| Type 1 from rat tail tendons | Inkjet printing | Conc. 3.6–20 mg mL−1 | Cholesteric | Undulating structure (P∼3–5 μm) | 136 | |
| Coating speed 20–100 mm s−1 | ||||||
| Flow rate 0.05–0.5 mL min−1 |
2. Driving forces in EISA of anisotropic biopolymers
2.1. Hydrodynamics and rheological properties of the aqueous solution
We will introduce a comprehensive overview of EISA processes concerning anisotropic biopolymers and colloids, along with the resultant anisotropic structures observed in the deposited films. The flow of the liquid towards the contact line, driven by a surface tension gradient at the liquid–gas interfaces, causes the suspended solutes to condense.8,9 It leads to a phase transition near the contact line, and the distinctive morphological patterns emerge as a manifestation of the liquid crystalline structures of the solutes during the drying process. To comprehend the underlying driving forces for these structures, our focus shifts toward investigating the self-assembly process within a non-equilibrium system. This inquiry is approached through the views of hydrodynamics, rheological analysis, and LC elasticity.When positioning the initial concentration of the aqueous biopolymer solution in proximity to the nematic phase to initiate the self-assembly of LCs during the drying process, the solution exhibits a relatively high viscosity owing to the substantial macromolecular weight of the solute. This elevated viscosity correlates with a lower Reynolds number (Re), a parameter delineating flow conditions in hydrodynamics,26
 ), v is the flow velocity (m s−1,
  ), L is the length scale of the system (m,
  ) and η is the solution dynamic viscosity (Pa s,
  ).
).
This elucidates that solute transportation during evaporation is primarily governed by capillary flow, transpiring along laminar capillary streamline pathways devoid of turbulence.
The capillary flow profile of (i) the sessile droplet, as well as (ii) under the meniscus curve in the coating process, can be assessed through height averaging when the solution undergoes evaporation under conditions of partial wetting (where the contact angle θ lies between 0° and 90°, Fig. 2a and b).
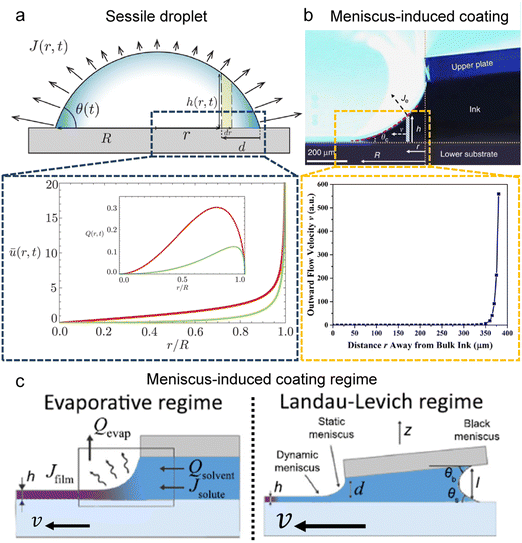 | ||
| Fig. 2 Flow characterization in the drying process. Schematic illustration and internal velocity profile in the (a) partially wetted sessile droplet and (b) meniscus-assisted solution coating process. (c) Solution coating regime depending on the plate moving speed; evaporative regime and Landau–Levich regime. (a) Reproduced from ref. 28 with permission from The Royal Society of Chemistry, copyright 2022. (b) Reproduced from ref. 29 with permission from Springer Nature, copyright 2017. (c) Reproduced from ref. 33 with permission from Springer Nature, copyright 2018. | ||
where ū is the height-averaged velocity of the internal fluid, D is the diffusion coefficient of vapor in the air (m2 s−1), Δc = cs − c∞ is the difference of the saturated vapor concentration between just above the liquid–air interface and ambient air, θ is the contact angle, r is the distance from the center, and R(t) is the radius depending on the time (m).
where ū is the height-averaged velocity of the internal fluid and r is the distance from the edge of the blade. h(r) is height under parabolic meniscus curve h = a(R − r)b, where h is dependent on the moving speed of the lower substrate, K is the non-equilibrium parameter, W is the thermal effect given by W = (kds)/(ksd0) (k is the liquid thermal conductivity, ks is the thermal conductivity of the substrate, d0 is the liquid thickness and ds is the thickness of the substrate). For water,
 .
.
Both estimations reveal a pronounced increase in fluid velocity in the evaporation process in proximity to the contact line.27,29 This phenomenon underscores that the flow in the vicinity of the contact line, coupled with the concentration increase owing to evaporation, can trigger solute condensation and induce a phase transition into the LC phase. This concurs with the experimentally observed phase transition within the micrometre-scale ((10−6–10−4) m) distanced from the contact line. It implies that to control the alignment of the solutes in the deposited film, the self-assembly phenomena occurring in the region should be controlled.
During the coating process, the moving velocity of the substrate can be regulated, exerting an influence on the alignment of the solutes before deposition. When examining the capillary number (Ca) for the aqueous biopolymer solution within this system, which gauges the relative impact of viscous drag forces against surface tension forces operating at the liquid–gas interface,16,27 it becomes evident that its value ranges from 10−4 to 10−2. This range presents still in the capillary force-dominant region but can be close to the intermediate state, particularly if the velocity increases an order of magnitude in the micrometers per second range.30 Consequently, the number means that manipulating the coating velocity empowers the control of the forces governing the self-assembly process through evaporation,
 and v is the moving speed (m s−1,
  ).
).
Indeed, within the coating process, two distinct regimes emerge depending on the moving velocity: the evaporation regime, characterized by the capillary assembly of solutes, and the Landau–Levich regime, signifying deposition through drag (Fig. 2c). The boundary defining their transition is termed the cross-over velocity, denoted as Vc,31–33
 is the capillary length (m,
  ) and g is the gravitational acceleration. J0 is given by
  related to the evaporation flux of water. For water,
  . θ is the contact angle.
For aqueous biopolymer solutions, the estimated Vc is in the proximity of 10 μm s−1, aligning with the boundary velocity experimentally observed to trigger a shift in the LC orientation in the deposited film. In the Landau–Levich regime (v > Vc), non-volatile solutes become kinetically quenched at the dragged meniscus before completely dehydrating. It leads to the orientation parallel to the coating direction. Conversely, in the evaporation regime (v < Vc), the solutes are afforded ample time for aggregation and self-assembly near the contact line. This temporal difference in behavior potentially clarifies the dependence on the flow dynamics of LC self-assembly of the solutes.
2.2. Liquid crystal elasticity of anisotropic biopolymers and colloids
In the drying process, the LC phases of the anisotropic biopolymers are developed near the contact line due to the flow-induced condensation, and the morphologies are directly reflected in the deposited film. The foundational LC and molecular anisotropy model is rooted in Onsager's approach, specifically targeting monodisperse infinite hard rods.34 Following the theorem, researchers have advanced this framework by introducing an extension that accommodates the finite length scales and flexibility of solutes, which is gauged by contour length (L), diameter (d), and persistence length (p).35–39 Their study unveiled that this flexibility factor (α = l/p) contributed to the increased critical concentration and a corresponding decrease in the order parameter based on the Onsager criteria,where ϕ is the volume fraction of the solutes, d is the diameter (m), l is the contour length of the biopolymer (m), and p is the persistence length (m).
The LC building blocks align themselves parallel to the direction of the capillary flow streamline in order to minimize rotational resistance.40,41 Meanwhile, the solutes present in the LC phases undergo splay deformation due to the convergence of meniscus towards the solid–liquid–air triple point on the substrate (Fig. 3a). The collective behavior exhibited by liquid crystalline biopolymers throughout the drying process can be described through the integration of the Frank–Oseen elastic energy (F) coupled with condensation effects.42 Notably, the modified equation captures the phenomenon of solute condensation induced by capillary flow, which subsequently accelerates the elastic instability of the system beneath the meniscus curve,
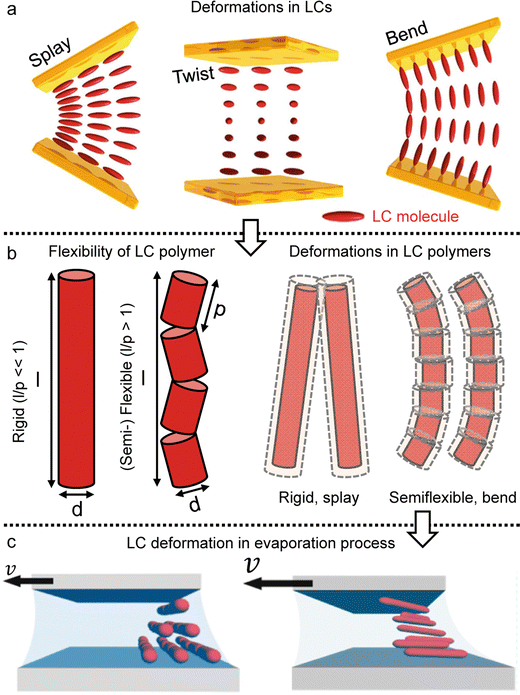 | ||
| Fig. 3 LC polymer elasticity in the drying process. (a) Three kinds of director deformation in the liquid crystal phase; splay, twist, and bend. (b) Length scales of rod-like particles and examples of the LC polymer configuration under deformation. (c) Schematic illustration of LC directors depending on the solution coating speed. (a) Reproduced from ref. 41 with permission from Springer Nature, copyright 2019. (c) Reproduced from ref. 47 with permission from American Chemical Society, copyright 2017. | ||
In this formula, the elastic constants of the liquid crystal are associated with factors such as the volume fraction and length scales.43,44 Discrepancies persist between theoretical models and experimental measurements in the interpretation of ‘semi-flexible’ criteria (L ∼ Α*p), where Α is the constant.36,37 Nevertheless, we choose to simplify matters by directly comparing the contour length (l) to the persistence length (p) (Fig. 3b).
(i) The elastic constants of rigid LC polymers (l < p)
(ii) The elastic constants of (semi-) flexible LC polymers (l > p)
By directly comparing the relaxation time of splay deformations with the duration leading to the kinetically quenched state during the drying process, it would yield the most precise insight into the formation of an anisotropic structure within the deposited film.45 Unfortunately, due to the current lack of analytical methods for such assessments, our approach is to focus on comprehending the system through the Ericksen number (Fig. 3c).46,47 This dimensionless number effectively characterizes the interplay between LC elasticity and capillary-induced viscous forces that emerge during evaporation. The LC elasticity could be estimated through the elastic constants of the deformations, and although the numbers are around the unity, we could discern which force slightly dominates this system depending on the coating speed,
Our focus has been on discerning Ericksen numbers by employing carefully chosen papers, enabling us to estimate and correlate these values with the orientation of biopolymers within deposited films (Table 2). Examples in the table about the ambient drying of biopolymer solutions reveal Ericksen numbers spanning 0.1 to 10. The numerical values exhibit higher magnitudes when the orientation of building blocks aligns parallel to the coating direction. Conversely, in instances where the material orients perpendicular to the coating direction, the numbers generally range from 0.2 to 4. Additionally, an undulated structure in the cases of bacteriophage and collagen emerges under transient conditions between parallel and perpendicular alignments.
| Building block | Diameter (nm) | Contour length (nm) | Persistence length (nm) | Viscosity @ LC (Pa*s) | Dewetting velocity (μm s−1) | Film thickness (μm) | LC elasticity (pN) | Ericksen number, Er | Molecular alignment | Ref. |
|---|---|---|---|---|---|---|---|---|---|---|
| Salmon sperm DNA | 2 | 680 | 50 |

|
1–10 | ∼3 | ∼16.7 | Erv=1![[thin space (1/6-em)]](https://www.rsc.org/images/entities/char_2009.gif) μm μm![[thin space (1/6-em)]](https://www.rsc.org/images/entities/char_2009.gif) s−1 ∼ 1.8 s−1 ∼ 1.8 |
n
LC⊥![[v with combining right harpoon above (vector)]](https://www.rsc.org/images/entities/i_char_0076_20d1.gif) |
72 and 145 |
Erv=10![[thin space (1/6-em)]](https://www.rsc.org/images/entities/char_2009.gif) μm μm![[thin space (1/6-em)]](https://www.rsc.org/images/entities/char_2009.gif) s−1 ∼ 1.8 s−1 ∼ 1.8 |
n
LC‖![[v with combining right harpoon above (vector)]](https://www.rsc.org/images/entities/i_char_0076_20d1.gif) |
|||||||||
| Cellulose nanocrystals | 10 | 100 | 2800 |

|
5 | ∼10 | ∼0.5 | Erv=2![[thin space (1/6-em)]](https://www.rsc.org/images/entities/char_2009.gif) μm μm![[thin space (1/6-em)]](https://www.rsc.org/images/entities/char_2009.gif) s−1 ∼ 4 s−1 ∼ 4 |
n
LC⊥![[v with combining right harpoon above (vector)]](https://www.rsc.org/images/entities/i_char_0076_20d1.gif) |
91 |
| Protein amyloids | 3 | 300 | 1980 |

|
∼1 | ∼1 | ∼0.5 | Erv=1![[thin space (1/6-em)]](https://www.rsc.org/images/entities/char_2009.gif) μm μm![[thin space (1/6-em)]](https://www.rsc.org/images/entities/char_2009.gif) s−1 ∼ 0.2 s−1 ∼ 0.2 |
n
LC⊥![[v with combining right harpoon above (vector)]](https://www.rsc.org/images/entities/i_char_0076_20d1.gif) |
109 |
| M13 bacteriophage | 6.6 | 880 | 2200 |

|
3–18 | ∼3 | ∼15 | Erv=3![[thin space (1/6-em)]](https://www.rsc.org/images/entities/char_2009.gif) μm μm![[thin space (1/6-em)]](https://www.rsc.org/images/entities/char_2009.gif) s−1 ∼ 0.6 s−1 ∼ 0.6 |
n
LC⊥![[v with combining right harpoon above (vector)]](https://www.rsc.org/images/entities/i_char_0076_20d1.gif) |
74 |
Erv=9![[thin space (1/6-em)]](https://www.rsc.org/images/entities/char_2009.gif) μm μm![[thin space (1/6-em)]](https://www.rsc.org/images/entities/char_2009.gif) s−1 ∼ 1.8 s−1 ∼ 1.8 |
n LC: undulated | |||||||||
Erv=18![[thin space (1/6-em)]](https://www.rsc.org/images/entities/char_2009.gif) μm μm![[thin space (1/6-em)]](https://www.rsc.org/images/entities/char_2009.gif) s−1 ∼ 3.6 s−1 ∼ 3.6 |
n
LC‖![[v with combining right harpoon above (vector)]](https://www.rsc.org/images/entities/i_char_0076_20d1.gif) |
|||||||||
| Collagen fibril | 1.5 | 300 | 50–80 |

|
∼2 | ∼1 | ∼0.5 | Erv=2![[thin space (1/6-em)]](https://www.rsc.org/images/entities/char_2009.gif) μm μm![[thin space (1/6-em)]](https://www.rsc.org/images/entities/char_2009.gif) s−1 ∼ 10 s−1 ∼ 10 |
n LC: undulated | 135 |
Our investigation affirms that the orientation of the biopolymers within the deposited film can be manipulated by the dominance of capillary flow and LC elasticity, irrespective of the atomic composition or molecular structure of the building blocks. Throughout the evaporation process, the orientation of the blocks aligns parallel to the capillary flow when viscous force dominates, whereas the dominance of elastic force results in alignment perpendicular to the flow direction (parallel to the contact line). Notably, the alignment is absent in cases of diluted concentration because it could be driven by the characteristics of collective behavior exhibited in the LC phases. Furthermore, in instances where the biopolymers form a helical structure, an undulated pattern reflective of the helicity manifests in a range in which viscous force and elasticity are balanced. Our findings elucidate the role of capillary flow and LC elasticity in governing chain orientation during the evaporation process and highlight the impact of chirality on the resultant film structure. In addition, the transient Ericksen number at cross-over velocities during the coating process suggests that theoretical estimations hold promise for interpreting biopolymer alignment in thin films.
3. Liquid crystal phases and anisotropic structure formation in EISA
3.1. Deoxyribonucleic acid (DNA)
Organisms have evolved various strategies to compress their genetic material, DNA, to the smallest possible cellular level: LC ordering,48–53 supercoiling by entanglement,54,55 hierarchical structure by DNA-histone interactions,56,57etc. Indeed, LC forms, one of the strategies for molecular compaction, have been found in sperm heads, chromosomes, and viruses (Fig. 4), where the compression efficiency of LC has allowed tens of thousands of base pairs with an overall contour length of a few microns to be packed into the capsids or heads of 50–100 nm. This ingenious packing not only efficiently stores genetic information but also protects the DNA from potential harm, including irradiation, oxidative agents, and degrading enzymes, because it reduces the accessibility of DNA molecules through structural sequestration.58 In particular, the DNA LC expression has not only served important functions in living organisms, but has also helped to analyze the structure of DNA. When measuring X-ray diffraction patterns to analyze the structure of DNA chains, the chains could be aligned without interchain entanglement, which allowed for the formation of clear X-ray diffraction patterns.59,60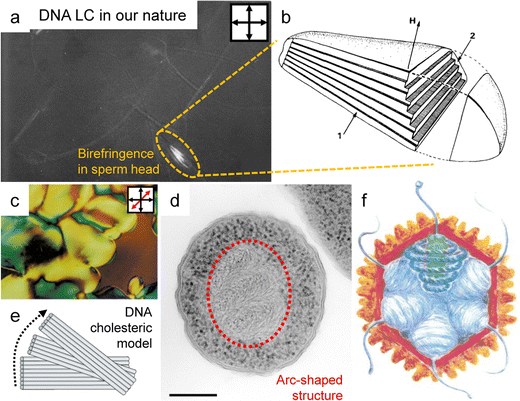 | ||
| Fig. 4 DNA liquid crystal ordering in nature. (a) A polarized optical microscopy image (POM) of stallion spermatozoa. (b) Schematic illustration of DNA ordered structure in the sperm head. (c) The POM image of DNA liquid crystals purified from bacterial plasmids. (d) Arc-shaped DNA structure in starved Dps−Escherichia coli cell. (e) Partial alignment of DNA within consecutive layers that undergo continuous rotation in relation to each other. (f) Illustration for the DNA alignment in virus capsid. The blue coils present DNA indicating the 5-fold vertices within the core. (a) and (b) Reproduced from ref. 53 with permission from Elsevier, copyright 1984. (c)–(e) Reproduced from ref. 58 with permission from Springer Nature, copyright 2002. (f) Reproduced from ref. 52 with permission from Elsevier, copyright 1999. | ||
To understand the spontaneous phase transition to the ordered LC phases, numerous studies have revealed several distinct characteristics of these LCs in vitro (Fig. 5).61–63 The emergence of the phases can be theoretically explained by modelling the chain as the repulsive rigid or semi-flexible rod-like particle. The length scales of DNA chains with diameter (d ∼ 2 nm), contour length (l ∼ 0.34 * the number of base pairs (bp)), and persistence length (p ∼ 50 m)64 satisfied the condition for LC ordering as stated by the Onsager criteria (Fig. 5a). The critical volume fraction (φI–N) marking the transition from the isotropic to nematic phase was found to be influenced by the number of base pairs below the persistence length.65 In practical terms, this implies that exceeding 147 bp in a single DNA chain does not significantly vary the volume fraction compared to cases below 147. Depending on the concentration, different phases were identified, including nematic, cholesteric, and columnar, through polarizing optical and electron microscopy to obtain structural information based on the molecular structure (Fig. 5b–d).61–63,65 Moreover, given the polyelectrolyte nature of DNA, its distinct traits were influenced by surrounding ionic contents that change the persistence length and the effective diameter of the DNA molecule.66,67 Significant insights have emerged by investigating the rigid DNA fragments within differing ionic environments, such as interparticle spacing and phase boundary transition in the LC phases.65,68 This behavior becomes more evident in various additives such as polyvalent cations (including polyamines), polymers, and organic solvents.69 Those investigations also help to estimate the collective behavior of DNA in cholesteric and hexagonal columnar phases and semiflexible DNA chains with long contour lengths (L/P > 1). The flexibility does not fundamentally change the intrinsic properties of the LC phases (including the nematic and columnar hexagonal arrays), but it does affect the defect composition and rheological properties of the solution.
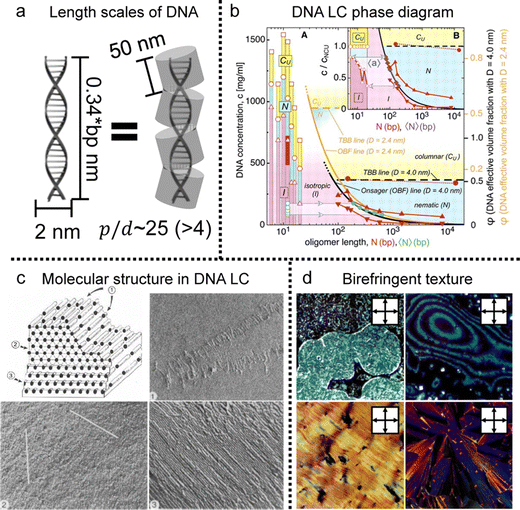 | ||
| Fig. 5 DNA LC phases in vitro. (a) Length scale of DNA molecules. (bp: the number of base pairs) (b) liquid crystal phase diagram of DNA solution depending on concentration and contour length. (c) Schematic illustration of the highly concentrated liquid crystalline DNA structure. The number represent series of layers in the lamellar structure of the hexagonal phase. (d) Multiple morphologies of DNA liquid crystals observed under crossed polarizers. (b) Reproduced from ref. 65 with permission from Science, copyright 2006. (c) Reproduced from ref. 61 with permission from Springer Nature, copyright 1989. (d) Reproduced from ref. 63 with permission from Springer Nature, copyright 1988. | ||
Based on the collective behavior of DNA LC in stable (metastable) states, people have tried to understand the interplay between their self-assembling behavior and evaporation-induced condensation. As mentioned in the introduction, the DNA chains were just stretched by the receding force of the contact line and deposited on the substrate in the drying process of the diluted DNA solution (Fig. 6a and b).20,21,70 However, the evaporation of the concentrated solution is quite different from the diluted case because the initial concentration is high enough to induce the LC phase transition, in which the chains show collective behavior before thoroughly dehydrating.
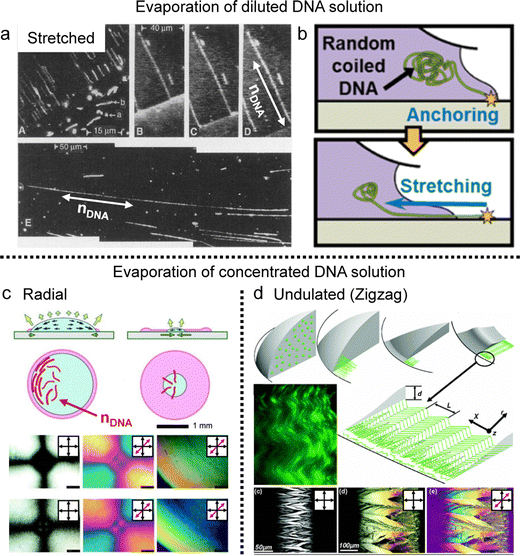 | ||
| Fig. 6 Concentration-dependent DNA alignment in the deposited film. (a) The DNA chains deposited by drop-casting of diluted DNA solution. nDNA represents the long axis of DNA molecules and the fluorescent dye-stained DNA chains are stretched along the contact line moving direction. (b) Schematic illustration of DNA chain extension in the drying process. (c) and (d) Self-assembly process and anisotropic structures of DNA chains in the deposited film. Red and light green lines in the illustration present the DNA molecules. (a) Reproduced from ref. 20 with permission from Science, copyright 1994. (b) Reproduced from ref. 70 with permission from American Chemical Society, copyright 2015. (c) Reproduced from ref. 22 with permission from John Wiley and Sons, copyright 2005. (d) Reproduced from ref. 42 with permission from American Physical Society, copyright 2006. | ||
Indeed, Morii et al. discovered, for the first time to my knowledge, the annular alignment of salmon sperm DNA chains in a drop-casting process (Fig. 6c).22 They analyzed the DNA alignment in the deposited film as a function of the distance from the center of the circular film. They found different structures depending on the initial concentration and temperature, one of which is orthogonal, with most molecular alignments being concentric but a small region near the center of the droplet being radially aligned. Based on the real-time observation, they proposed a possible mechanism for the chain orientation driven by a transitive balance of physical effects between the hydrodynamic forces and the Brownian motion of the chain segments. They found that an appropriate concentration to ensure mass diffusion and phase transition is essential and that highly dilute DNA solutions are unsuitable for forming oriented membranes.
Aligning to the above, Smalyukh et al. found a periodic zigzag structure in a ring-shaped deposit from DNA dry droplets (Fig. 6d).42 In this study, Lambda-DNA, with 48![[thin space (1/6-em)]](https://www.rsc.org/images/entities/char_2009.gif) 502 bp, shows a lyotropic liquid crystal around the contact line and aligns parallel to the boundary to minimize elastic energy. However, upon depinning, the radial dilative stress induces undulations at the rim, propagating inward through the columnar liquid crystal. They describe the structure formation through a model based on Frank–Oseen elastic energy with experimental results. The chain flexibility (l/p > 300) higher than the precedents might affect the formation of the micron-scale structure under the contact line receding force, not aligned parallel to the contact line.
502 bp, shows a lyotropic liquid crystal around the contact line and aligns parallel to the boundary to minimize elastic energy. However, upon depinning, the radial dilative stress induces undulations at the rim, propagating inward through the columnar liquid crystal. They describe the structure formation through a model based on Frank–Oseen elastic energy with experimental results. The chain flexibility (l/p > 300) higher than the precedents might affect the formation of the micron-scale structure under the contact line receding force, not aligned parallel to the contact line.
Inspired by the pioneering works above, we have developed to fabricate periodic DNA microstructures in a long-range order (Fig. 7).71–74 The brushing method allows reproducing the phenomenon by grooving the solution interface, which induces competitive interaction between compressive stress and DNA liquid crystal elasticity (Fig. 7a).71 The line defects were induced by buckling instability of the columnar liquid crystal, and systematically studied the dimensional tunability along the width and depth of the micro-sized template. A solution coating process has been introduced to induce from uniaxial alignment to orthogonal orientation by controlling the moving velocity of the coating plate.72 The combination with topographic templates could give a spatial confinement effect to the liquid crystal and deform the interfacial curvature of the solution (Fig. 7b and c).73,74 The structural anisotropy can then be transferred, internally and externally, e.g., to an alignment layer, facilitating the alignment of nanomaterials on a surface or to a directional matrix, enabling their orientation within a mixture.
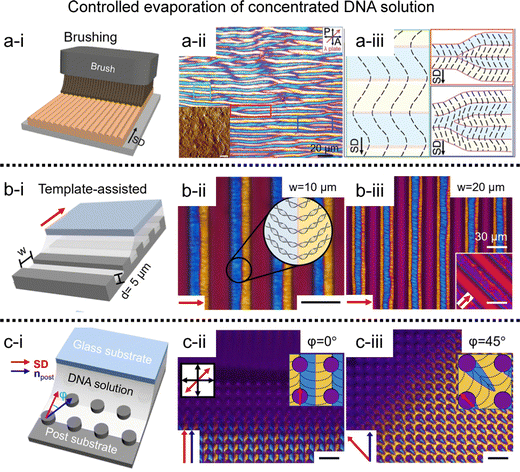 | ||
| Fig. 7 Two-dimensional DNA LC structure. (a) Undulated zig-zag pattern in the brushed DNA film. (i) Schematic illustrations of the fabrication process, and (ii) and (iii) POM images and descriptions for DNA alignment. (b) and (c) Micro-sized periodic DNA structure on topographic templates; (b) microchannels, and (c) microposts. Black and red arrows represent the shear direction (SD), and black scale bars are 20 μm. (a) Reproduced from ref. 71 with permission from John Wiley and Sons, copyright 2017. (b) Reproduced from ref. 74 with permission from John Wiley and Sons, copyright 2020. (c) Reproduced from ref. 73 with permission from Springer Nature, copyright 2019. | ||
3.2. Nanocellulose
Cellulose, the most abundant biopolymer on our planet, is present in plants, marine environments, and products of bacteria.75,76 The fibres of cellulose can be broken into controllable nanoscale building blocks called cellulose nanocrystals (CNCs) (Fig. 8a). These cellulose components, originating from renewable materials, possess not only eco-friendly benefits but also distinctive practical interest due to their various functional properties such as mechanical strength, optical and thermal properties.77–80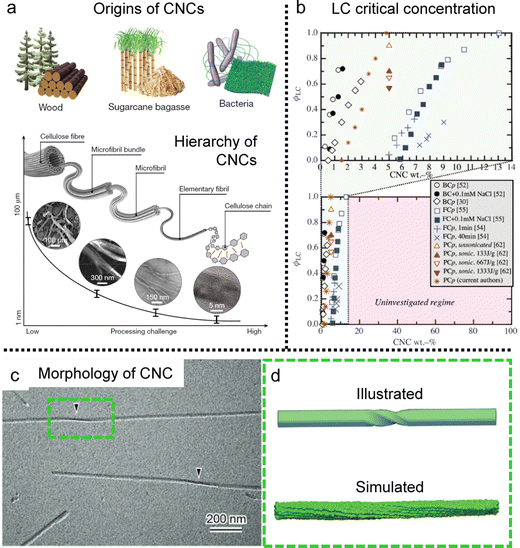 | ||
| Fig. 8 Cellulose nanocrystal (CNC) building blocks. (a) The examples of origins of CNCs and the various length scales of CNCs depending on the fabrication process. (b) Liquid crystal phase transition diagram of CNCs depending on the origins and concentrations (BC: bacterial cellulose, FC: filter paper-derived cellulose, PC: wood pulp-derived cellulose, and the suffix p: pure without any additives). (c) CryoEM image of single CNCs. The black arrowheads point the twisted region. (d) Schematic illustration of the twisted morphology of single CNCs and simulated one showing right handedness based on molecular dynamics. (a) Is reproduced from ref. 76 with permission from Springer Nature, copyright 2021. (b) Reproduced from ref. 75 with permission from Springer Nature, copyright 2014. (c) and (d) Reproduced from ref. 78 with permission from Royal Society of Chemistry, copyright 2019. | ||
It is well-known that CNCs have the ability to self-assemble into a helical structure, which is referred to as chiral nematic or cholesteric phases (Fig. 8b) based on the twisting morphology of a single nanocrystal (Fig. 8c and d).75,76,81,82 Such a hierarchical structure in the CNC matrix contributes to an iridescent color based on the periodicity of the refractive index (Bragg reflection), and researchers have tried to tune the pitch and tactoid formation to enhance their chiral optical activities.83–86 Although much progress has been made with much effort, in this section, we will only discuss the unwind nematic order of CNCs induced by hydrodynamic flow and refer interested readers to the above available literature describing these cholesteric systems.
When drying sessile CNC dispersion droplets on the flat substrate, in-plane multiaxial alignment was found in the deposited film where the local director of CNCs is uniaxially aligned (Fig. 9a).87 Pritchard et al. monitored the drying process in real-time through polarized optical microscopy (POM) and analyzed the drying dynamics using computational fluid dynamics. They utilized the Peclet number, a parameter comparing solute Brownian motion to capillary flow, to validate the dominant factor behind the sequential alignment of CNCs. They found that contact line behavior dominates the orthogonal alignment of CNCs in the deposition and studied various morphologies changing the initial concentration, surface wettability, and droplet volume. Also, there is another suggestion for the CNC alignment based on surface tension gradient-induced torque near the substrate–liquid–air interfaces.88 The torque due to the surface tension getting higher close to the contact line rotates the CNCs perpendicular to the direction of the receding lines and parallels them to the solution boundary layer that matches with the behavior of splay relaxation.
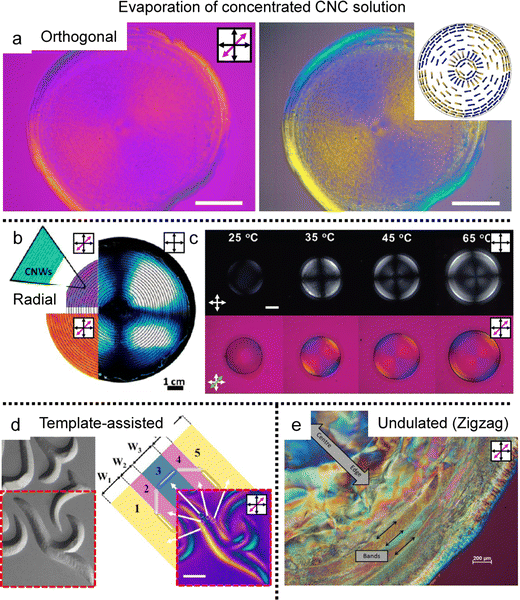 | ||
| Fig. 9 Multiple morphologies of CNCs in the deposited film. (a) Orthogonal alignment in the dried sessile droplet. The right images were enhanced to highlight the blue and yellow regions which are indicative of CNC alignment. (b) and (c) Circular alignment of the CNCs in the deposited film induced by (b) additives and (c) surface modification. (d) Template-assisted two-dimensional structure of the CNCs and (e) cholesteric-induced periodic band structure. (a) Reproduced from ref. 87 with permission from Elsevier, copyright 2021. (b) Reproduced from ref. 88 with permission from American Chemical Society, copyright 2014. (c) Reproduced from ref. 92 with permission from John Wiley and Sons, copyright 2021. (d) Reproduced from ref. 89 with permission from American Chemical Society, copyright 2019. (e) Reproduced from ref. 23 with permission from MDPI, copyright 2015. | ||
To induce uniform alignment in the circular deposited film, researchers controlled the experimental systems via (i) the introduction of additives ref. 88–91 and (ii) surface modification using chemical treatment (acid hydrolysis) (Fig. 9b and c).92,93
Based on the strategies for circular alignment, topographical templates are introduced to make a two-dimensional structure in the CNC deposited film (Fig. 9d).93 The CNCs–PVA composite could be designed as a beautiful structure based on controlling the surface tension gradient on the embossed pattern. The M-CNCs forming the full concentric alignment in the sessile droplet formed various structures that the contact lines fixed by the template determine the alignment of the M-CNCs, which induces surface tension gradients depending on their shape. The demonstration suggested the possibility of tuning the birefringence pattern by changing the template's shape from symmetrical to asymmetrical and the array structure.
Last, Gray et al. initially found different alignments of CNC films in sessile droplet deposits (Fig. 9e).24 They observed that fingerprint textures can be distorted by the flow of CNC liquid crystals in capillaries and found concentric alignments, helicoidal, and chiral multi-domain structures depending on the initial concentration and evaporation rate of the CNC dispersion. In particular, one kind of multi-domain, periodic radial band texture could be obtained by the distorted cholesteric phase of CNC. And they suggest that stick-and-slip behavior could also appear due to the anisotropic shrinkage of liquid crystals. Interestingly, the thickness difference induced by the stick-and-slip behavior was consistent with the half-pitch of the cholesteric phase. The researchers noted that their model was an oversimplification but significant in that they found a distorted fingerprint texture in the deposition process.
3.3. Protein amyloid
Amyloid fibrils are anisotropic colloids formed by self-assembly of peptide β-sheet aggregates into twisted and helical ribbons,94,95 which have been intensely investigated in biology and medicine due to their relationship with pathological conditions such as age-related dementia (Fig. 10a).96–98 The fibrillated proteins based on the amyloid core structure have recently been discovered at the origin of biological functionality in a remarkably diverse set of roles based on the unique properties and rich chemistry of peptides.99,100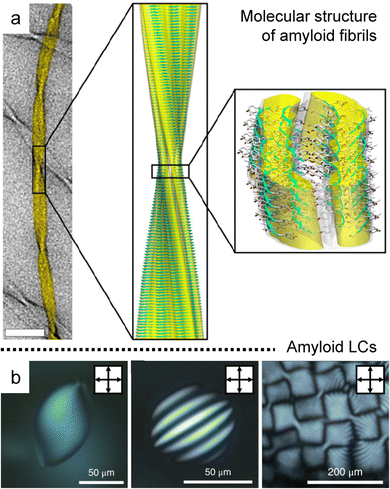 | ||
| Fig. 10 Hierarchical anisotropy of protein amyloids. (a) Molecular structure of amyloid fibrils (b) a series of POM images in concentrated dispersion of amyloids; homogeneous nematic tactoid (left), uniaxial cholesteric tactoid (middle), and cholesteric focal conic domains (right). (a) Reproduced from ref. 94 with permission from The National Academy of Sciences, copyright 2013. (b) Reproduced from ref. 102 with permission from Springer Nature, copyright 2018. | ||
The rod-like shape with the one-sided handedness induces isotropic to liquid crystal phase transition that can be well described by the Onsager theory extended to the charged and semiflexible polymers, where modifying the system makes rich behavior in the concentrated solution (Fig. 10b).26,101–103 In particular, Mezzenga et al. discovered the formation of tactoids along a concentration gradient, such as homogeneous, bipolar, and cholesteric ones, and analyzed the order and orientation transition in a confinement effect and hydrodynamic system with a support of theoretical estimation.104–107
For example, Almohammadi et al. investigated the liquid–liquid crystalline phase separation of aqueous filamentous colloids (here, beta-lactoglobulin amyloid fibrils) during droplet evaporation (Fig. 11a).108 They demonstrated that two phase transitions occur with increasing concentration: nucleation and growth and spinodal decomposition where they also discovered the structural changes and dynamics of the tactoids in a hydrodynamic system. The amyloid alignment in the deposited films lacked macroscopic uniformity but retained hierarchical structures such as microscopic fingerprint textures and parabolic focal conic domains. It is similar to the CNCs’ collective behavior in the drying process, including tactoid fusion close to the contact line with sliding instability or parabolic multi-domains in slow evaporation.
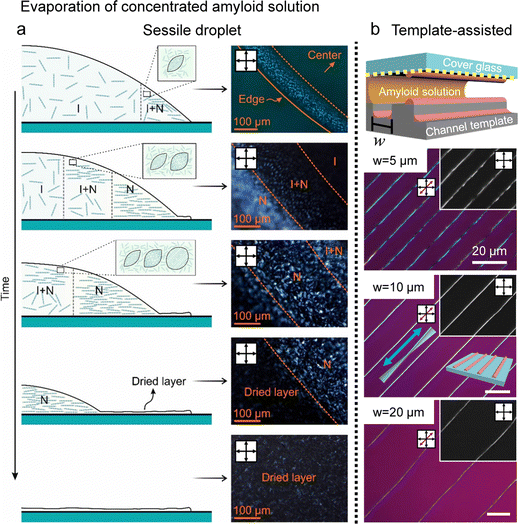 | ||
| Fig. 11 Drying and deposition processes of the amyloid fibrils (a) real-time observation of the drying process of amyloid sessile droplets. (b) Hierarchical structure of amyloid fibrils induced by the microchannel template. White bars represent 20 μm. (a) Reproduced from ref. 108 with permission from American Chemical Society, copyright 2023. (b) Reproduced from ref. 109 with permission from American Chemical Society, copyright 2021. | ||
Our group reported, in collaboration with Mezzenga's group, the fabrication of a hierarchical structure of protein amyloids with the property of minimizing liquid crystal elastic energy in the vicinity of contact lines and a template capable of inducing stick-and-slip motion (Fig. 11b).109 The filamentous protein amyloids self-assembled, while the contact line was pinned to form a macroscopic fibre structure, aligned parallel to the contact line, with micrometre-scale gaps along the edges that could be next pinned. A series of time-lapse POM images characterised the self-assembly process to elucidate the formation mechanism, and the structures' dimensions could also be controlled by adjusting the spacing of the templates.
3.4. Filamentous virus
The basic principles governing the isotropic-to-nematic phase transition in hard rods were established in the 1940s, focusing on the interplay of the aspect ratio and concentration.35 In general, the properties of biopolymers are more complex than those of theoretical models, for example, due to flexibility and surface charge. However, Ff phages, a group of filamentous bacteriophage, have filled the gap with their molecular properties. For example, M13 phages have a contour length of 880 nm and a diameter of 6.6 nm, and their aspect ratio aligns with the Onsager criteria (L/D > 100) (Fig. 12a).110 And the phages maintain the uniform conformation of length, topography, and chemical composition, yielding remarkably consistent suspensions. The capacity for tunability via chemical and biological methods enables systematic manipulation of interaction potentials,111 rendering these models exceptionally effective for comprehending and designing liquid crystals. Consequently, these models facilitate direct quantitative comparisons with theoretical predictions, thereby facilitating investigations into intricate LC phases.112–117 Noteworthy is the profound influence of molecular-level chirality on the self-assembly process within concentrated solutions. Leveraging insights, such as the formation of a helicoidal structure involving approximately 2700 copies of a single peptide and a fivefold rotation axis, researchers strive to comprehensively explore the origin and behavior of chiral mesophases, including cholesteric and chiral smectic C phases (Fig. 12b and c). The intricate relationship between microscopic and macroscopic chirality, encompassing factors like handedness and pitch, remains an ongoing focus of research, crucial for achieving a comprehensive understanding of colloidal liquid crystals.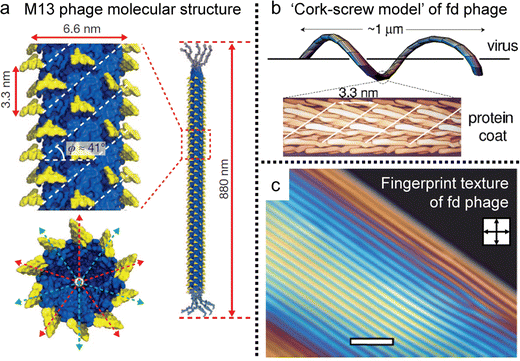 | ||
| Fig. 12 Filamentous bacteriophages and their anisotropy. (a) Molecular structure of the M13 bacteriophage. (b) Schematic illustration of ‘cork-screw model’ of fd virus. (c) Cholesteric phase of concentrated viral solution exhibiting fingerprint texture under POM. (a) Reproduced from ref. 120 with permission from Springer Nature, copyright 2011. (b) Reproduced from ref. 115 with permission from American Physical Society, copyright 2003. (c) Reproduced from ref. 117 with permission from Royal Society of Chemistry, copyright 2009. | ||
Professor Belcher and Lee are pioneering researchers who have significantly contributed to fabricating functional materials using evaporation-induced self-assembly involving viral films.118 Among their key findings, they have observed the formation of liquid crystal structures ranging from nematic to chiral smectic C, dependent on concentration and thickness variations.119 At higher initial concentrations, the mono-dispersity of the bacteriophage led to the formation of helical bundles with a smectic-based long-range order, which is directly reflected in the film as a periodic zigzag structure. The authors attributed this phenomenon to the dominant effect of expressing chiral liquid crystal structures over the interfacial effect. AFM and laser diffraction pattern results with POM supported their assertion.
Furthermore, the investigation by Lee and colleagues delved into the intricate interplay between environmental parameters and the kinetics governing the conversion of helical macromolecules into higher-ordered structures via a dip-coating process.120,121 They explored the applicability of these factors for regulating assembly under controlled experimental conditions. Their study revealed that the formation of sub-micrometre-scale structures originated from the spontaneous transitions within liquid crystal dynamics, coupled with distinctive chiral characteristics, including nematic orthogonal twist, cholesteric helical ribbon, and smectic helicoidal nanofilament (Fig. 13). Examining at the microscale, the establishment of ordered configurations were closely tied to the geometric constraints such as curved menisci, along with the periodic modulation of material flow. By manipulating meniscus motion, they materialized the large-scale ordered film as a functional material. Moreover, by fine-tuning coating parameters within the self-assembly process, they successfully produced a diverse array of nanostructures on a large scale.122 This achievement was facilitated by manipulating interparticle interactions contingent upon the concentration of additive ions. Adjustments to thermodynamic parameters resulted in distinctive undulations in the transient meniscus curve, leading to a hierarchical dotted pattern. Notably, the periodic alteration of coating speed, a pivot of kinetic factor, governed the formation of periodic dots within this pattern. Building on the groundwork, our group explored collective behaviors in non-equilibrium systems.123 We focused on understanding the interplay between liquid crystal phase transition near the solution contact line and the resulting M13 film morphologies. Through multiple viewpoints of microscopic analysis, we directly visualized the presence of liquid crystal three-dimensional structures in the deposited films. We also involved the rheological and hydrodynamic analysis, revealing the competition between the liquid crystal elasticity and the capillary flows in forming hierarchical structures. Our work holds significance in optimizing experimental conditions for precise ordering and orientation of chiral filamentous colloids. By delving into the dynamics of non-equilibrium systems, we contribute to understanding intricate processes in this field.
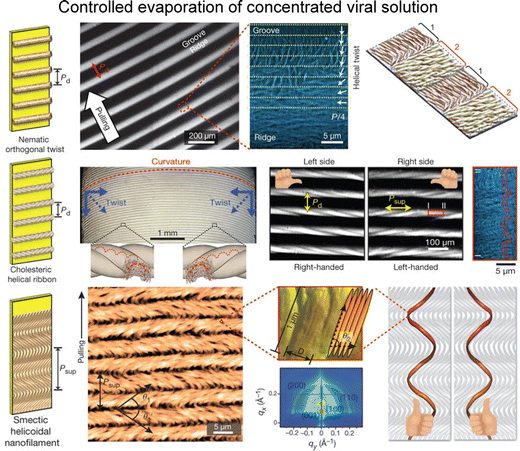 | ||
| Fig. 13 Filamentous bacteriophage self-assembly. Film morphologies of M13 bacteriophage films; nematic orthogonal twist (first row), cholesteric helical ribbon (second row), and smectic helicoidal nanofilament (third row). The figure is reproduced from ref. 120 with permission from Springer Nature, copyright 2011. | ||
3.5. Collagen fibril
In biological tissues, collagen fibrils are found in a highly concentrated state within the organic matrix of skeletal structures (Fig. 14a).124–126 These fibrils endow specific properties, such as mechanical resistance in bones and tendons and transparency in the cornea.127,128 The challenges in investigating these distinct properties within our tissues are rooted not only in the inherent attributes of the fibrils themselves but also in the hierarchical structure, spanning from the nanoscale to the microstructural level.129 This spontaneous organization of well-ordered structures in diverse collagen matrices exhibits notable analogies to the liquid crystal ordering in the concentrated collagen solutions (Fig. 14b).54,130–133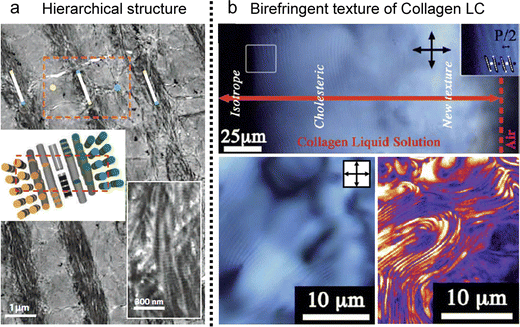 | ||
| Fig. 14 Collagen LC structures. (a) Demineralized osteon in human compact bone (b) cholesteric fingerprint texture of collagen LCs in POM and a second harmonic generation microscope. (a) Reproduced from ref. 132 with permission from Springer Nature, copyright 2012. (b) Reproduced from ref. 120 with permission from Royal Society of Chemistry, copyright 2011. | ||
The synthesis of collagen fibrils occurs within the cells, yielding three polypeptide chains that intertwin into an elongated,134 semi-flexible triple helix with a diameter of 1.5 nm and a length of 300 nm. Due to the high aspect ratio, they presented lyotropic liquid crystal characteristics manifesting birefringent textures known as fingerprints above certain concentrations.125,128,131 Early observations of these mesoscopic phases have been systematically clarified through joint endeavors by biologists and physicists aiming to quantitatively characterize collagen phase diagrams changing factors such as contour length, pH, ionic strength, solvent composition, and additives.131 This foundational understanding has paved the way to modulate the long-range organization of collagen, enabling the establishment of uniaxial fibril orientations in tendons and layered orthogonal alignment in bone and the cornea and bridging the gap between in vitro findings and living tissues.
Trials to fabricate a biomimetic structure have been initiated since the 1980s through evaporating droplets containing collagen solutions (Fig. 15).25,135–138 The surface morphologies of the resulting films are also quite similar in nature, and the researchers have analysed several key factors, including the initial concentration of the solution, as well as the dimensions (diameter and length) of the fibrils and the rate of evaporation. For instance, Maeda conducted investigations utilizing techniques such as atomic force microscopy and polarized light microscopy (Fig. 15a).135 This study highlighted the presence of a critical concentration threshold for nanoscale self-assembly. At concentrations below 0.005 mg mL−1, collagen fibrils exhibited a random configuration on the mica substrate due to their inherent flexibility. However, as the initial concentration exceeded 0.05 mg ml−1, these fibrils adopted a distinctive wavy crimp morphology characterized by periodic blue and yellow bands in polarized light microscopy. Within each band, the fibrils are uniaxially aligned and, at certain points, present interlocking and translational dislocation of these bands in the formation of concentric ring patterns.
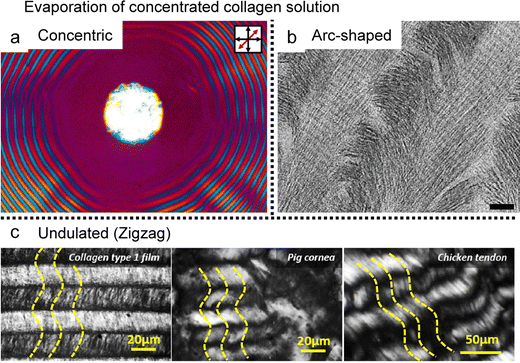 | ||
| Fig. 15 Evaporation-induced self-assembly of collagen type 1. (a) Concentric ring pattern, (b) periodic arc-shaped, and (c) tissue-like ordered fibrillar network in the deposited collagen film. Yellow dashed lines represent the director of collagen. (a) Reproduced from ref. 135 with permission from American Chemical Society, copyright 1999. (b) Reproduced from ref. 24 with permission from Elsevier, copyright 2008. (c) Reproduced from ref. 138 with permission from American Chemical Society, copyright 2016. | ||
Moreover, the diameter of the fibrils emerged as another crucial determinant of morphologies that varied based on solution pH (controlled by acetic acid) and the specific collagen types formed through natural fibrillogenesis.137 These phenomena indirectly support the notion that the established collagen structures originated from liquid crystal-mediated self-assembly.131 The application of a solution coating technique greatly enhanced the uniformity of the aligned collagen fibril network (Fig. 15b and c).25,138 By precisely manipulating external variables, researchers successfully achieved a structure analogous to human connective tissue. The resultant structures, driven by liquid crystals, featured diverse hierarchical levels, such as the periodicity of the twisted plywood structure, upon the specific conditions applied.
Furthermore, professor Rey's group embarked on a theoretical exploration of the chiral self-assembly mechanism inherent to collagen I within a non-equilibrium system grounded in relaxation and transport principles.139,140 The investigation demonstrated the pivotal role played by the simultaneous integration of isotropic-cholesteric phase ordering and anisotropic solvent transport in forming the helicoidal plywood structure. By simulating a biomimetic deposition process followed by controlled drying, it will be possible to finely regulate the hierarchical dimensions of the collagen structure.
4. Potential for practical applications
The alignment of building blocks in the deposited film can impart anisotropic characteristics to other materials, influenced by the surface morphology and the excluded volume effect of additives. We will now present two illustrative applications of biopolymeric films: (i) as an alignment layer (Fig. 16) and (ii) as an anisotropic matrix (Fig. 17 and 18).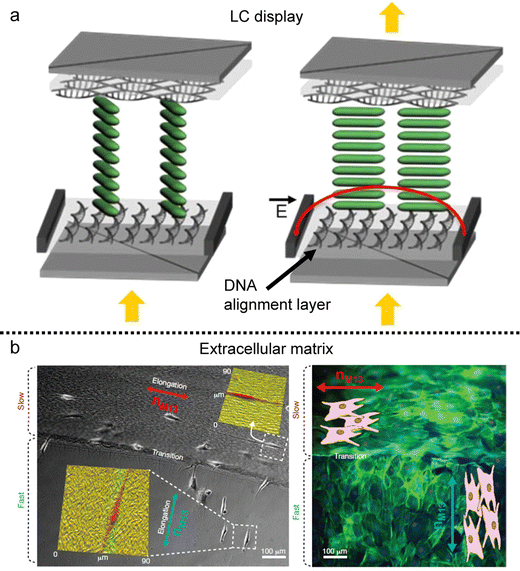 | ||
| Fig. 16 Anisotropy transfer on the deposited film. (a) In-plane switching LC display using the DNA alignment layer. (b) Preosteoblast cell alignment on the mineralized bacteriophage film. nM13 represents the direction of M13 bacteriophages. (a) Reproduced from ref. 145 with permission from American Chemical Society, copyright 2015. (b) Reproduced from ref. 120 with permission from Springer Nature, copyright 2011. | ||
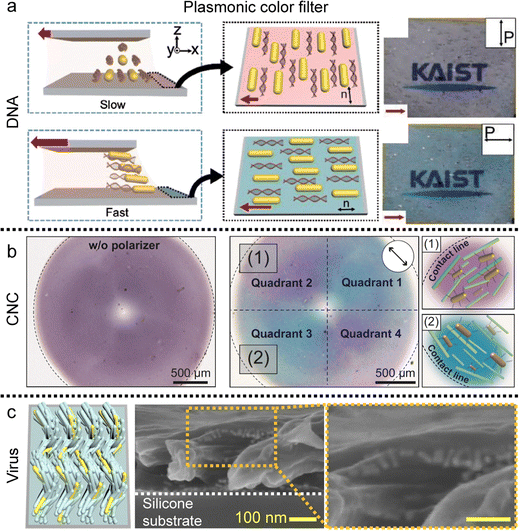 | ||
| Fig. 17 Alignment of metal nanorods in the anisotropic matrix. (a) Uniaxial gold nanorod arrangement in the DNA matrix and (b) concentric alignment of nanorods in the circular CNC film. Plasmonic color is changed by the direction of the single polarizer. (c) Helicoidal nanorod alignment in the viral film. (a) Reproduced from ref. 72 with permission from John Wiley and Sons, copyright 2017. (b) Reproduced from ref. 91 with permission from Springer Nature, copyright 2023. (c) Reproduced from ref. 123 with permission from John Wiley and Sons, copyright 2021. | ||
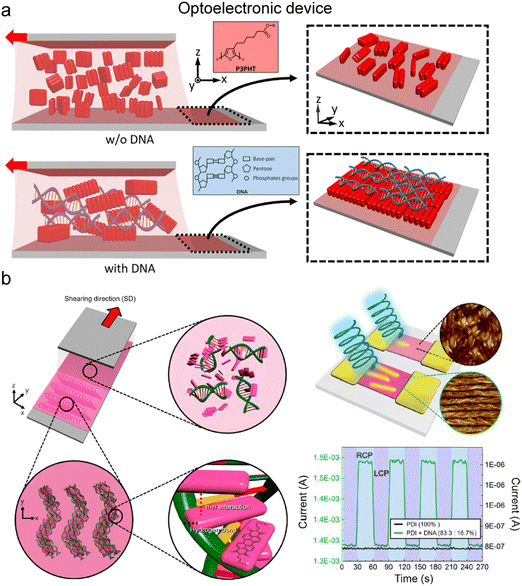 | ||
| Fig. 18 Control of electron transfer in the aligned matrix. (a) Enhancement of conducting polymer alignment by mixing with DNA. In the illustration, red blocks represent the conducting polymer, P3PHT, that is poly[3-(potassium-7-hexanoate)-thiophene-2,5-diyl]. (b) Helicoidal DNA-conjugated molecule composites and their chiral optoelectrical activity. (a) Reproduced from ref. 153 with permission from American Chemical Society, copyright 2020. (b) Reproduced from ref. 154 with permission from American Chemical Society, copyright 2021. | ||
4.1. On the film: alignment layer
An alignment layer serves the purpose of inducing uniform and planar alignment of anisotropic entities such as molecules, polymer chains, inorganic rod-like particles, and even living matter near the surface. Its role is to exert control over the orientation and arrangement of these entities, enabling users to tailor their properties on the substrate. Various mechanisms drive alignment layers, including surface roughness, geometrical confinement, and chemical heterogeneity.141,142 In this context, films produced using anisotropic biopolymers find application as alignment layers based on the anisotropy of those factors.Similar to other alignment layers, these biopolymeric films not only align materials following the director on the deposited film but also induce tilted alignment based on molecular characteristics. For instance, DNA, with its ability to induce tilted alignment relative to the long axis of its chains,143 can serve as an alignment layer for thermotropic liquid crystals (Fig. 16a).144,145 The DNA LC solution is coatable and can be applied as the alignment layer without a rubbing process due to the grooves in the chains. Sandwiched cells composed of a DNA alignment layer and thermotropic LCs could be employed in twisted-nematic and in-plane switching displays.
Furthermore, biomolecular alignment layers extend beyond nanomaterials, finding utility in cell alignment and tissue engineering due to their inherent biocompatibility (Fig. 17b). The layers immobilized by chemical treatment can be applied to an extracellular matrix that can align cellular structures on the surface.120,138 These templates introduce anisotropic mechanical stresses during cellular differentiation and migration processes, and precise control over surface grooves via coating processes enables diverse cell alignments on dried films. The controllability based on LC elastic behavior would provide various topographic bio-templates for tissue scaffolding.
4.2. In the film: anisotropic matrix
The fluidity of liquid crystals enables them to function as solvents when mixed with additives, while their crystalline nature imparts directional alignment to these additives. This alignment in the liquid crystal medium is primarily driven by entropic steric interactions, which seek to maximize translational entropy at the expense of rotational entropy, a phenomenon initially described by Onsager.35,146 The excluded volume effect, which tends to increase the effective volume of building blocks, not only facilitates the development of liquid crystal phases in concentrated solutions but also induces uniaxial alignment of the solutes along the local director of liquid crystals. The orientational ordering of solutes becomes arrested in the film after drying.These findings demonstrate that co-dispersions allow for the alignment of nanorods with relatively small aspect ratios, which cannot spontaneously form ordered liquid crystal structures independently.147–150 These nanorods are of particular interest due to their high surface-to-volume ratio and their responsiveness to optical, chemical, and electrical stimuli in an anisotropic manner.151,152 Gold nanorods (GNRs), one of the examples, dispersed in a DNA solution exhibit various nematic-like ordering along with the local director of DNA chains (Fig. 17a).73,74 The resulting DNA-GNR composite film displays polarization-dependent extinction colors based on localized surface plasmon resonance (LSPR). Additionally, the absorption spectrum of the films reveals that the longitudinal SPR peak is pronounced when the linearly polarized light aligns with the long axis of GNRs, whereas it becomes minimal when the polarizer is perpendicular. If the absorbance, including both longitudinal and transverse, is in the visible light range, the transmissive/reflective color can vary depending on the polarizer's angle.
Moreover, the GNRs formed a concentric pattern along the orientation of the CNCs in the deposited film. The GNRs dispersed in the CNCs are drop-cast on the flat substrate and the circular CNC-GNR film exhibited quadrant pattern under a single polarizer consisting of purple and blue colors along the orientation of the GNRs (Fig. 17b).91
Not only the two-dimensional structure, but the nanorods also form three-dimensional structures in the medium of chiral-induced liquid crystals (Fig. 17c).123 Within viral films, nanorods form helicoidal structures, exhibiting axis-symmetric rotation with a specific azimuthal angle. This may serve as a coatable plasmonic optical filter with circular dichroism as the result of collective linear polarization effects.
Directional alignment within an anisotropic matrix also governs electrical properties. Water-soluble modifications of conducting polymers yield anisotropic structures when incorporated into a biopolymer medium during deposition, induced by controlled nucleation and growth, or during the drying process through phase separation (Fig. 18).153,154 Thiophene-based polymers engage in dipole–dipole interactions with DNA phosphate groups and align under the DNA layer due to the molecular grooves of DNA (Fig. 18a).153 The resulting composite demonstrates anisotropic electrical behavior in the part of an organic field-effect transistor (OFET), where electron or hole transport properties vary based on the interchain and intrachain direction. Furthermore, the electrical properties are regulated by the external optical stimuli in an anisotropic manner due to the aligned structure (Fig. 18b).154 Perylene-based molecules intercalate between DNA base pairs through π–π interactions and form a helical structure in the solution coating process. The deposited film selectively interacts with the circularly polarized light displaying an ON/OFF behavior in the OFET device. These examples underscore the significant potential for further research on the application of anisotropic transfer induced by co-dispersion, coupled with other material characteristics.
Conclusions
In this review, we have presented current research findings regarding the self-assembly phenomena and deposition process of anisotropic biopolymers and colloids induced by evaporation (Table 1). Based on the Onsager theory, anisotropic biomaterials exhibiting a liquid crystalline phase above a specific concentration undergo a phase transition to a liquid crystalline state during the solution's evaporation. The resulting liquid crystalline structure is then mirrored in the deposited film during the deposition process. To comprehend the mechanisms governing the formation of these structures driven by the liquid crystal phase within the film and to exercise control over them through the solution process, extensive experimentation involving the manipulation of various parameters was conducted. Our approach aimed to advance the understanding of the formation mechanism by employing theoretical foundations comprehending the flow characteristics in evaporating solutions, polymer rheology, and the elastic properties of liquid crystal materials. Furthermore, recent report suggests the initial steps for practical applications of anisotropic biopolymers as fundamental building blocks,170 aiming to enrich the material value of anisotropic biopolymers and unravel their distinctive behavior in confined, non-equilibrium systems.Conflicts of interest
There are no conflicts to declare.Acknowledgements
This work was supported by the National Research Foundation of Korea (NRF) grant funded by the Korean Government (MSIT) (RS-2023-00273025, 2021M3H4A3A01050378).Notes and references
- W. Brutsaert, Evaporation into the atmosphere: theory, history and applications, Springer Science & Business Media, 2013, vol. 1 Search PubMed.
- J. L. Monteith, Q.J.R. Meteorol. Soc., 1981, 107, 1–27 CrossRef.
- T. P. Bigioni, X.-M. Lin, T. T. Nguyen, E. I. Corwin, T. A. Witten and H. M. Jaeger, Nat. Mater., 2006, 5, 265–270 CrossRef CAS PubMed.
- Y. Diao, B. C.-K. Tee, G. Giri, J. Xu, D. H. Kim, H. A. Becerril, R. M. Stoltenberg, T. H. Lee, G. Xue, S. C. B. Mannsfeld and Z. Bao, Nat. Mater., 2013, 12, 665–671 CrossRef CAS PubMed.
- H. Kim, F. Boulogne, E. Um, I. Jacobi, E. Button and H. A. Stone, Phys. Rev. Lett., 2016, 116, 124501 CrossRef PubMed.
- W. Han and Z. Lin, Angew. Chem., Int. Ed., 2012, 51, 1534–1546 CrossRef CAS PubMed.
- D. J. Harris, H. Hu, J. C. Conrad and J. A. Lewis, Phys. Rev. Lett., 2007, 98, 148301 CrossRef PubMed.
- R. D. Deegan, O. Bakajin, T. F. Dupont, G. Huber, S. R. Nagel and T. A. Witten, Nature, 1997, 389, 827–829 CrossRef CAS.
- R. D. Deegan, O. Bakajin, T. F. Dupont, G. Huber, S. R. Nagel and T. A. Witten, Phys. Rev. E: Stat. Phys., Plasmas, Fluids, Relat. Interdiscip. Top., 2000, 62, 756–765 CrossRef CAS PubMed.
- D. Orejon, K. Sefiane and M. E. R. Shanahan, Langmuir, 2011, 27, 12834–12843 CrossRef CAS PubMed.
- S. Maheshwari, L. Zhang, Y. Zhu and H.-C. Chang, Phys. Rev. Lett., 2008, 100, 044503 CrossRef PubMed.
- P. J. Yunker, T. Still, M. A. Lohr and A. G. Yodh, Nature, 2011, 476, 308–311 CrossRef CAS PubMed.
- P. J. Sáenz, A. W. Wray, Z. Che, O. K. Matar, P. Valluri, J. Kim and K. Sefiane, Nat. Commun., 2017, 8, 14783 CrossRef PubMed.
- F. Girard, M. Antoni, S. Faure and A. Steinchen, Colloids Surf., A, 2008, 323, 36–49 CrossRef CAS.
- K. Uno, K. Hayashi, T. Hayashi, K. Ito and H. Kitano, Colloid Polym. Sci., 1998, 276, 810–815 CrossRef CAS.
- H. Hu and R. G. Larson, Langmuir, 2005, 21, 3972–3980 CrossRef CAS PubMed.
- Z. S. Davidson, Y. Huang, A. Gross, A. Martinez, T. Still, C. Zhou, P. J. Collings, R. D. Kamien and A. G. Yodh, Nat. Commun., 2017, 8, 15642 CrossRef CAS PubMed.
- A. D. Rey and E. E. Herrera-Valencia, Biopolymers, 2012, 97, 374–396 CrossRef CAS PubMed.
- I. W. Hamley, Soft Matter, 2010, 6, 1863–1871 RSC.
- A. Bensimon, A. Simon, A. Chiffaudel, V. Croquette, F. Heslot and D. Bensimon, Science, 1994, 265, 2096–2098 CrossRef CAS PubMed.
- D. Bensimon, A. J. Simon, V. Croquette and A. Bensimon, Phys. Rev. Lett., 1995, 74, 4754–4757 CrossRef CAS PubMed.
- N. Morii, G. Kido, H. Suzuki and H. Morii, Biopolymers, 2005, 77, 163–172 CrossRef CAS PubMed.
- D. G. Gray and X. Mu, Materials, 2015, 8, 7873–7888 CrossRef CAS PubMed.
- M.-M. Giraud-Guille, E. Belamie, G. Mosser, C. Helary, F. Gobeaux and S. Vigier, C. R. Chim, 2008, 11, 245–252 CrossRef CAS.
- G. Nyström and R. Mezzenga, Curr. Opin. Colloid Interface Sci., 2018, 38, 30–44 CrossRef.
- O. Reynolds, Philos. Trans. R. Soc. London, 1883, 174, 935–982 CrossRef.
- H. Gelderblom, C. Diddens and A. Marin, Soft Matter, 2022, 18, 8535–8553 RSC.
- A.-M. Cazabat and G. Guéna, Soft Matter, 2010, 6, 2591 RSC.
- M. He, B. Li, X. Cui, B. Jiang, Y. He, Y. Chen, D. O’Neil, P. Szymanski, M. A. EI-Sayed, J. Huang and Z. Lin, Nat. Commun., 2017, 8, 16045 CrossRef CAS PubMed.
- Y. Yu. Tarasevich, I. V. Vodolazskaya and O. P. Isakova, Colloid Polym. Sci., 2011, 289, 1015–1023 CrossRef.
- M. Le Berre, Y. Chen and D. Baigl, Langmuir, 2009, 25, 2554–2557 CrossRef CAS PubMed.
- G. Berteloot, C.-T. Pham, A. Daerr, F. Lequeux and L. Limat, Europhys. Lett., 2008, 83, 14003 CrossRef.
- X. Gu, L. Shaw, K. Gu, M. F. Toney and Z. Bao, Nat. Commun., 2018, 9, 534 CrossRef PubMed.
- L. Onsager, Ann. N.Y. Acad. Sci., 1949, 51, 627–659 CrossRef CAS.
- A. R. Khokhlov and A. N. Semenov, Physica A, 1981, 108, 546–556 CrossRef.
- S.-D. Lee and R. B. Meyer, Phys. Rev. Lett., 1988, 61, 2217–2220 CrossRef CAS PubMed.
- R. B. Meyer, F. Lonberg, V. Taratuta, S. Fraden, S.-D. Lee and A. J. Hurd, Faraday Discuss. Chem. Soc., 1985, 79, 125 RSC.
- T. Odijk, Macromolecules, 1986, 19, 2313–2329 CrossRef CAS.
- R. G. Priest, Phys. Rev. A, 1973, 7, 720–729 CrossRef.
- S. Onogi and T. Asada, in Rheology, ed. G. Astarita, G. Marrucci and L. Nicolais, Springer US, Boston, MA, 1980, pp. 127–147 Search PubMed.
- Flowing Matter, ed. F. Toschi and M. Sega, Springer International Publishing, Cham, 2019 Search PubMed.
- I. I. Smalyukh, O. V. Zribi, J. C. Butler, O. D. Lavrentovich and G. C. L. Wong, Phys. Rev. Lett., 2006, 96, 177801 CrossRef PubMed.
- S. Zhou, Yu. A. Nastishin, M. M. Omelchenko, L. Tortora, V. G. Nazarenko, O. P. Boiko, T. Ostapenko, T. Hu, C. C. Almasan, S. N. Sprunt, J. T. Gleeson and O. D. Lavrentovich, Phys. Rev. Lett., 2012, 109, 037801 CrossRef PubMed.
- S. Zhou, Lyotropic Chromonic Liquid Crystals, Springer International Publishing, Cham, 2017 Search PubMed.
- L. Lucchetti, T. P. Fraccia, G. Nava, T. Turiv, F. Ciciulla, L. Bethge, S. Klussmann, O. D. Lavrentovich and T. Bellini, ACS Macro Lett., 2020, 9, 1034–1039 CrossRef CAS PubMed.
- R. G. Larson and D. W. Mead, Liq. Cryst., 1993, 15, 151–169 CrossRef CAS.
- Y. J. Cha, M.-J. Gim, H. Ahn, T. J. Shin, J. Jeong and D. K. Yoon, ACS Appl. Mater. Interfaces, 2017, 9, 18355–18361 CrossRef CAS PubMed.
- F. Livolant, Physica A, 1991, 176, 117–137 CrossRef CAS.
- M. H. Chow, K. T. H. Yan, M. J. Bennett and J. T. Y. Wong, Eukaryot. Cell, 2010, 9, 1577–1587 CrossRef CAS PubMed.
- D. Frenkiel-Krispin, EMBO J., 2001, 20, 1184–1191 CrossRef CAS PubMed.
- R. L. Rill, F. Livolant, H. C. Aldrich and M. W. Davidson, Chromosoma, 1989, 98, 280–286 CrossRef CAS PubMed.
- P. Gouet, J. M. Diprose, J. M. Grimes, R. Malby, J. N. Burroughs, S. Zientara, D. I. Stuart and P. P. Mertens, Cell, 1999, 97, 481–490 CrossRef CAS PubMed.
- F. Livolant, Tissue Cell, 1984, 16, 535–555 CrossRef CAS PubMed.
- J. Roca, Chromosoma, 2011, 120, 323–334 CrossRef PubMed.
- M. T. J. Van Loenhout, M. V. De Grunt and C. Dekker, Science, 2012, 338, 94–97 CrossRef CAS PubMed.
- S. Jones, H. P. Shanahan, H. M. Berman and J. M. Thornton, Nucleic Acids Res., 2003, 31, 7189–7198 CrossRef CAS PubMed.
- H. Cedar and Y. Bergman, Nat. Rev. Genet., 2009, 10, 295–304 CrossRef CAS PubMed.
- A. Minsky, E. Shimoni and D. Frenkiel-Krispin, Nat. Rev. Mol. Cell Biol., 2002, 3, 50–60 CrossRef CAS PubMed.
- R. E. Franklin and R. G. Gosling, Nature, 1953, 171, 740–741 CrossRef CAS PubMed.
- J. D. Watson and F. H. Crick, Nature, 1953, 171, 737–738 CrossRef CAS PubMed.
- F. Livolant, A. M. Levelut, J. Doucet and J. P. Benoit, Nature, 1989, 339, 724–726 CrossRef CAS PubMed.
- R. L. Rill, Proc. Natl. Acad. Sci. U. S. A., 1986, 83, 342–346 CrossRef CAS PubMed.
- T. E. Strzelecka, M. W. Davidson and R. L. Rill, Nature, 1988, 331, 457–460 CrossRef CAS PubMed.
- P. J. Hagerman, Annu. Rev. Biophys. Biophys. Chem., 1988, 17, 265–286 CrossRef CAS PubMed.
- M. Nakata, G. Zanchetta, B. D. Chapman, C. D. Jones, J. O. Cross, R. Pindak, T. Bellini and N. A. Clark, Science, 2007, 318, 1276–1279 CrossRef CAS PubMed.
- E. S. Sobel and J. A. Harpst, Biopolymers, 1991, 31, 1559–1564 CrossRef CAS PubMed.
- S. B. Smith, L. Finzi and C. Bustamante, Science, 1992, 258, 1122–1126 CrossRef CAS PubMed.
- C. B. Stanley, H. Hong and H. H. Strey, Biophys. J., 2005, 89, 2552–2557 CrossRef CAS PubMed.
- F. Livolant and A. Leforestier, Prog. Polym. Sci., 1996, 21, 1115–1164 CrossRef CAS.
- S. H. Kang, W. S. Hwang, Z. Lin, S. H. Kwon and S. W. Hong, Nano Lett., 2015, 15, 7913–7920 CrossRef CAS PubMed.
- Y. J. Cha and D. K. Yoon, Adv. Mater., 2017, 29, 1604247 CrossRef PubMed.
- Y. J. Cha, D. S. Kim and D. K. Yoon, Adv. Funct. Mater., 2017, 27, 1703790 CrossRef.
- Y. J. Cha, S. M. Park, R. You, H. Kim and D. K. Yoon, Nat. Commun., 2019, 10, 2512 CrossRef PubMed.
- S. M. Park, G. Park, Y. J. Cha and D. K. Yoon, Small, 2020, 16, 2002449 CrossRef CAS PubMed.
- J. P. F. Lagerwall, C. Schütz, M. Salajkova, J. Noh, J. Hyun Park, G. Scalia and L. Bergström, NPG Asia Mater., 2014, 6, e80 CrossRef CAS.
- T. Li, C. Chen, A. H. Brozena, J. Y. Zhu, L. Xu, C. Driemeier, J. Dai, O. J. Rojas, A. Isogai, L. Wågberg and L. Hu, Nature, 2021, 590, 47–56 CrossRef CAS PubMed.
- I. I. Smalyukh, Adv. Mater., 2021, 33, 2001228 CrossRef CAS PubMed.
- S. J. Eichhorn, A. Etale, J. Wang, L. A. Berglund, Y. Li, Y. Cai, C. Chen, E. D. Cranston, M. A. Johns, Z. Fang, G. Li, L. Hu, M. Khandelwal, K.-Y. Lee, K. Oksman, S. Pinitsoontorn, F. Quero, A. Sebastian, M. M. Titirici, Z. Xu, S. Vignolini and B. Frka-Petesic, J. Mater. Sci., 2022, 57, 5697–5767 CrossRef CAS.
- D. Klemm, F. Kramer, S. Moritz, T. Lindström, M. Ankerfors, D. Gray and A. Dorris, Angew. Chem., Int. Ed., 2011, 50, 5438–5466 CrossRef CAS PubMed.
- E. Kontturi, P. Laaksonen, M. B. Linder Nonappa, A. H. Gröschel, O. J. Rojas and O. Ikkala, Adv. Mater., 2018, 30, 1703779 CrossRef PubMed.
- R. M. Parker, G. Guidetti, C. A. Williams, T. Zhao, A. Narkevicius, S. Vignolini and B. Frka-Petesic, Adv. Mater., 2018, 30, 1704477 CrossRef PubMed.
- Y. Ogawa, Nanoscale, 2019, 11, 21767 RSC.
- P.-X. Wang, W. Y. Hamad and M. J. MacLachlan, Nat. Commun., 2016, 7, 11515 CrossRef PubMed.
- Y. Geng, R. Kizhakidathazhath and J. P. Lagerwall, Nat. Mater., 2022, 21, 1441–1447 CrossRef CAS PubMed.
- B. E. Droguet, H.-L. Liang, B. Frka-Petesic, R. M. Parker, M. F. De Volder, J. J. Baumberg and S. Vignolini, Nat. Mater., 2022, 21, 352–358 CrossRef CAS PubMed.
- A. Tran, C. E. Boott and M. J. MacLachlan, Adv. Mater., 2020, 32, 1905876 CrossRef CAS PubMed.
- C. Q. Pritchard, F. Navarro, M. Roman and M. J. Bortner, J. Colloid Interface Sci., 2021, 603, 450–458 CrossRef CAS PubMed.
- M. Mashkour, T. Kimura, F. Kimura, M. Mashkour and M. Tajvidi, Biomacromolecules, 2014, 15, 60–65 CrossRef CAS PubMed.
- M. Mashkour, T. Kimura, M. Mashkour, F. Kimura and M. Tajvidi, ACS Appl. Mater. Interfaces, 2019, 11, 1538–1545 CrossRef CAS PubMed.
- M. Talantikite, N. Leray, S. Durand, C. Moreau and B. Cathala, J. Colloid Interface Sci., 2021, 587, 727–735 CrossRef CAS PubMed.
- J. Pyeon, S. M. Park, J. Kim, J.-H. Kim, Y.-J. Yoon, D. K. Yoon and H. Kim, Nat. Commun., 2023, 14, 8096 CrossRef CAS PubMed.
- R. Shao, X. Meng, Z. Shi, J. Zhong, Z. Cai, J. Hu, X. Wang, G. Chen, S. Gao, Y. Song and C. Ye, Small Methods, 2021, 5, 2100690 CrossRef CAS PubMed.
- H. Wang, R. Shao, X. Meng, Y. He, Z. Shi, Z. Guo and C. Ye, ACS Appl. Mater. Interfaces, 2022, 14, 36277–36286 CrossRef CAS PubMed.
- A. W. P. Fitzpatrick, G. T. Debelouchina, M. J. Bayro, D. K. Clare, M. A. Caporini, V. S. Bajaj, C. P. Jaroniec, L. Wang, V. Ladizhansky, S. A. Müller, C. E. MacPhee, C. A. Waudby, H. R. Mott, A. De Simone, T. P. J. Knowles, H. R. Saibil, M. Vendruscolo, E. V. Orlova, R. G. Griffin and C. M. Dobson, Proc. Natl. Acad. Sci. U. S. A., 2013, 110, 5468–5473 CrossRef CAS PubMed.
- M. G. Iadanza, M. P. Jackson, E. W. Hewitt, N. A. Ranson and S. E. Radford, Nat. Rev. Mol. Cell Biol., 2018, 19, 755–773 CrossRef CAS PubMed.
- F. Chiti and C. M. Dobson, Annu. Rev. Biochem., 2006, 75, 333–366 CrossRef CAS PubMed.
- D. Eisenberg and M. Jucker, Cell, 2012, 148, 1188–1203 CrossRef CAS PubMed.
- T. P. Knowles, M. Vendruscolo and C. M. Dobson, Nat. Rev. Mol. Cell Biol., 2014, 15, 384–396 CrossRef CAS PubMed.
- T. P. J. Knowles and R. Mezzenga, Adv. Mater., 2016, 28, 6546–6561 CrossRef CAS PubMed.
- P. C. Ke, R. Zhou, L. C. Serpell, R. Riek, T. P. J. Knowles, H. A. Lashuel, E. Gazit, I. W. Hamley, T. P. Davis, M. Fändrich, D. E. Otzen, M. R. Chapman, C. M. Dobson, D. S. Eisenberg and R. Mezzenga, Chem. Soc. Rev., 2020, 49, 5473–5509 RSC.
- A. M. Corrigan, C. Müller and M. R. H. Krebs, J. Am. Chem. Soc., 2006, 128, 14740–14741 CrossRef CAS PubMed.
- G. Nyström, M. Arcari and R. Mezzenga, Nat. Nanotechnol., 2018, 13, 330–336 CrossRef PubMed.
- M. Bagnani, G. Nyström, C. De Michele and R. Mezzenga, ACS Nano, 2019, 13, 591–600 CrossRef CAS PubMed.
- S. A. Khadem, M. Bagnani, R. Mezzenga and A. D. Rey, Nat. Commun., 2020, 11, 4616 CrossRef CAS PubMed.
- H. Almohammadi, M. Bagnani and R. Mezzenga, Nat. Commun., 2020, 11, 5416 CrossRef PubMed.
- H. Almohammadi, S. Martinek, Y. Yuan, P. Fischer and R. Mezzenga, Nat. Commun., 2023, 14, 607 CrossRef CAS PubMed.
- P. Azzari and R. Mezzenga, Phys. Rev. Res., 2023, 5, 013137 CrossRef CAS.
- H. Almohammadi, Y. Fu and R. Mezzenga, ACS Nano, 2023, 17, 3098–3106 CrossRef CAS PubMed.
- S. M. Park, M. Bagnani, H. S. Yun, M. J. Han, R. Mezzenga and D. K. Yoon, ACS Nano, 2021, 15, 20261–20266 CrossRef CAS PubMed.
- Soft Matter, ed. G. Gompper and M. Schick, Wiley-VCH Verlag GmbH & Co. KGaA, Weinheim, Germany, vol. 2, 2005 Search PubMed.
- S. Y. Yoo, W.-J. Chung and D.-Y. Lee, Int. J. Nanores., 2014, 5825 Search PubMed.
- Z. Dogic and S. Fraden, Phys. Rev. Lett., 1997, 78, 2417–2420 CrossRef CAS.
- L. C. Welsh, M. F. Symmons, C. Nave, R. N. Perham, E. A. Marseglia and D. A. Marvin, Macromolecules, 1996, 29, 7075–7083 CrossRef CAS.
- Z. Dogic and S. Fraden, Langmuir, 2000, 16, 7820–7824 CrossRef CAS.
- E. Grelet and S. Fraden, Phys. Rev. Lett., 2003, 90, 198302 CrossRef PubMed.
- Z. Zhang, N. Krishna, M. P. Lettinga, J. Vermant and E. Grelet, Langmuir, 2009, 25, 2437–2442 CrossRef CAS PubMed.
- E. Barry, D. Beller and Z. Dogic, Soft Matter, 2009, 5, 2563–2570 CAS.
- J. H. Lee, C. M. Warner, H.-E. Jin, E. Barnes, A. R. Poda, E. J. Perkins and S.-W. Lee, Nat. Protoc., 2017, 12, 1999–2013 CrossRef CAS PubMed.
- S.-W. Lee, B. M. Wood and A. M. Belcher, Langmuir, 2003, 19, 1592–1598 CrossRef CAS.
- W.-J. Chung, J.-W. Oh, K. Kwak, B. Y. Lee, J. Meyer, E. Wang, A. Hexemer and S.-W. Lee, Nature, 2011, 478, 364–368 CrossRef CAS PubMed.
- J.-W. Oh, W.-J. Chung, K. Heo, H.-E. Jin, B. Y. Lee, E. Wang, C. Zueger, W. Wong, J. Meyer, C. Kim, S.-Y. Lee, W.-G. Kim, M. Zemla, M. Auer, A. Hexemer and S.-W. Lee, Nat. Commun., 2014, 5, 3043 CrossRef PubMed.
- K. Heo, H.-E. Jin, H. Kim, J. H. Lee, E. Wang and S.-W. Lee, Nano Energy, 2019, 56, 716–723 CrossRef CAS.
- S. M. Park, W. Kim, J. Kim, E. Choi, H. Kim, J. Oh and D. K. Yoon, Small, 2021, 17, 2008097 CrossRef CAS PubMed.
- D. W. L. Hukins and J. Woodhead-galloway, Mol. Cryst. Liq. Cryst., 1977, 41, 33–39 CrossRef CAS.
- M.-M. Giraud-Guille, J. Mol. Biol., 1992, 224, 861–873 CrossRef CAS PubMed.
- F. Gobeaux, E. Belamie, G. Mosser, P. Davidson, P. Panine and M.-M. Giraud-Guille, Langmuir, 2007, 23, 6411–6417 CrossRef CAS PubMed.
- D. W. L. Hukins, J. Theo. Biol., 1978, 71, 661–667 CrossRef CAS PubMed.
- M. M. Giraud-Guille, G. Mosser and E. Belamie, Curr. Opin. Colloid Interface Sci., 2008, 13, 303–313 CrossRef CAS.
- C. Sanchez, H. Arribart and M. M. Giraud Guille, Nat. Mater., 2005, 4, 277–288 CrossRef CAS PubMed.
- M.-M. Giraud-guille, Mol. Cryst. Liq. Cryst., 1987, 153, 15–30 CAS.
- P. De Sa Peixoto, A. Deniset-Besseau, M.-C. Schanne-Klein and G. Mosser, Soft Matter, 2011, 7, 11203 RSC.
- Y. Wang, T. Azaïs, M. Robin, A. Vallée, C. Catania, P. Legriel, G. Pehau-Arnaudet, F. Babonneau, M.-M. Giraud-Guille and N. Nassif, Nat. Mater., 2012, 11, 724–733 CrossRef CAS PubMed.
- A. I. Brown, L. Kreplak and A. D. Rutenberg, Soft Matter, 2014, 10, 8500–8511 RSC.
- K. E. Kadler, D. F. Holmes, J. A. Trotter and J. A. Chapman, Biochem. J., 1996, 316, 1–11 CrossRef CAS PubMed.
- H. Maeda, Langmuir, 1999, 15, 8505–8513 CrossRef CAS.
- J. E. Kirkwood and G. G. Fuller, Langmuir, 2009, 25, 3200–3206 CrossRef CAS PubMed.
- L. Muthusubramaniam, L. Peng, T. Zaitseva, M. Paukshto, G. R. Martin and T. A. Desai, J. Biomed. Mater. Res., 2012, 100A, 613–621 CrossRef CAS PubMed.
- J. C. Price, P. Roach and A. J. El Haj, ACS Biomater. Sci. Eng., 2016, 2, 625–633 CrossRef CAS PubMed.
- O. F. Aguilar Gutierrez and A. D. Rey, Soft Matter, 2017, 13, 8076–8088 RSC.
- S. A. Khadem and A. D. Rey, Front. Phys., 2019, 7, 88 CrossRef.
- J. Hoogboom, T. Rasing, A. E. Rowan and R. J. M. Nolte, J. Mater. Chem., 2006, 16, 1305–1314 RSC.
- M. J. Shin and D. K. Yoon, Materials, 2020, 13, 5466 CrossRef CAS PubMed.
- M. Nakata, G. Zanchetta, M. Buscaglia, T. Bellini and N. A. Clark, Langmuir, 2008, 24, 10390–10394 CrossRef CAS PubMed.
- Y. J. Cha, M.-J. Gim, K. Oh and D. K. Yoon, J. Inf. Disp., 2015, 16, 129–135 CrossRef CAS.
- Y. J. Cha, M.-J. Gim, K. Oh and D. K. Yoon, ACS Appl. Mater. Interfaces, 2015, 7, 13627–13632 CrossRef CAS PubMed.
- Q. Liu, M. G. Campbell, J. S. Evans and I. I. Smalyukh, Adv. Mater., 2014, 26, 7178–7184 CrossRef CAS PubMed.
- A. Querejeta-Fernández, G. Chauve, M. Methot, J. Bouchard and E. Kumacheva, J. Am. Chem. Soc., 2014, 136, 4788–4793 CrossRef PubMed.
- J. V. Rie, G. González-Rubio, S. Kumar, C. Schütz, J. Kohlbrecher, M. Vanroelen, T. V. Gerven, O. Deschaume, C. Bartic, L. M. Liz-Marzán, G. Salazar-Alvarez and W. Thielemans, Chem. Commun., 2020, 56, 13001–13004 RSC.
- Z. Cheng, Y. Ma, L. Yang, F. Cheng, Z. Huang, A. Natan, H. Li, Y. Chen, D. Cao, Z. Huang, Y. Wang, Y. Liu, R. Yang and H. Zhu, Adv. Opt. Mater., 2019, 7, 1801816 CrossRef.
- Y. Yuan, H. Almohammadi, J. Probst and R. Mezzenga, Adv. Mater., 2021, 33, 2106155 CrossRef CAS PubMed.
- J. Pérez-Juste, I. Pastoriza-Santos, L. M. Liz-Marzán and P. Mulvaney, Coord. Chem. Rev., 2005, 249, 1870–1901 CrossRef.
- J. Gao, C. M. Bender and C. J. Murphy, Langmuir, 2003, 19, 9065–9070 CrossRef CAS.
- M. J. Han, M. McBride, B. Risteen, G. Zhang, B. V. Khau, E. Reichmanis and D. K. Yoon, Chem. Mater., 2020, 32, 688–696 CrossRef CAS.
- M. J. Han, H. S. Yun, Y. Cho, M. Kim, C. Yang, V. V. Tsukruk and D. K. Yoon, ACS Nano, 2021, 15, 20353–20363 CrossRef CAS PubMed.
- M. Chopra, L. Li, H. Hu, M. A. Burns and R. G. Larson, J. Rheol., 2003, 47, 1111–1132 CrossRef CAS.
- S. S. Abramchuk, A. R. Khokhlov, T. Iwataki, H. Oana and K. Yoshikawa, Europhys. Lett., 2001, 55, 294–300 CrossRef CAS.
- C. A. P. Petit and J. D. Carbeck, Nano Lett., 2003, 3, 1141–1146 CrossRef CAS.
- J. Guan and L. J. Lee, Proc. Natl. Acad. Sci. U. S. A., 2005, 102, 18321–18325 CrossRef CAS PubMed.
- H. Yokota, J. Sunwoo, M. Sarikaya, G. Van Den Engh and R. Aebersold, Anal. Chem., 1999, 71, 4418–4422 CrossRef CAS PubMed.
- B. Li, C. Zhang, B. Jiang, W. Han and Z. Lin, Angew. Chem., Int. Ed., 2015, 54, 4250–4254 CrossRef CAS PubMed.
- B. Zhang, J. Schmidtke and H. Kitzerow, Adv. Opt. Mater., 2019, 7, 1801766 CrossRef.
- S. M. Park, G. Park and D. K. Yoon, Adv. Mater., 2023, 2302135 CrossRef CAS PubMed.
- G. Picard, D. Simon, Y. Kadiri, J. D. LeBreux and F. Ghozayel, Langmuir, 2012, 28, 14799–14807 CrossRef CAS PubMed.
- M. Roman and D. G. Gray, Langmuir, 2005, 21, 5555–5561 CrossRef CAS PubMed.
- G. Chu, R. Vilensky, G. Vasilyev, P. Martin, R. Zhang and E. Zussman, J. Phys. Chem. Lett., 2018, 9, 1845–1851 CrossRef CAS PubMed.
- H. Maeda, Langmuir, 1997, 13, 4150–4161 CrossRef CAS.
- Y. Lin, E. Balizan, L. A. Lee, Z. Niu and Q. Wang, Angew. Chem., Int. Ed., 2010, 49, 868–872 CrossRef CAS PubMed.
- T. Sawada, Y. Murata, H. Marubayashi, S. Nojima, J. Morikawa and T. Serizawa, Sci. Rep., 2018, 8, 5412 CrossRef PubMed.
- B. Y. Lee, J. Zhang, C. Zueger, W.-J. Chung, S. Y. Yoo, E. Wang, J. Meyer, R. Ramesh and S.-W. Lee, Nat. Nanotechnol., 2012, 7, 351–356 CrossRef CAS PubMed.
- J. Kim, Y.-S. Choi, G. Park, M. Kim, J. S. Myung, W. J. Choi, S. M. Park and D. K. Yoon, ACS Nano, 2023, 17, 22778–22787 CrossRef CAS PubMed.
| This journal is © The Royal Society of Chemistry 2024 |


