Evidence for triplet-state-dominated luminescence in biicosahedral superatomic molecular Au25 clusters†
Masaaki
Mitsui
 *,
Yuki
Wada
,
Ryoto
Kishii
,
Daichi
Arima
and
Yoshiki
Niihori

Department of Chemistry, College of Science, Rikkyo University, 3-34-1, Nishiikebukuro, Toshima-ku, Tokyo 171-8501, Japan. E-mail: mitsui@rikkyo.ac.jp
First published on 26th April 2022
Abstract
In photoluminescence (PL) quenching and triplet fusion upconversion experiments with fluorescent organic-molecule quenchers, it was revealed that a rod-shaped, phosphine- and thiolate-protected biicosahedral Au25 cluster (a representative di-superatomic molecule) exhibits only phosphorescence, not fluorescence, at room temperature with an intersystem crossing quantum yield of almost 100%. By virtue of these photophysical properties, this cluster can be used as a triplet sensitizer that undergoes direct singlet–triplet transitions in the near-infrared (NIR) region (730–900 nm), inducing photon upconversion from NIR to visible light.
Metal clusters of specific compositions and sizes often exhibit a peculiarly high stability and chemical robustness. As is well-known, these properties originate from geometrical and electronic factors.1 The electronic factor is qualitatively explained by using the Jellium model,2 which assumes that the valence electrons in a metal cluster are confined to a uniformly positive potential formed by constituent metal cations. This model predicts the existence of superatomic orbitals (1S, 1P, 1D, 2S…), discrete orbitals with similarities to atomic orbitals. Like noble gas atoms, clusters with closed-shell electron configurations of superatomic orbitals (the total number of valence electrons: 2, 8, 18…) are electronically stable. Therefore, metal clusters can be regarded as “superatoms” with electronic structures similar to those of normal atoms. The emerging creation of functional materials from superatom building blocks has recently gathered much attention.3–7
The most representative di-superatomic molecule is the rod-shaped, phosphine- and thiolate-protected gold cluster [Au25(PPh3)10(SR)5Cl2]2+ (henceforth abbreviated as Au25-rod; PPh3 = triphenylphosphine) formed by two icosahedral Au135+(8e−) superatoms sharing a single vertex Au atom. As shown in Scheme 1, the Au25-rod possesses an Au259+(16e−) core. The crystal structure of this biicosahedral gold cluster was first reported by Tsukuda and co-workers.8 Since then, the structural,8–11 electronic,8–12 catalytic,13–15 photophysical,16–19 and photoluminescence (PL)18,20–22 properties of the Au25-rod have been widely reported. The PL of the Au25-rod has been dramatically enhanced by alloying with doping of Ag atoms.23 Previous reports have suggested that the PL emission from the Au25-rod is fluorescence.18,23 However, this suggestion has not been backed by clear experimental evidence and requires further investigation. In addition, the PL quantum yield (ΦPL) of the Au25-rod was thought to be as small as 0.1%,23 but the study reporting this conclusion was limited to the short-wavelength region (700–800 nm) of near-infrared (NIR) PL (700–1200 nm). More recently, the ΦPL value was determined as ∼8% over almost the entire NIR emission signal.22 Motivated by these facts, we investigated the PL properties of the Au25-rod cluster in more detail. In PL quenching and triplet fusion upconversion (TF-UC) experiments, we confirmed that the observed room-temperature PL of the Au25-rod clusters actually originates from phosphorescence from the excited triplet state. The excited cluster exhibits no discernible fluorescence emission at room temperature and is exclusively deactivated by an intersystem crossing (ISC) process.
 | ||
| Scheme 1 Crystal structure of [Au25(PPh3)10(SR)5Cl2]2+.8 | ||
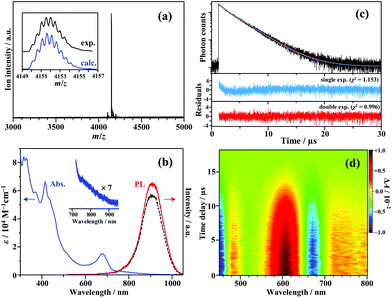
Fig. 1a shows the electrospray ionization mass spectrum of [Au25(PPh3)10(PET)5Cl2]2+ (PET = 2-phenylethanethiolate; counterion: SbF6−) synthesized in this study. The synthesis method was based on a previously reported method for the preparation of ultra-pure Au25-rod samples (see the ESI† for details).12 The strong signal at m/z = 4151.5 well matched the expected mass number when the charge number (z) was +2 (m/z 4151.6). The result confirms that the Au25-rods were the dominantly formed product. The absorption and PL spectra of this sample are shown in Fig. 1b. The absorption spectrum with a weak absorption tail from 730 to 900 nm excellently agrees with the literature.12,22 However, the peak around 900 nm in the PL spectrum is an artefact caused by a sharp drop in the sensitivity of the detector in this wavelength range (Fig. S1†), and the PL actually peaks at ∼990 nm.22 This NIR PL is observed in the wavelength region much longer than the lowest absorption band around 670 nm and is moderately weakened under aerated conditions, regardless of the excitation wavelength (Fig. 1b and Fig. S2†). The PL decay curve (depicted in Fig. 1c) was fitted to single and double exponential functions. The double exponential fit better reproduced the observed profile than the single exponential fit (see the residuals and χ2 values in the lower part of Fig. 1c). Two lifetime components were identified, τI = 0.80 μs (3%) and τII = 3.36 μs (97%), with the average lifetime of 3.29 μs. Under aerated conditions, the PL lifetime and PL intensity were reduced by 10–20% compared to those under deaerated conditions (Fig. 1b, Fig. S2 and Table S1†), suggesting the involvement of oxygen in the PL quenching and the observed PL is assumed to stem from phosphorescence. The trace component (τI) was observed in the same wavelength range as the major component, and the PL lifetime was shortened and the fractional population slightly increased by the addition of a large excess of SbF6− (Table S2†), suggesting that the ion pairs of the Au25-rod and SbF6− might be formed at a very low ratio by association–dissociation equilibrium in solution.24,25 The lifetime of the dominant component excellently agrees with the reported average lifetime of the Au25-rod (∼3.2 μs).22 Therefore, only the main component (τII) will be discussed below. Fig. 1d shows the sub-nanosecond transient absorption (TA) spectra of the Au25-rod in deaerated THF. As reported in the literature, the overall feature of the TA spectrum (i.e., excited-state absorption bands at around 480, 610, and >700 nm and ground-state breaching at 650–700 nm) was unchanged at all time delays.16 These excited-state absorption bands are attributed to the T–T absorption of the Au25-rod, as described later.
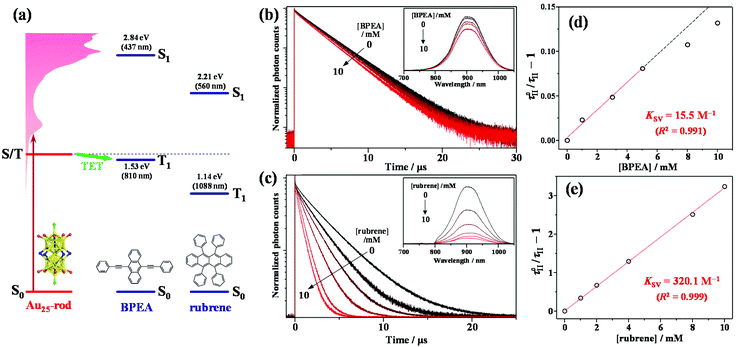
To experimentally confirm that the PL of the Au25-rod is phosphorescence, PL quenching experiments were implemented on the Au25-rod exposed to two highly fluorescent organic molecules, 9,10-bis(phenylethynyl)anthracene (BPEA) and rubrene, as the quenchers. When the Au25-rod is combined with the BPEA or rubrene quencher, the expected main quenching pathway is triplet energy transfer (TET) (Fig. 2a and S3†). Indeed, both quenchers decreased the PL intensity and lifetime (Fig. 2b and c), but did not change the spectral shape of the Au25-rod PL. Furthermore, there was no change in the absorption spectrum of the Au25-rod up to the quencher concentration of 10 mM and no isosbestic point (Fig. S4†), thus ruling out the formation of association complexes between the Au25-rod and BPEA (or rubrene). In the BPEA case, the Stern–Volmer plot of τII was a linear function of BPEA concentration up to 5 mM, but somewhat saturated at higher BPEA concentrations (Fig. 2d). As can be seen from the absorption spectrum in Fig. S4a,† BPEA aggregates begin to form when the BPEA concentration exceeds ∼5 mM. Thus, the decrease in the effective quencher concentration due to the aggregation is considered to be the main cause of the downward deviation in Fig. 2d. In the presence of rubrene, the quenching effect was much more pronounced (Fig. 2c) and the linearity of the plot was maintained up to 10 mM (Fig. 2e). This result can be explained by the increased TET driving force due to the approximately 0.4 eV lower T1 energy of rubrene [ET = 1.14 eV] than that of BPEA [ET = 1.53 eV] (Fig. 2a)26 and the lack of rubrene aggregation in THF (Fig. S4b†). The linear dependence in the Stern–Volmer plot is a typical signature of dynamic quenching,27 indicating that this quenching is solely based on collisions via diffusion. The Stern–Volmer constants (Ksv) obtained from the linear fits were 15.5 M−1 for BPEA and 320.1 M−1 for rubrene. From the relation Ksv = kTET·τII, the TET rate constants (kTET) in the presence of BPEA and rubrene were calculated as 4.6 × 10⁶ M−1 s−1 and 9.5 × 10⁷ M−1 s−1, respectively. When anthracene [ET = 1.84 eV]28 was used as the quencher, no quenching was observed at an anthracene concentration of 10 mM (Fig. S5 and Table S3†). Thus, we inferred that the T1 state of the Au25-rod is located around 1.6–1.7 eV. The magnitude of kTET is obviously correlated with the energy gap between the T1 states of the Au25-rod and the quenchers (roughly +0.5 eV for rubrene, +0.1 eV for BPEA, and −0.2 eV for anthracene), indicating that the observed quenching is indeed caused by the TET process. Interestingly, even though the Au25 biicosahedral core is almost completely shielded by phosphine and thiolate ligands in the Au25-rod (Fig. S6†), kTET of the Au25-rod for the rubrene acceptor is comparable to that of the PtAg24 clusters (∼108 M−1 s−1), where the triplet excitation energy is transferred to the surface staple.29 Notably, the Cl atoms bound to both ends of the long axis of the biicosahedral core are not completely shielded by the PPh3 ligands. Moreover, in both the highest occupied molecular orbital (HOMO) and lowest unoccupied molecular orbital (LUMO), the p orbital of the Cl atom extends outward along the long axis direction of the Au25 core.30 Therefore, these are presumed to be the effective sites for short-range Dexter-type TET to occur.
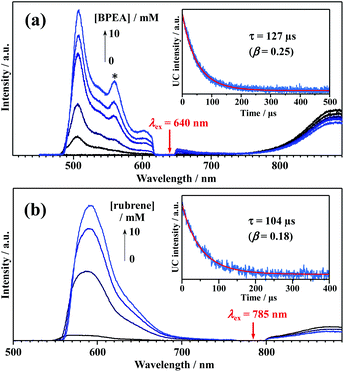
We attempted to measure the triplet–triplet (T–T) absorption of 3BPEA* and 3rubrene* sensitized by the TET from the Au25-rod. However, the T–T absorption band overlapped with its own extremely strong S0–S1 absorption and could not be observed. If triplet sensitization is indeed caused by the Au25-rod, we should observe upconverted fluorescence via triplet–triplet annihilation (TTA) between the 3BPEA* (or 3rubrene*) molecules (i.e., delayed fluorescence). As shown in Fig. 3, when a deaerated mixture of the Au25-rod and BPEA or rubrene was excited at 640 or 785 nm, respectively, upconverted fluorescence was clearly observed at wavelengths shorter than the excitation wavelength. Both fluorescences exhibited very long decays (in the order of 100 μs; see Fig. 3, insets). The time evolution of the UC intensity IUC(t), derived from the rate equation of the time dependence of the concentration of triplet emitter (3E*) molecules considering the TTA process between 3E*, is given by
 | (1) |
 | ||
| Fig. 3 PL emission spectra of (a) Au25-rod (13 μM)/BPEA (0–10 mM) excited at 640 nm (10 W cm−2) and (b) Au25-rod (40 μM)/rubrene (0–10 mM) excited at 785 nm (5.5 W cm−2) in deaerated THF. The asterisked peak in panel (a) begins to appear when the BPEA concentration exceeds ∼5 mM and is assigned to the emission from BPEA aggregates (Fig. S4a†). Insets in panels (a and b) show the decay curves obtained by monitoring only the upconverted emission from BPEA and rubrene, respectively. | ||
Recently, we proposed a relative method that estimates the ΦISC value of sensitizers by a TF-UC analysis.29,32 The formation yield of the UC state (ΦUCs), i.e., the number of excited singlet states of the emitter (1E*) generated per number of photons absorbed by the sensitizer, can be experimentally evaluated as (see also Fig. S8†):33
 | (2) |
| ΦUCs = ΦISCΦTETΦTTA, | (3) |
 | (4) |
The value of f2 can be calculated from the β value of the UC decay fit using eqn (1). Finally, eqn (3) can be rewritten as
| ΦUCs = ΦISCΦTETf2ηc/2. | (5) |
If the ΦUCs value of the Au25-rod/BPEA system is evaluated under the same experimental conditions (the same emitter concentration, solvent, and excitation source) as when evaluating ΦrUCs of the PdTPTBP (ΦISC = 0.97)35/BPEA reference system, the ratio ΦUCs/ΦrUCs based on eqn (2) can be combined with eqn (5) to give the ΦISC value of the Au25-rod. The formulation is as follows:
 | (6) |
In eqn (6), the superscript “r” refers to the reference system. Under the above-described experimental conditions, ηc can be regarded as identical in both systems and thereby cancels out. However, if the β values largely differ between the experimental and reference systems, the ratio f2 must be retained in eqn (6). From the data and parameters shown in Fig. S9 and S10 and Tables S4–S6,† the ΦISC value of the Au25-rod was determined as 0.99 ± 0.05. Thus, the phosphorescence quantum yield (Φp) was calculated as ∼0.08 from the relation ΦPL = ΦISC·Φp (∼0.08)22 and the radiative rate constant (kr) was calculated as 2.4 × 10⁴ s−1 from the relation ΦpτII−1 (=Φpτp−1, where τp represents the phosphorescence lifetime).
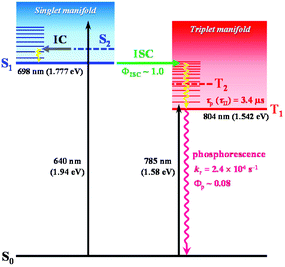
In a previous femtosecond TA spectroscopy study of the Au25-rod,16 excitation at 415 nm elicited sub-picosecond internal conversion (∼0.8 ps) early time dynamics, but excitation at 775 nm yielded a constant feature of the TA spectra over a wide range of timescales (sub-ps to μs). In the present study, we showed that under excitation at 785 nm, the observed PL emission from the Au25-rod is also phosphorescence (Fig. S2†); moreover, this coexistence with rubrene can induce the TF-UC phenomenon (Fig. 3b and Table S7†). Based on these experimental facts, we attributed the unchanged excited-state absorption signal to the T1–Tn absorptions of the Au25-rod, and the weak absorption shoulder at 730–900 nm mainly to the direct spin-forbidden transitions from S0 to T1 of the Au25-rod, as shown in Fig. 4. The T1–Tn absorption has been observed within a few picoseconds,16 suggesting the occurrence of ultrafast ISC (∼1012 s−1). This inference is consistent with the almost 100% ISC efficiency and absence of fluorescence at room temperature. In time-dependent density functional theory calculations, the transitions between S0 and S1 were suggested to be symmetrically forbidden and their oscillator strength was zero (Fig. S11†).22 In other words, the Au25-rod cluster has the “dark” S1 and “bright” T1 states at room temperature.
 | ||
| Fig. 4 Excited state deactivation pathway and related photophysical parameters for the Au25-rod in deaerated THF. The vertical transition energy from S0 to S1 or T1 obtained from theoretical calculations is also shown. The S2 and T2 states theoretically predicted to exist in the energetic vicinity of the S1 and T1 states (Fig. S11†) are shown as dashed lines. | ||
In the biicosahedral Au25 core, the significant spin–orbit coupling effect provided by 25 Au atoms and the small S–T energy gap (<0.2 eV) is presumed to inevitably result in strong S–T mixing. Therefore, it may be more appropriate to view the excited states of such gold clusters as coherent superpositions of singlet and triplet states,36 as in semiconductor nanocrystals with ill-defined spin quantum numbers.37 If this is true, a clear distinction between fluorescence and phosphorescence would no longer be possible. Therefore, theoretical considerations based on total angular momenta (i.e., the sum of orbital and spin angular momenta) may be necessary to better understand the electronic excited states and PL properties of noble metal clusters.
In conclusion, the observations and analysis of PL quenching and TF-UC of the biicosahedral Au25-rod clusters confirmed that the PL from the Au25-rod is phosphorescence from the excited triplet state formed with almost 100% ISC quantum yield. Moreover, this cluster behaves as a triplet sensitizer undergoing direct S–T transitions in the NIR region, which can induce NIR-to-visible photon upconversion. This gold superatomic molecule is capable of modifying its electronic states, photophysical properties, and hydrophobicity/hydrophilicity by altering thiolate ligands15,23 or replacing the terminal Cl atoms with alkynyl ligands.38 Hence, it is expected to be a nanomaterial with potential use as a triplet sensitizer in TF-UC applications.
Author contributions
MM conceptualized and designed the study, performed the computational work and wrote the manuscript. YW, RK, DA and YN performed experimental work and data analyses. All the authors discussed the results and contributed to the writing of the manuscript.Conflicts of interest
There are no conflicts to declare.Acknowledgements
This work is partly supported by the Grant-in-Aids for Young Scientists, no. 20K15110 and Scientific Research (C), no. 20K05653. Theoretical calculations were performed at the Research Center for Computational Science, Okazaki, Japan.References
- S. N. Khanna and P. Jena, Phys. Rev. B: Condens. Matter Mater. Phys., 1995, 51, 13705 CrossRef CAS PubMed.
- W. D. Knight, K. Clemenger, W. A. de Heer, W. A. Saunders, M. Y. Chou and M. L. Cohen, Phys. Rev. Lett., 1984, 52, 2141 CrossRef CAS.
- H. Häkkinen, Chem. Soc. Rev., 2008, 37, 1847 RSC.
- Z. Luo and A. W. Castleman, Jr., Acc. Chem. Res., 2014, 47, 2931 CrossRef CAS PubMed.
- P. Jena and Q. Sun, Chem. Rev., 2018, 118, 5755 CrossRef CAS PubMed.
- S. Takano and T. Tsukuda, J. Am. Chem. Soc., 2021, 143, 1683 CrossRef CAS PubMed.
- H. Hirai, S. Ito, S. Takano, K. Koyasu and T. Tsukuda, Chem. Sci., 2021, 11, 12233 RSC.
- Y. Shichibu, Y. Negishi, T. Watanabe, N. K. Chaki, H. Kawaguchi and T. Tsukuda, J. Phys. Chem. C, 2007, 111, 7845 CrossRef CAS.
- K. Nobusada and T. Iwasa, J. Phys. Chem. C, 2007, 111, 14279 CrossRef CAS.
- H. Qian, W. T. Eckenhoff, M. E. Bier, T. Pintauer and R. Jin, Inorg. Chem., 2011, 50, 10735 CrossRef CAS PubMed.
- J.-Q. Goh, S. Malola, H. Häkkinen and J. Akola, J. Phys. Chem. C, 2013, 117, 22079 CrossRef CAS.
- M. Galchenko, R. Schuster, A. Black, M. Riedner and C. Klinke, Nanoscale, 2019, 11, 1988 RSC.
- G. Li and R. Jin, J. Am. Chem. Soc., 2014, 136, 11347 CrossRef CAS.
- S. Zhao, N. Austin, M. Li, Y. Song, S. D. House, J. C. Yang, G. Mpourmpakis and R. Jin, ACS Catal., 2018, 8, 4996 CrossRef CAS.
- K. Zheng, J. Zhang, D. Zhao, Y. Yang, Z. Li and G. Li, Nano Res., 2019, 12, 501 CrossRef CAS.
- M. Y. Sfeir, H. Qian, K. Nobusada and R. Jin, J. Phys. Chem. C, 2011, 115, 6200 CrossRef CAS.
- M. S. Devadas, V. D. Thanthirige, S. Bairu, E. Sinn and G. Ramakrishna, J. Phys. Chem. C, 2013, 117, 23155 CrossRef CAS.
- M. Zhou, J. Zhong, S. Wang, Q. Guo, M. Zhu, Y. Pei and A. Xia, J. Phys. Chem. C, 2015, 119, 18790 CrossRef CAS.
- V. D. Thanthirige, E. Sinn, G. P. Wiederrecht and G. Ramakrishna, J. Phys. Chem. C, 2017, 121, 3530 CrossRef CAS.
- S. Chen, H. Ma, J. W. Padelford, W. Qinchen, W. Yu, S. Wang, M. Zhu and G. Wang, J. Am. Chem. Soc., 2019, 141, 9603 CrossRef CAS PubMed.
- S. Park and D. Lee, Langmuir, 2012, 28, 7049 CrossRef CAS PubMed.
- Q. Li, C. J. Zeman IV, Z. Ma, G. C. Schatz and X. W. Gu, Small, 2021, 17, 2007992 CrossRef CAS PubMed.
- S. Wang, X. Meng, A. Das, T. Li, Y. Song, T. Cao, X. Zhu, M. Zhu and R. Jin, Angew. Chem., Int. Ed., 2014, 53, 2376 CrossRef CAS PubMed.
- K. Pyo, V. D. Thanthirige, K. Kwak, P. Pandurangan, G. Ramakrishna and D. Lee, J. Am. Chem. Soc., 2015, 137, 8244 CrossRef CAS PubMed.
- Y. Niihori, N. Takahashi and M. Mitsui, J. Phys. Chem. C, 2020, 124, 5880 CrossRef CAS.
- T. N. Singh-Rachford and F. N. Castellano, J. Phys. Chem. A, 2008, 112, 3550 CrossRef CAS PubMed.
- B. Valeur, Molecular Fluorescence. Principles and Applications, Wiley-VCH, 2001 Search PubMed.
- M. R. Padhye, S. P. McGlynn and M. Kasha, J. Chem. Phys., 1956, 24, 588 CrossRef CAS.
- Y. Niihori, Y. Wada and M. Mitsui, Angew. Chem., Int. Ed., 2021, 60, 2822 CrossRef CAS PubMed.
- F. M. Miranda, M. C. Menziani and A. Pedone, J. Phys. Chem. C, 2015, 119, 10766 CrossRef.
- E. M. Gholizadeh, L. Frazer, R. W. MacQueen, J. K. Gallahera and T. W. Schmidt, Phys. Chem. Chem. Phys., 2018, 20, 19500 RSC.
- D. Arima, Y. Niihori and M. Mitsui, J. Mater. Chem. C, 2022, 10, 4597 RSC.
- Y. Zhou, F. N. Castellano, T. W. Schmidt and K. Hanson, ACS Energy Lett., 2020, 5, 2322 CrossRef CAS.
- Y. Y. Cheng, B. Fückel, T. Khoury, R. G. C. R. Clady, M. J. Y. Tayebjee, N. J. Ekins-Daukes, M. J. Crossley and T. W. Schmidt, J. Phys. Chem. Lett., 2010, 1, 1795 CrossRef CAS.
- J. E. Rogers, K. A. Nguyen, D. C. Hufnagle, D. G. McLean, W. Su, K. M. Gossett, A. R. Burke, S. A. Vinogradov, R. Pachter and P. A. Fleitz, J. Phys. Chem. A, 2003, 107, 11331 CrossRef CAS.
- Z. Wei, Y. Pan, X. Huo, Y. He, Y. Kuang, X. Ran and L. Guo, J. Phys. Chem. C, 2022, 126, 3512 CrossRef CAS.
- Y. Han, S. He and K. Wu, ACS Energy Lett., 2021, 6, 3151 CrossRef CAS.
- M. Sugiuchi, Y. Shichibu, T. Nakanishi, Y. Hasegawa and K. Konishi, Chem. Commun., 2015, 51, 13519 RSC.
Footnote |
| † Electronic supplementary information (ESI) available. See DOI: https://doi.org/10.1039/d2nr00813k |
| This journal is © The Royal Society of Chemistry 2022 |


