A liquid metal based capacitive soft pressure microsensor
Xuyan
Zhou
ab,
Renchang
Zhang
ab,
Luojia
Li
cd,
Lunjia
Zhang
ab,
Bingxin
Liu
ab,
Zhongshan
Deng
ab,
Lejing
Wang
e and
Lin
Gui
 *ab
*ab
aKey Laboratory of Cryogenics, Technical Institute of Physics and Chemistry, Chinese Academy of Sciences, Beijing 100190, China. E-mail: lingui@mail.ipc.ac.cn; Tel: +86 10 8254 3483
bUniversity of Chinese Academy of Sciences, Beijing 100039, China
cDepartment of Ophthalmology, Eye diseases and Optometry Institute, Peking University People's Hospital, Beijing 100044, China
dBeijing Key Laboratory of Diagnosis and Therapy of Retinal and Choroid Diseases, College of Optometry, Peking University Health Science Center, Beijing 100191, China
eDepartment of Ophthalmology, Peking University People's Hospital, Beijing 100044, China
First published on 18th January 2019
Abstract
A liquid-metal based capacitive soft pressure microsensor is proposed in this work for measuring pressure in microchannels. To measure the pressure of the target microchannel, a short detection channel is fabricated and connected to the target microchannel. Because the detection channel has only one outlet at the end which is connected to the target microchannel, the fluid in the detection channel will stay still during the measurement and the pressure remains constant inside the detection channel. A segment of reference fluid which is immiscible with the working fluid is sealed inside the detection channel. Because the chip material is soft, the pressure change will lead to the movement of the interface between the reference fluid and working fluid inside the detection channel. A pair of liquid metal electrodes are fabricated on both sides of the detection channel. By measuring the capacitance between these two liquid metal electrodes, the movement of the interface can be detected, and thus the pressure change can be detected as well. To minimize the influence from the environment, two liquid metal shield layers are placed on the top and the bottom of the microchannel layer separately. The microsensor was first tested in a microfluidic system and then utilized to measure the blood pressure of rabbit carotid artery in vivo. The experimental results showed excellent stability and linear correlation between capacitance and the value of fluid pressure. The pressure sensor can achieve a resolution of 7.5 mmHg within a pressure range of 20–300 mmHg. This work provides a promising approach to develop an implantable blood or intraocular pressure-monitoring device for clinical use.
Introduction
With the development of microfluidic applications in biochemical analysis, accurate pressure measurement in microfluidic systems is becoming more and more important. First, in a microfluidic system with pressure-driven flow, it is necessary to control the pressure precisely to process biological or chemical samples.1–6 Second, the pressure is the key parameter used to characterize the flow resistance of the microchannel to study the mechanical properties of the cells. For example, the pressure drop change at the outlet of the test channel can characterize the rheological properties of red blood cells and white blood cells in the microchannel.7,8 Third, pressure is also important for the generation and control of bubbles or droplets in a continuous stream. In particular, the size of the bubbles in the gas–liquid multiphase flow is highly dependent on the magnitude of the pressure in the gas stream.9,10 The droplet size is also highly correlated with the pressure.11 Finally, fluid pressure sensors can also be used for implantable pressure monitoring, such as intraocular pressure,12–14 intracranial pressure,15–18 blood pressure19–21 and so on.The traditional fluid pressure measurement in microchannels relies on external detection equipment.22 Sometimes the external detection equipment is very large compared to the size of the microchannels. The measurement is typically very inconvenient and always delayed. It is very difficult to accurately measure the local pressure in real time using external sensors.23 Therefore, there is a need for a pressure microsensor that is small and can be easily integrated into a microfluidic chip, or just beside the target microchannel.
Some researchers have realized this demand and proposed some integratable pressure micro sensors recently. Generally speaking, a typical method for pressure measurement is placing a thin membrane between the target environment and an environment with a known pressure. When the pressure of the target environment changes, the membrane deforms. By detecting the deformation of the membrane, the pressure can be measured. According to the detection principle of the membrane deformation, the pressure microsensor can be divided into several categories, such as piezoelectric pressure microsensors,26,27 capacitive pressure microsensors,28 optical pressure microsensors29–35 and so on.
Despite the advancements, most of the pressure microsensors have structures too complicated to be easily integrated into a microfluidic chip. For example, a piezoelectric pressure sensor at least requires integrating a small piece of piezoelectric material into the microfluidic system, which makes the fabrication process very complicated.26 An optical pressure sensor requires at least a laser generator or an LED to set the light and a photomultiplier (PMT) to detect the light, which makes the sensor too large to be integrated into a microfluidic chip.
In order to simplify the structure, some researchers have begun to study the membraneless microfluidic pressure sensor. N. Srivastava et al.24 proposed a method for measuring fluid pressure using the compression of trapped air in a sealed microchannel, and then measuring the fluid pressure by recording the change of the gas–liquid interface. However, the fabrication material of this pressure sensor needs to be leakage-free for gas, such as glass.25 This limits the application of sensors for most commonly used flexible polymer materials such as PDMS. M. Abkarian36 proposed a method of replacing gas with liquid in sealed microchannel, that is, a method of measuring the pressure by using two mutually incompatible liquid–liquid interface movements. This technique can be used in permeable substrates such as PDMS. However, it is still necessary to determine the pressure by image analysis, which is inconvenient for outputting the results. Inspired by the development of flexible electronics, liquid metal is receiving more and more attention as soft electrodes.37 The application of liquid metal on PDMS microfluidic chips has been greatly stimulated because of its flexibility, easy fabrication, and convenient electronic output.
This paper presents a flexible liquid metal based capacitive fluid pressure microsensor. The basic principle is to measure the pressure by detecting capacitance change caused by the movement of the interface of two immiscible liquids in the micro channel. This method directly measure the pressure in a microscale manner. The detection channel and liquid metal electrodes can be fabricated at any target spot together with the working microchannel, which makes the miniaturization and integration much easy. The capacitance change can be monitored in real time by an LCR meter or even wirelessly by a terminal in the future.
The main content of this paper is to first outline the principle of the pressure sensor. Then, the fabrication method and process of the sensor are introduced. Afterwards, the sensor is tested for pressure measurement in vitro. Finally, the sensor is used in vivo. Blood pressure testing is performed to verify the effectiveness of blood pressure monitoring.
Theory
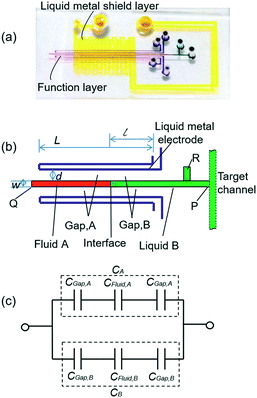
The liquid metal based capacitive pressure sensor consists of one functional layer and two shield layers. The function layer is for pressure measurement and the shield layers are made for noise prevention during the measurement. The function layer and the bottom shield layer are separated by one PDMS membrane. As shown in Fig. 1(b), the function layer contains liquid metal electrode channels, a middle detection channel and the target working channel. The detection channel can be located at any position of the target channel for pressure measurement. As shown in Fig. 1, the detection channel has only one entrance and no exit. The entrance of detection channel is located at the point P on the target channel and the point P is just the point at which we want to measure the pressure. The two liquid metal electrodes on both sides of the detection channel constitute a capacitor. For easy injection of liquid metal into the microchannels, each microchannel need at least one inlet and one outlet for the air inside easily coming out. Because after the injection, the inlet and outlet need to be connected to make the electrical connection more stable, the liquid metal electrodes were designed in such u-shape (see Fig. 1(b)) to make the inlet and outlet as close as possible for convenience. When the fluids in the detection channel changes, the capacitance between the two liquid metal electrodes will also change. To study the capacitance between the two liquid metal electrodes, a theoretical model is built as shown in Fig. 1(c). It is worth noting that an electric double layer would exist on the microchannel wall. The electric double layer is much like a plate capacitor. Because the capacitance of the electric double layer is mainly determined by the fluid since the material of the channel wall is PDMS all the time. Thus, the capacitance of the double layer can be regarded as one part of the equivalent capacitance of the liquids (CFluid,A or CFluid,B) as shown in Fig. 1(c). The measured capacitance can be regarded as CA and CB in parallel. In addition, CA or CB can also be regarded as three separate capacitors (PDMS membrane, liquid and the other PDMS membrane) connected in series. For each parallel plate capacitor, the capacitance value is given as: | (1) |
The capacitance is proportional to both the dielectric constant ε and the conductor-dielectric interfacial area S. The capacitance is inversely proportional to distance D of the dielectric material between two electrodes.
Thus, the total capacitance of the circuit can be written as:
 | (2) |
If we set the length of the fluid B as l, then the conductor-dielectric interfacial area SA and SB can be expressed as:
 | (3) |
 | (4) |
 | (5) |
According to eqn (5), for a certain capacitor, l is the only variable parameter. For successful pressure measurement, the dielectric constant of reference fluid A must be significantly different from that of the testing fluid B. Moreover, fluid A and fluid B should be immiscible to remain a stable interface between them. As fluid B flows past the entrance of the detection channel under certain pressures, it will be forced into the sealed detection channel, thereby compressing fluid A to form a corresponding interface of fluid A and fluid B. When the pressure of fluid B increases, the A–B interface moves forward, then l (the length of fluid B) and Csen both increase. Thus, the fluid pressure can be estimated by measuring the capacitance.
Based on this theory, this study used silicone oil (which has a small dielectric constant) as a reference (fluid A) in the experiment of DI water (fluid B) pressure measurement. The dielectric constant of water, εwater (εB), is about 81 and the dielectric constant of oil, εoil (εA), is about 2.2. In the case where εB is much greater than εA, the second term in eqn (5) must be greater than zero. Therefore, Csen will increase as l, the length of water, increases.
Device fabrication
Multilayer soft lithography
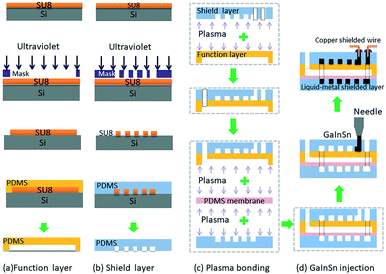
The pressure sensor is fabricated with PDMS using multilayer soft lithography (MSL) technology. As shown in Fig. 2, SU-82075 (MicroChem) and silicon wafer (Ultrapak® 100 mm, Entegris) were first used to fabricate the mold, which contains the desired microchannel pattern (function channel structure and the shielding layer liquid metal channel structure). Then Sylgard 184 silicone elastomer (PDMS, mixture of base and curing agent at a ratio of 10![[thin space (1/6-em)]](https://www.rsc.org/images/entities/char_2009.gif) :
:![[thin space (1/6-em)]](https://www.rsc.org/images/entities/char_2009.gif) 1 by weight, Dow Corning) was used to mould the sensor function layer and shield layer respectively. After punching one liquid metal inlet hole on the upper shield layer PDMS, the upper shield layer PDMS was first bonded irreversibly to the back of the function layer PDMS together through a air plasma treatment (YZD08-2C, Tangshan Yanzhao Technology), and then they were punched six fluid inlets and outlets. After that they were bonded to a PDMS membrane to seal the function channels. Then the three-layer PDMS structure and the below shield layer PDMS were bonded face-to-face. Finally, a four-layer PDMS micro chip was finished, which had a detection channel with two electrode channels on both sides in the function layer.
1 by weight, Dow Corning) was used to mould the sensor function layer and shield layer respectively. After punching one liquid metal inlet hole on the upper shield layer PDMS, the upper shield layer PDMS was first bonded irreversibly to the back of the function layer PDMS together through a air plasma treatment (YZD08-2C, Tangshan Yanzhao Technology), and then they were punched six fluid inlets and outlets. After that they were bonded to a PDMS membrane to seal the function channels. Then the three-layer PDMS structure and the below shield layer PDMS were bonded face-to-face. Finally, a four-layer PDMS micro chip was finished, which had a detection channel with two electrode channels on both sides in the function layer.
Liquid metal electrode
In this study, room temperature liquid metal GaIn20.5Sn13.5 (Ga 66%, In 20.5%, Sn 13.5%, the melting point of 10.6 °C) was injected into the micro electrode channel to form the electrodes. Although in liquid states, GaInSn alloy is well sealed in the PDMS microchannels and can work perfectly as soft electrodes for PDMS microfluidic systems. Then, the shielded wires were inserted into the injection holes and contact with liquid metal electrodes. Finally, the injection holes were sealed by an adhesive sealant (705 RTV transparent silicone rubber). The fabrication process of the electrode is very simple, compared with the conventional micro electrode fabrication methods such as metal deposition and sputtering.Liquid metal shield layer
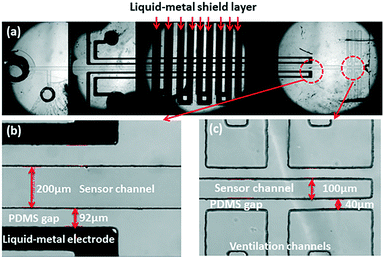
In order to protect the capacitive signal from outside noise signal, two liquid metal shielding layers were designed and placed very closely to the functional layer face to face from the top and the bottom. As shown in Fig. 1, the liquid metal microchannels in the shield layer were designed in a serpentine shape to cover the whole detection area in the functional layer. The liquid metal microchannels were also fabricated using soft-lithography technology. To connect the upper shield layer and the lower shield layer, a through hole was drilled in the functional layer to connect the liquid metal microchannels on both shield layers. After the shielding layers were bonded with the functional layer, same method was used to inject the liquid metal and seal the outlet holes in the shielding layers. The shield wire needs to be connected with the liquid metal in shielding layer and grounded to prevent noise from the environment. Fig. 3(a) shows the micrograph of the liquid-metal shield layer.In vitro pressure study using micro pressure sensor
Experimental set-up
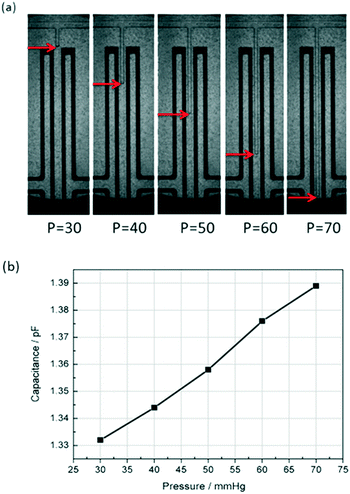
To test the capacitive pressure sensor, a microfluidic flow control device (MFCSTM-EZ, FLUIGENT, France) was used to control the fluid pressure and an external LCR instrument (E4980A Precision LCR Meter, Keysight Technologies) was used to measure the capacitance change. Then the capacitance data was sent to the computer through a Labview program. The DI water was used as the working fluid and the methylsilicone oil was used as the reference fluid sealed in the detection channel. At the same time, a fluorescence microscope (Axio Observer Z1, Carl Zeiss) was used to monitor the movement of the water–oil interface.After all of the equipments were set, methylsilicone oil was pressed and filled slowly into the one-end detection channel through the inlet of P (as shown in Fig. 1(b)). Because the PDMS is gas-permeable, the air in the detection channel will be gradually repelled out by the oil from the dead-end of Q (as shown in Fig. 1(b) and (c)). It took about 15 minutes to repel all the air out with the pushing pressure of 150 mbar. After the detection channel and the main channel are full of methylsilicone oil, the working fluid (DI water) was pumped into the main channel by using the microfluidic flow control system from P. A few minutes later, the majority of the remaining oil was repelled from the main channel through the outlet of R (as shown in Fig. 1(b)). Then, the outlet R was glued with uncured PDMS and thermally cured quickly by a soldering iron. Afterwards, the DI water was pumped into the section channel to compress the oil until the pressure between the DI water and the oil was balanced. The oil–water interface was stabilized within 30 seconds after the pressure change. The capacitance was measured with an LCR meter as the pressure is increased for every 10 mmHg. Fig. 4 shows the interface position and the corresponding average capacitance measured. The oil–water interface moved towards the dead-end of the detection channel as the fluid pressure was increased. When the DI water enters the detection channel, that is to say, as l (shown in Fig. 1(b)) is raised, the measured capacitance Csen is increased. The experimental result is consistent with the previous theoretical analysis.
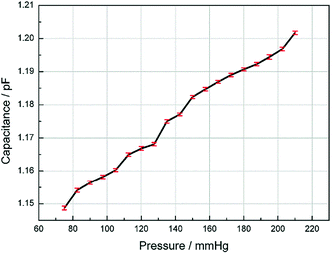
Since the human blood pressure typically vary from 90–130 mmHg, we measured the response of the sensor range from 75 mmHg to 210 mmHg. The capacitance is recorded as the fluid pressure is increased for every 7.5 mmHg and the results are shown in Fig. 5. The length of the error bars in the figure represent the fluctuation range of the measured capacitance. Fig. 5 shows that the capacitance is approximately linear to the pressure. According to the resolution of the LCR meter, the sensitivity of the sensor is 0.14 mmHg.
Continuous pressure pulse measurement
To investigate the response of the pressure sensor to a sudden increase or decrease of fluid pressure, we provide a pulse pressure (high pressure 180 mmHg, low pressure 106 mmHg) to test the performance of the sensor. Using the same experiment set-up, we recorded the measured capacitance and drew a curve of capacitance and pressure change over the time. The red line represents the applied pressure in the fluid, and the blue line represents the capacitance. As shown in Fig. 6, the capacitance will change with the pressure. Although there is a slight lag time (less than 0.2 ms), it can still be clearly seen that the liquid metal based capacitive pressure sensor is going with pressure changes in real-time.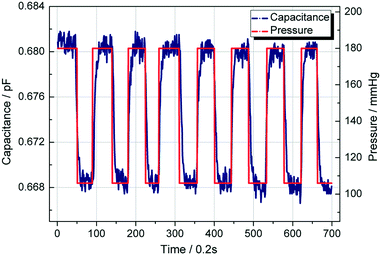 | ||
| Fig. 6 Measured capacitance of the pressure sensor shifted in response to a pulse fluid pressure of 106 mmHg and 180 mmHg. | ||
Temperature effect on measurement
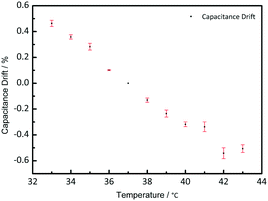
To study the temperature effect on the pressure measurement, the pressure sensor was put on a hot plate with a pressure load of 200 mbar. The temperature was changed from 33 °C to 43 °C, focusing on its potential implantable medical use. Fig. 7 shows the capacitance drift varied with the temperature. Based on the capacitance of 37 °C, the capacitance drifted from −0.5% to 0.5%, which is small and can be neglected during the measurement. As shown in Fig. 7, when the temperature gets higher, the capacitance gets smaller, because the thermal expansion will make the distance between the two electrodes larger.Structure effect on measurement
To investigate the influence of structure parameters on measurement, two parameters were considered for further discussion: channel width and channel length of the detection channel.Fig. 8(a) shows the capacitance change ratio varied with pressure with different channel width. Two kinds of channel width were considered: 100 microns and 200 microns. All the capacitance was compared with their initial capacitance C0, with the pressure changing from 50 mmHg to 250 mmHg. As shown in Fig. 8(a), with the channel getting narrower, the capacitance changes much faster. The reason can be shown in Fig. 8(b) that, with narrower channel width, the interface will move further for similar volume change under same pressure load. Thus, the capacitance will change more sharply when the channel width is smaller.
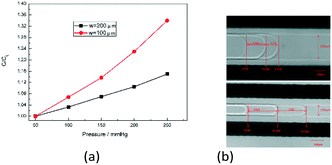 | ||
| Fig. 8 (a) Capacitance change ratio varied with pressure with different channel width. (b) The position of the fluid interface with different channel width under same pressure change. | ||
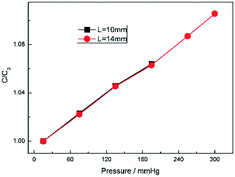
To investigate the effect of the channel length on the pressure measurement, we elongate the channel length by elongating the section of electrodes L (Fig. 1b). Two kinds of length were considered as shown in Fig. 9: L = 10 mm and L = 14 mm. Fig. 9 shows the capacitance change ratio varied with pressure with different L. As mentioned above, all the capacitance was compared with their initial capacitance C0. In Fig. 9, two curves were almost coincident with each other between 20 mmHg and 200 mmHg. When the pressure exceeds 200 mbar, for the 10 mm long sensor, the fluid interface goes out of detectable range and make the measurement stop. So, the L is key to the measurement rage and seldom change the sensitivity.
Rabbit blood pressure monitoring in vivo
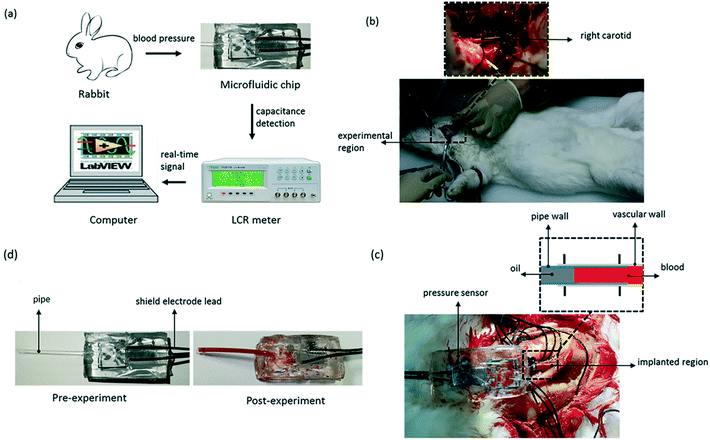
To test the pressure sensor for blood pressure monitoring, a classic blood pressure measurement experiment on rabbit was carried out. The experimental setup was as the same as before, except that the sensor inlet was connected directly to a rabbit's carotid artery to measure the blood pressure and the DI water was changed to blood this time. The experimental set-up of blood pressure monitoring in vivo is shown in Fig. 10. After inserting the pressure sensor in to the rabbit's carotid artery, the classic procedure involves measuring the normal arterial blood pressure was performed at first, and then 1 ml 2 g L−1 norepinephrine (norepinephrine can raise blood pressure of the rabbit) was injected into the rabbit through its ear vein to raise the blood pressure. The data for the entire process was plotted in Fig. 11. We can see that, under normal conditions, the capacitance was maintained in a stable range of 0.509–0.513 pF. After the injection of norepinephrine, the capacitance was increased and stabilized between 0.512–0.516 pF. The experiments indicate that the capacitive pressure sensor is sensitive enough to detect the pressure fluctuations for the animals like rabbits, and thus can be used as an implantable device for blood pressure monitor.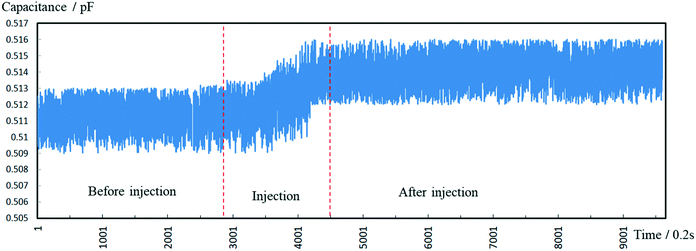 | ||
| Fig. 11 Measured capacitance during the whole process including the normal pressure and the increased pressure. | ||
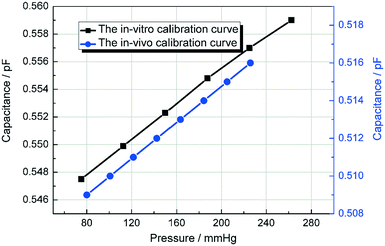
As shown in Fig. 12, the black curve shows the in vitro experimental calibration curve of the pressure sensor before the in vivo experiment was performed. After applied in the blood pressure measurement, the capacitance of 80 mmHg was shift from 0.547 pF to 0.509 pF and the slope (0.07 fF mmHg−1) remains the same according to Fig. 11. After the shifting adjustment, the blue curve in Fig. 12 shows the calibration curve for the in vivo experiment. This shift is caused by the diffuse of blood into the DI water in detection channel. When the blood diffused in to the DI water, the εA will increase accordingly. According to eqn (5), when εA increases the capacitance Csen will decrease with it which makes the in vivo calibration curve shift a little bit downwards. Fig. 11 shows that the rabbit blood pressure increased from a low pressure of 80 mmHg and a high pressure of 160 mmHg to 140 and 220 mmHg. This indicates that the liquid metal base capacitive pressure sensor could be used to detect fluctuations in animal blood pressure.
Conclusions
The liquid metal based capacitive pressure sensor consists of a detection channel with two parallel liquid-metal electrodes on both sides. It could be used to measure the fluid pressure in micro channels at any desired testing position and easily integrated in the PDMS microfluidic system without additional fabrication and installation. Moreover, liquid metal electrodes instead of solid electrodes enable it to be easily integrated in microfluidic systems or wearable sensing devices. The results show strong correlation between the measured capacitance and the pressure. Because the PDMS is soft, any pressure increase in main channel will cause more working fluid going into the detection channel and the interface of the two fluids going further into the detection channel causing the capacitance change and vice versa. Therefore, the pressure could be obtained by detecting the capacitance change. The pressure sensor could achieve a capacitance range of 20–300 mmHg and exhibits high sensitivity, fast response time and high flexible stability. Further parametric study shows that the capacitance varies between −0.5% and 0.5% when temperature changes from 33 °C to 43 °C, which is quite stable for normal use. When the detection channel gets narrower, the sensitivity will get higher. For longer detection channel the measuring range can be enlarged. To test its implantable application, this sensor has been successfully used to detect the pressure fluctuation in a rabbit carotid artery.Live subject statement
This study was performed with the approval of the Ethics Committee of Peking University People's Hospital (ECPUPH). Animals were treated as the guidelines of ECPUPH.Conflicts of interest
There are no conflicts to declare.Acknowledgements
This work is financially supported by the National Natural Science Foundation of China (Grant No. 31427801) and Chip Sensor Project of State Grid Corporation of China.Notes and references
- C. E. Sims and N. L. Allbritton, Lab Chip, 2007, 7, 423–440 RSC.
- T. Matsunaga, M. Hosokawa, A. Arakaki, T. Taguchi, T. Mori, T. Tanaka and H. Takeyama, Anal. Chem., 2008, 80, 5139–5145 CrossRef CAS PubMed.
- K. Kleparnik and M. Horky, Electrophoresis, 2003, 24, 3778–3783 CrossRef CAS PubMed.
- K. H. Chung, M. M. Crane and H. Lu, Nat. Methods, 2008, 5, 637–643 CrossRef CAS PubMed.
- M. M. Crane, K. Chung and H. Lu, Lab Chip, 2009, 9, 38–40 RSC.
- J. G. Shackman, G. M. Dahlgren, J. L. Peters and R. T. Kennedy, Lab Chip, 2005, 5, 56–63 RSC.
- M. Abkarian, M. Faivre and H. A. Stone, Proc. Natl. Acad. Sci. U. S. A., 2006, 103, 538–542 CrossRef CAS PubMed.
- M. Abkarian, M. Faivre, R. Horton, K. Smistrup, C. A. Best-Popescu and H. A. Stone, Biomed. Mater., 2008, 3, 1–13 Search PubMed.
- A. Gunther and K. F. Jensen, Lab Chip, 2006, 6, 1487–1503 RSC.
- P. Garstecki, I. Gitlin, W. DiLuzio, G. M. Whitesides, E. Kumacheva and H. A. Stone, Appl. Phys. Lett., 2004, 85, 2649–2651 CrossRef CAS.
- M. Rhee, Y. K. Light, S. Yilmaz, P. D. Adams, D. Saxena, R. J. Meagher and A. K. Singh, Lab Chip, 2014, 14, 4533 RSC.
- S. F. Clarke and J. R. Foster, Br. J. Biomed. Sci., 2012, 69, 83–93 CrossRef CAS PubMed.
- I. E. Araci, S. Baolong, S. R. Quake and Y. Mandel, Nat. Med., 2014, 20(9), 1074–1078 CrossRef CAS PubMed.
- P. H. Sonksen, S. L. Judd and C. Lowy, Lancet, 1978, 1, 729–732 CrossRef CAS.
- T. Berlin, C. Murray-Krezan and H. Yonas, SpringerPlus, 2015, 4, 10 CrossRef PubMed.
- A. J. Dawes, G. D. Sacks and H. G. Cryer, et al. , J. Trauma Acute Care Surg., 2015, 78(3), 502 Search PubMed.
- A. Aiolfi, E. Benjamin, D. Khor, K. Inaba, L. Lam and D. Demetriades, World J. Surg., 2017, 41(6), 1543–1549 CrossRef PubMed.
- R. M. Chesnut, N. Temkin and N. Carney, et al. , N. Engl. J. Med., 2012, 367(26), 2471–2481 CrossRef CAS PubMed.
- M. Shuzo, Kanagawa Daigaku Kogaku Kenkyusho Shoho, 2012, 35, 2–7 Search PubMed.
- K. Futatsuyama, T. Kawachi and T. Nakagawa, Seitai Ikogaku, 2014, 1, OS-67-PS-68 Search PubMed.
- F. Springer, R. Schlierf, J. G. Pfeffer, A. H. Mahnken, U. Schnakenberg and T. S. Rode, Eur. J. Radiol., 2007, 17(10), 2589–2597 CrossRef PubMed.
- B. Kuczenski, P. R. LeDuc and W. C. Messner, Lab Chip, 2007, 7, 647 RSC.
- B. Kuczenski, P. R. LeDuc and W. C. Messner, Lab Chip, 2007, 7, 647 RSC.
- N. Srivastava and M. A. Burns, Lab Chip, 2007, 7, 633–637 RSC.
- C. Hoera, A. Kiontke, M. Pahl and D. Belder, Sens. Actuators, B, 2018, 255, 2407–2415 CrossRef CAS.
- A. Kuoni, R. Holzherr, M. Boillat and N. F. de Rooij, J. Micromech. Microeng., 2003, 13, 103–107 CrossRef.
- W. Y. Chang, C. H. Chu and Y. C. Lin, IEEE Sens. J., 2008, 8, 495–500 CAS.
- H. P. Le, K. Shah, J. Singh and A. Zayegh, Analog Integr. Circuits Signal Process, 2006, 48, 21–31 CrossRef.
- K. Hosokawa, K. Hanada and R. Maeda, J. Micromech. Microeng., 2002, 12, 1–6 CrossRef CAS.
- K. Chung, H. Lee and H. Lu, Lab Chip, 2009, 9, 3345–3353 RSC.
- K. Chung, H. Lee and H. Lu, Lab Chip, 2009, 9, 3345–3353 RSC.
- M. J. Kohl, S. I. Abdel-Khalik, S. M. Jeter and D. L. Sadowski, Sens. Actuators, A, 2005, 118, 212–221 CrossRef CAS.
- N. Srivastava and M. A. Burns, Lab Chip, 2007, 7, 633–637 RSC.
- W. Song and D. Psaltis, Opt. Lett., 2010, 35, 3604–3606 CrossRef CAS PubMed.
- B. K. Wunderlich, U. A. Klessinger and A. R. Bausch, Lab Chip, 2010, 10, 1025–1029 RSC.
- M. Abkarian, M. Faivre and H. A. Stone, Proc. Natl. Acad. Sci. U. S. A., 2006, 103, 538–542 CrossRef CAS PubMed.
- K. Khoshmanesh, S. Y. Tang, J. Y. Zhu, S. Schaefer, A. Mitchell, K. Kalantar-zadeh and M. D. Dickey, Lab Chip, 2017, 17, 974–993 RSC.
| This journal is © The Royal Society of Chemistry 2019 |

