Detection of leucine aminopeptidase activity in serum using surface-enhanced Raman spectroscopy†
Dan
Guo
a,
Zhen-Fei
Gan
a,
Lei
Jiang
a,
Mao-Feng
Cao
a,
Fato Tano
Patrice
a,
Mahmoud Elsayed
Hafez
 ab and
Da-Wei
Li
 *a
*a
aKey Laboratory for Advanced Materials, Joint International Laboratory for Precision Chemistry & School of Chemistry and Molecular Engineering, East China University of Science and Technology, 130 Meilong Road, Shanghai 200237, China. E-mail: daweili@ecust.edu.cn
bDepartment of Chemistry, Beni Suef University, Salah Salem Street, Beni Suif 62511, Egypt
First published on 11th December 2018
Abstract
Leucine aminopeptidase (LAP), an important proteolytic enzyme, is closely associated with diverse physiological and pathological disorders such as liver injury and cancers. Hence, it is imperative to develop an effective method to detect LAP activity for early diagnosis of diseases. In this work, we report a novel SERS probe bis-s-s′-[(s)-2-amino-N-(3-thiophenyl)-Leu]. (b-(s)-ANT-Leu) with an L-leucine amide group, which can specially respond to LAP, to assay the LAP activity according to the SERS spectral changes between the probe molecule and its corresponding hydrolysis product resulting from the catalysis of LAP. This SERS approach features high selectivity on account of the specificity of the reaction combined with the instinctive fingerprinting ability of SERS and shows a good linear relationship in a wide range from 0.2 to 100 mU mL−1 with a detection limit as low as 0.16 mU mL−1. In addition, the SERS-based strategy can be competent for LAP activity detection in clinical patient serum samples and LAP inhibitor evaluation, demonstrating its great potential in the pathological analysis for diseases involving LAP and the screening of LAP inhibitors.
Introduction
Leucine aminopeptidase (LAP), a zinc-containing enzyme of the M1 and M17 peptidase families, selectively catalyzes the hydrolysis of the N-terminus in the leucine residues of proteins, peptides, or other substrates and is considered as one of the first discovered and most extensively studied aminopeptidases.1–4 Abnormal expression of LAP could greatly increase the risk of diverse physiological and pathological disorders including angiogenesis, liver dysfunction, myeloid leukemia, tumor cell proliferation, bile duct disease, and eye lens aging.5–9 Previous studies demonstrated that LAP has been employed as an important biochemical indicator in clinical practice for cancers such as ovarian malignancy, breast cancer, and liver carcinoma.5,10–12Nowadays, a variety of methods such as capillary electrophoresis (CE) combined with electrochemiluminescence (ECL),13 high-performance liquid chromatography (HPLC),14 spectroscopic colorimetry,15,16 and fluorescence techniques17–20 have been applied for detecting LAP activity. However, most of these methods face one or more shortcomings in terms of time-consuming procedures, expensive instruments, poor anti-interference capability, or low sensitivity.21,22 For example, spectroscopic colorimetry has some critical disadvantages including poor chemical stability and the lack of anti-interference ability although it is applied in the clinical assay to detect LAP activity by using L-leucine-p-nitroanilide as the substrate.23 Furthermore, a fluorometric technique coupled with an enzyme-linked immunosorbent assay (ELISA) is vulnerable to labelling-related preparations and the results are often hindered by background interference and photobleaching.24–26
Surface-enhanced Raman spectroscopy (SERS), an excellent tool for surface-sensitive analysis, is of keen interest to researchers and has widely been used in various fields of application including diagnosis and biosensing due to its ability to provide molecular fingerprint vibrational information.27 Additionally, SERS displays significant advantages including resistance to photobleaching and phototoxicity compared with fluorescence, and excellent selectivity and sensitivity.28–31 Based on these distinguished features, SERS has been broadly utilized to analyze biomolecules like proteins.32–35 For instance, the direct SERS detection of glucose oxidase and chlorocatechol dioxygenase has been achieved through using citrate reduced silver colloids as the SERS substrate,36,37 whereas the direct SERS detection of proteins in the real sample is highly challenging because most proteins have relatively low Raman scattering cross-sections and low binding affinity for the SERS substrates, as well as complicated chemical compositions and different adsorption orientations making the spectrum complicated and analysis difficult.33,38 The means using Raman-active molecules which can react with the analytes as tags could be a good strategy to overcome the challenges of the direct SERS detection of proteins.39–41 However, to the best of our knowledge, the SERS-based approach for the sensitive and selective detection of the LAP activity in serum samples has not been reported yet.
Herein, a novel type of SERS probe bis-s-s′-[(s)-2-amino-N-(3-thiophenyl)-Leu] (b-(s)-ANT-Leu) was successfully synthesized to detect LAP activity by the reaction between the L-leucine amide group and LAP.42 The probe molecule consists of an L-leucine amide moiety for specifically reacting with LAP and a disulfide (–S–S–) group to form a Ag–S coordinate bond for forcefully binding b-(s)-ANT-Leu on the silver nanoparticle (AgNP) surface. As shown in Scheme 1, in the presence of LAP, the L-leucine amide group of the b-(s)-ANT-Leu molecule is cleaved by LAP and transformed into the corresponding hydrolysis reaction product 3,3′-disulfanediyldianiline (DSDA), whose SERS spectrum is significantly different from that of the probe on AgNPs. According to the SERS signal changes, LAP activity detection can be achieved facilely through a portable Raman spectrometer. Furthermore, the presented approach could be used for the detection of LAP activity in clinical patient serum samples and LAP inhibitor evaluation, opening a new avenue to diagnose LAP-related diseases and screen LAP inhibitors.
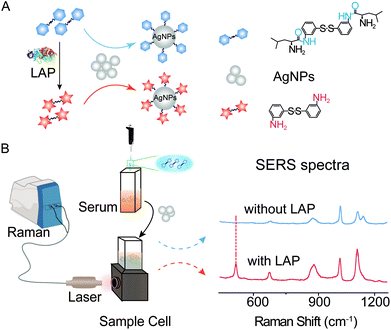 | ||
| Scheme 1 Experiment schematic and SERS spectra. (A) LAP-triggered reaction mechanism. (B) SERS detection of LAP activity in serum with AgNPs as the SERS substrate. | ||
Experimental
Reagents
All chemicals are analytical grade and solvents were purified by standard procedures. Silver nitrate (AgNO3, 99.8%), sodium citrate dihydrate (99.0%), zinc chloride (ZnCl2, 99.0%), and copper chloride (CuCl2, 99.0%) were acquired from Aladdin-Reagent Co., Ltd (Shanghai, China). Cysteine (99.0%), leucine (98.0%), glutathione (99.8%), glycine (98.5%), ascorbic acid (99.0%), tyrosinase (TYR), alkaline phosphatase (ALP), and leucine aminopeptidase (LAP, microsomal from porcine kidney) were purchased from Sigma-Aldrich Inc. (St Louis, MO, USA). Bestain was obtained from Apexbio technology Co., Ltd (Shanghai, China). Fetal bovine serum (FBS) was supplied by MoXi Biotech Co., Ltd (Shanghai, China). The LAP ELISA kit was purchased from Enzyme-linked Biotechnology Co., Ltd (Shanghai, China). Ultrapure water (18 MΩ cm) produced from a Milli-Q apparatus was used in the whole experiments.Apparatus
Dynamic light scattering (DLS) measurements were conducted by using a Zetasizer Nano ZS (Malvern Instruments, Southborough, UK). Morphology characterization of the AgNPs was performed on a scanning electron microscope (S-4800, Hitachi, Japan) at 15 kV. The UV-Vis spectrum was recorded by using a USB 2000+ UV-Vis spectrometer (Ocean Optics Inc., USA). All pH measurements were carried out with a pH-3c digital pH meter (Shanghai Leici Device Works, Shanghai, China) with a combined calomel electrode. Raman spectra at a resolution of 5 cm−1 were recorded on a portable Raman spectrometer (BWS415, B&W Tek Inc., USA) with a Thermo-Electric (TE) cooled detector for acquiring extremely high detection sensitivity, and a 785 nm laser (beam diameter = 10 μm) was used as the excitation source to induce Raman scattering because the near-infrared excitation can reduce fluorescence background from analytes.Synthesis of SERS probe
The chemical structure and synthetic route of the SERS probe are shown in Scheme S1 (ESI†). Briefly, 3-aminothiophenol (10 g, 400 mmol) dissolved in 200 mL of DMSO was subjected to the replacement reaction in the presence of an oxygen flow under stirring at 80 °C for 22 h. Then the solution was cooled to room temperature and diluted with ultrapure water. Afterwards, the organic layer was extracted with ethyl acetate and dried over anhydrous Na2SO4. The crude product was further purified using a silica gel (petroleum ether![[thin space (1/6-em)]](https://www.rsc.org/images/entities/char_2009.gif) :
:![[thin space (1/6-em)]](https://www.rsc.org/images/entities/char_2009.gif) ethyl acetate = 50
ethyl acetate = 50![[thin space (1/6-em)]](https://www.rsc.org/images/entities/char_2009.gif) :
:![[thin space (1/6-em)]](https://www.rsc.org/images/entities/char_2009.gif) 1 to 0
1 to 0![[thin space (1/6-em)]](https://www.rsc.org/images/entities/char_2009.gif) :
:![[thin space (1/6-em)]](https://www.rsc.org/images/entities/char_2009.gif) 100 in v/v) to obtain compound A. 1 equiv. of compound A, 2 equiv. of (s)-tert-butyl(2,5-dimethylhex-1-en-3-yl)carbamate, 2.2 equiv. of HATU and 6 equiv. of TEA were successively added to DMF at 0 °C and stirred at room temperature for 48 h. The reaction mixture was quenched with ultrapure water, extracted with ethyl acetate and dried over anhydrous Na2SO4. Accordingly, compound B was obtained after HPLC purification. The Boc protecting group of compound B was removed with 10 equiv. of TFA in CH2Cl2 (1 g/50 ml) at 0 °C followed by stirring for 24 h at room temperature. After evaporation treatment, the residue was slowly added to a saturated aqueous solution of NaHCO3. The precipitate was filtered, washed, and recrystallized with ethanol–water. Finally, the product as a white solid was obtained under vacuum pressure.
100 in v/v) to obtain compound A. 1 equiv. of compound A, 2 equiv. of (s)-tert-butyl(2,5-dimethylhex-1-en-3-yl)carbamate, 2.2 equiv. of HATU and 6 equiv. of TEA were successively added to DMF at 0 °C and stirred at room temperature for 48 h. The reaction mixture was quenched with ultrapure water, extracted with ethyl acetate and dried over anhydrous Na2SO4. Accordingly, compound B was obtained after HPLC purification. The Boc protecting group of compound B was removed with 10 equiv. of TFA in CH2Cl2 (1 g/50 ml) at 0 °C followed by stirring for 24 h at room temperature. After evaporation treatment, the residue was slowly added to a saturated aqueous solution of NaHCO3. The precipitate was filtered, washed, and recrystallized with ethanol–water. Finally, the product as a white solid was obtained under vacuum pressure.
Preparation of AgNPs
All the glass beakers were soaked in fresh aqua regia solution (3![[thin space (1/6-em)]](https://www.rsc.org/images/entities/char_2009.gif) :
:![[thin space (1/6-em)]](https://www.rsc.org/images/entities/char_2009.gif) 1 volume ratio of HCl
1 volume ratio of HCl![[thin space (1/6-em)]](https://www.rsc.org/images/entities/char_2009.gif) :
:![[thin space (1/6-em)]](https://www.rsc.org/images/entities/char_2009.gif) HNO3) overnight, washed three times with plenty of ultrapure water and sonicated for 60 min each time. AgNPs were synthesized by the classic Lee–Meisel method.43 Generally, 18 mg of silver nitrate solid was dissolved in 100 mL of ultrapure water, and the solution was brought to boiling by using a heating mantle for 15 min under vigorous stirring. And then, 2 mL of 1% sodium citrate solution was added to the solution within 2 min and heating was continued for an additional 30 min in the boiling state. After cooling it to room temperature, the colloidal AgNP solution was centrifuged at 6000 rpm for 5 min, resuspended in ultrapure water and finally stored in dark bottles at 4 °C for the following usage.
HNO3) overnight, washed three times with plenty of ultrapure water and sonicated for 60 min each time. AgNPs were synthesized by the classic Lee–Meisel method.43 Generally, 18 mg of silver nitrate solid was dissolved in 100 mL of ultrapure water, and the solution was brought to boiling by using a heating mantle for 15 min under vigorous stirring. And then, 2 mL of 1% sodium citrate solution was added to the solution within 2 min and heating was continued for an additional 30 min in the boiling state. After cooling it to room temperature, the colloidal AgNP solution was centrifuged at 6000 rpm for 5 min, resuspended in ultrapure water and finally stored in dark bottles at 4 °C for the following usage.
Determination of LAP activity
For the model samples prepared with phosphate buffered saline (PBS), fresh LAP solution at different concentrations (from 0.2 to 1000 mU mL−1) was incubated with 5 μM probe b-(s)-ANT-Leu in PBS (pH = 7.4, 20 mM) at 37 °C for a certain time. Afterwards, the mixture was added into the synthetic AgNP solution. The resulting mixtures were then transferred into quartz cuvettes for SERS detection.For serum samples, FBS containing different concentrations of LAP was reacted with 5 μM b-(s)-ANT-Leu to conduct the recovery experiment. Moreover, 10 μL of human serum samples collected from the Shanghai Changzheng Hospital were added to 100 μL of probe-containing PBS solution, and then followed by the SERS detection procedure similar to that mentioned above.
Evaluation of the LAP inhibitor
In order to assess the inhibition efficiency of bestain towards LAP, the newly prepared LAP solution (195 μL, 100 mU mL−1) was first treated with 5 μL bestain at different concentrations ranging from 0 to 100 μM in a water bath (37 °C, 30 min). The bestain-treated LAP solution was added to PBS (pH = 7.4, 20 mM) containing 5 μM b-(s)-ANT-Leu. The mixture solution was then incubated at 37 °C for an additional 45 min and mixed with AgNP solution to perform SERS measurement to evaluate the inhibition ability of bestatin.Results and discussion
Characterization of AgNPs
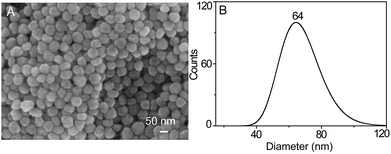
In order to accomplish the highly sensitive SERS detection, AgNPs were synthesized and characterized by SEM, UV-Vis spectroscopy, DLS, and inverted dark-field microscopy (iDFM) respectively. SEM characterization shows that the prepared AgNPs are in spherical form with a size of approximately 60 nm (Fig. 1A). Furthermore, DLS measurement with a narrow peak width at half height indicates that the AgNPs have a good dispersity with a particle size of 64 nm (Fig. 1B), which is also confirmed from the corresponding dark-field color images and the UV-Vis spectrum (Fig. S1A and S1B†). This implies that the synthesized AgNPs can have a good SERS activity in the agglomerate state under 785 nm laser excitation which is suitable for biological samples.44Responsiveness and stability of the SERS probe to LAP
The SERS probe, composed of an L-leucine amide moiety for the specific reaction with LAP and a disulfide (–S–S–) group for forcefully binding b-(s)-ANT-Leu on the AgNP surface to obtain a strong SERS response, was newly synthesized and well confirmed by 1H NMR, 13C NMR and MS (ESI) (Fig. S2–S4†). The SERS activity and LAP responsiveness of the b-(s)-ANT-Leu were investigated in PBS (pH = 7.4, 20 mM). As can be observed, a clear SERS spectrum is obtained after mixing b-(s)-ANT-Leu with AgNPs shortly (Fig. 2a), and the SERS spectrum of the probe changes dramatically in the presence of LAP (Fig. 2b). Specifically, a new strong SERS peak appears at 529 cm−1 with the simultaneous disappearance of peaks at 426 cm−1 and 1096 cm−1. Furthermore, the peak at 993 cm−1 has no distinct variation, thus making it able to serve as the reference. According to the theoretical calculation results of (s)-ANT-Leu and 3-aminothiophenol (3-ATP) as shown in Table S1,† the peak at 529 cm−1 may arise from the out-of-plane bending of NH2 mixing with the CCC ring stretching and the C–NH2 stretching, while the bands at 426 cm−1, 993 cm−1 and 1096 cm−1 can be assigned to the CCC ring rocking vibration mixing with the CCC scissoring (leucine), CCC ring stretching, and the C–NH2 stretching coupling with the CCC stretching (leucine) and the CH3 rocking vibration, respectively. These significant SERS spectral changes may be attributed to the fact that the cleavage of the L-leucine amide group is triggered by LAP thus leading to the formation of the corresponding hydrolysis reaction product 3,3′-disulfanediyldianiline (DSDA). In addition, the profile of the SERS spectrum of the hydrolysis reaction product triggered by LAP (Fig. 2b) is well consistent with that of the commercial high-purity reagent of 3-ATP (Fig. 2c), which further proves that the amide bond of the probe is cleaved by LAP causing the release of the free amino group. Moreover, further stability investigation indicates that the SERS spectra of b-(s)-ANT-Leu are almost invariable after storage over 24 h and with the pH value changing from 5.4 to 9.0 (Fig. S5 and S6†). These results infer that the synthesized probe has a high SERS responsiveness to LAP and a favourable stability for detection in biological systems, and the SERS peak at 529 cm−1 can be used as a characteristic peak to detect LAP activity.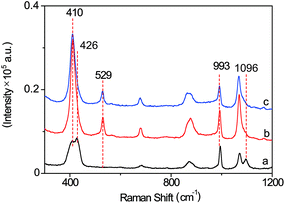 | ||
| Fig. 2 SERS spectra of b-(s)-ANT-Leu without (a) and with (b) the addition of LAP. (c) SERS spectrum of the commercial high-purity reagent of 3-aminothiophenol solution. | ||
Optimization of detection conditions
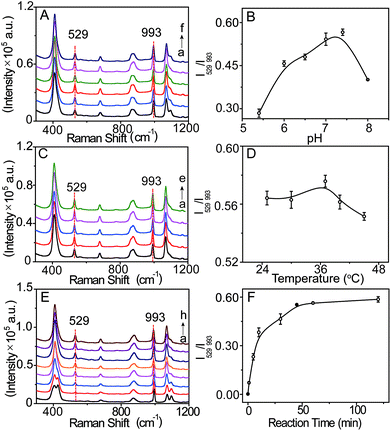
The signal intensity of the SERS probe responding to LAP is related to the b-(s)-ANT-Leu concentration which was optimized by recording its SERS spectra in the presence of LAP with the probe at different concentrations (1–10 μM). As depicted in Fig. S7,† the intensity of the SERS peak at 529 cm−1 (characteristic peak of LAP) increases rapidly with increasing b-(s)-ANT-Leu concentrations, while the peak at 993 cm−1 almost remains constant. Moreover, the ratiometric peak intensity of I529/I993 reaches a plateau after 5 μM. This may be owing to the fact that the amount of the hydrolysis reaction product of b-(s)-ANT-Leu increases along with an increase in the probe concentration, whereas a saturated SERS signal will be generated if this concentration exceeds the level required for monolayer coverage on AgNPs. Therefore, 5 μM was chosen as the optimum concentration for the probe to detect LAP activity.To further optimize the analytical conditions, the effects of pH, temperature, and reaction time were also investigated. As shown in Fig. 3A–D, upon treatment with LAP, the SERS signals and the ratiometric peak intensity of I529/I993 firstly increase and then decrease with the pH value changing from 5.0 to 8.0 and temperature ranging from 25 to 45 °C, and the maximum SERS response can be achieved under normal physiological conditions of pH 7.4 and 37 °C which agree well with the previously reported result.19 Moreover, the time-dependent SERS response of the probe towards LAP was further tested (Fig. 3E), which demonstrates that I529/I993 gradually increases with an increase in the incubation time from 0 to 45 min and closely reaches the maximum level after 45 min with the addition of 10 mU mL−1 LAP (Fig. 3F). Consequently, the physiological pH of 7.4, the incubation temperature at 37 °C, and the reaction time of about 45 min can be regarded as the optimal conditions for the SERS probe b-(s)-ANT-Leu to detect LAP activity.
Sensitivity of the SERS probe
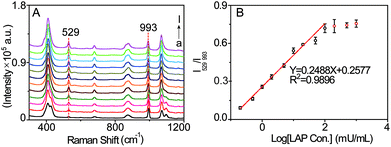
The sensitivity of the SERS probe was further studied in PBS solution (pH = 7.4, 20 mM) by measuring its SERS spectra in the presence of LAP at varied concentrations. As displayed in Fig. 4A, with increasing LAP concentration, the intensity of the SERS peak at 529 cm−1 generated by the LAP-triggered reaction increases. Whereas this SERS signal gradually tends to be invariable when the concentration of LAP is more than 200 mU mL−1, which may be ascribed to the fact that the amounts of b-(s)-ANT-Leu molecules are completely reacted by LAP at higher concentrations. Besides, there is a pseudo-linear relationship between the ratiometric peak intensity of I529/I993 and the logarithmic concentrations of LAP over the range from 0.2 to 100 mU mL−1 (Fig. 4B) and the limit of detection (LOD) is calculated to be 0.16 mU mL−1 based on a signal-to-noise ratio of S/N = 3. Since the LAP level in human serum can increase up to several fold in the diseased state,16 the wide detection range and high sensitivity of the SERS probe are required for the detection of LAP levels in biological specimens in different physiological and pathological states and capable of reducing the amount of samples significantly.Selectivity of the SERS probe
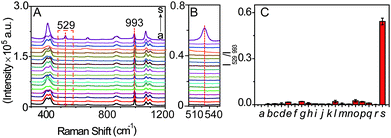
In order to verify the selectivity of the SERS probe towards LAP, the SERS response of b-(s)-ANT-Leu in the separate presence of LAP and other relevantly biological substances was measured. It can be seen from Fig. 5A–C that only LAP induces a significant SERS peak at 529 cm−1, but other biologically relevant species, including ions (Na+, K+, Mg2+, Ca2+, Cu2+, Zn2+, Fe3+), reductive species (glucose, ascorbic acid), amino acids (leucine, arginine, glycine, glutamic acid, GSH, cysteine), and protein enzymes (alkaline phosphatase (ALP), tyrosinase (TYR)) do not trigger any obvious signals at the same Raman shift. The results may stem from the synergistic effects of two main factors: the high specificity of the LAP-triggered reaction and the instinctive fingerprinting feature of the SERS technique, inferring that the synthesized SERS probe b-(s)-ANT-Leu can selectively respond to LAP in complicated serum samples under physiological conditions without apparent interference from other biological species. It is worth mentioning that sulfur-containing amino acids have no obvious influence on the selectivity of the probe b-(s)-ANT-Leu to LAP although biological thiols like GSH are reported to be able to cleave disulfide linkers.45,46 One possible reason is that the obtained SERS spectra of b-(s)-ANT-Leu are actually those after the cleavage of the disulfide linker at the Ag surface,47,48 and thus the SERS response of the probe to LAP is not significantly influenced even though the disulfide linker is prone to be cleaved by GSH.Determination of LAP in serum
To prove the feasibility of this method, the probe system was applied to the determination of LAP activity in serum samples. The recovery test in FBS spiked with different concentrations of LAP reveals that the recovery percentage of the added LAP is 100%–108% (Fig. S8 and Table S2†), which demonstrates good accuracy and reliability of the SERS probe system. Furthermore, the presented approach was verified with real human serum samples collected from the Shanghai Changzheng Hospital. As shown in Fig. S9B† and Table 1, the LAP levels in the real samples measured by this SERS approach using the calibration curve shown in Fig. 4B are highly close to those measured using the commercial ELISA kit (antibody-based colorimetric assay) with a calibration equation of Y = 0.0388X + 0.0162 (Fig. S9A†). In addition, this strategy is more convenient for LAP activity detection than the ELISA kit which involves tedious procedures and the consequent influence of enzyme activity, suggesting its great competence for effectively detecting LAP activity in diagnostics-related applications.| Sample no. | LAP level (mU mL−1) by ELISA kit assaya | LAP level (mU mL−1) by this probeb |
|---|---|---|
| a LAP level was determined by using the ELISA kit; sample 4 was 2.5-fold diluted for measurement. b LAP level was detected by using the presented SERS probe. All the serum samples were provided by the Shanghai Changzheng Hospital. | ||
| 1 | 38.86 ± 2.16 | 37.16 ± 6.39 |
| 2 | 46.13 ± 4.42 | 47.96 ± 3.69 |
| 3 | 33.79 ± 3.50 | 33.06 ± 1.51 |
| 4 | 51.38 ± 5.08 | 54.88 ± 3.84 |
| 5 | 37.72 ± 3.66 | 34.27 ± 2.03 |
| 6 | 18.95 ± 2.39 | 20.34 ± 1.23 |
| 7 | 37.32 ± 4.83 | 40.90 ± 7.16 |
| 8 | 25.25 ± 2.54 | 27.92 ± 2.89 |
Evaluation of the LAP inhibitor
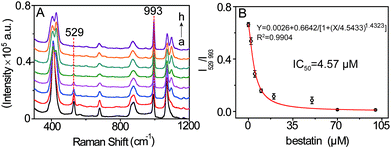
Encouraged by the achieved results, the possibility of this SERS method for evaluating the LAP inhibitor was explored by using bestain, a well-known inhibitor of LAP,19 as a model. The suitable suppression time was firstly investigated by conducting SERS detection of LAP pretreated with 2 μM bestain at different times. It is shown that the ratiometric peak intensity of I529/I993 decreases and remains almost constant after pretreating for 30 min which could be appropriate for bestain to adequately suppress LAP activity (Fig. S10†). Accordingly, the inhibition action of bestain was further evaluated by incubating different inhibitor concentrations (0 to 100 μM) with LAP for 30 min. The result shown in Fig. 6 demonstrates that a great amount of bestatin causes a higher decrease of I529/I993, meaning that the activity of LAP is inhibited gradually in a dose-dependent manner. Moreover, in this way, the IC50 value (concentration of the inhibitor that inhibits 50% LAP activity) of 100 mU mL−1 LAP is calculated to be about 4.57 μM which is well consistent with the previous result.19,23 Therefore, this SERS approach can also be capable of evaluating LAP inhibitors besides the detection of LAP activity.Conclusions
In summary, a novel SERS probe (b-(s)-ANT-Leu) combining LAP responsiveness with the SERS activity was developed. The SERS probe possesses advantages in high selectivity and resistance of background interference. Moreover, the wide detection range over 3 orders of magnitude and high sensitivity of the probe could significantly reduce the pretreatment process and the sample amount required. These features make this method competent for the detection of LAP in serums. Although there is still scope to improve the performance of automatic detection, this SERS-based strategy has great potential in LAP-related disease diagnosis and inhibitor evaluation.Conflicts of interest
The authors declare that there is no conflict of interest regarding the publication of this paper.Acknowledgements
The authors greatly appreciate the financial support from the National Natural Science Foundation of China (21575041, 21777041), the Shanghai Pujiang Program (17PJD010), the Shanghai Science and Technology Committee (17520750100), and the Fundamental Research Funds for the Central Universities (222201718001, 222201717003).Notes and references
- M. C. Chi, J. S. Liu, W. C. Wang, L. L. Lin and H. B. Huang, Biochimie, 2008, 90, 811–819 CrossRef CAS PubMed.
- M. Sakabe, D. Asanuma, M. Kamiya, R. J. Iwatate, K. Hanaoka, T. Terai, T. Nagano and Y. Urano, J. Am. Chem. Soc., 2013, 135, 409–414 CrossRef CAS PubMed.
- C. Kondo, K. Shibata, M. Terauchi, H. Kajiyama, K. Ino, S. Nomura, A. Nawa, S. Mizutani and F. Kikkawa, Int. J. Cancer, 2006, 118, 1390–1394 CrossRef CAS PubMed.
- S. Huang, Y. Wu, F. Zeng, J. Chen and S. Wu, Anal. Chim. Acta, 2018, 1031, 169–177 CrossRef CAS.
- S. Mizutani, K. Shibata, F. Kikkawa, A. Hattori, M. Tsujimoto, M. Ishii and H. Kobayashi, Expert Opin. Ther. Targets, 2007, 11, 453–461 CrossRef CAS PubMed.
- A. Taylor, FASEB J., 1993, 7, 290–298 CrossRef CAS.
- M. B. Harbut, G. Velmourougane, S. Dalal, G. Reiss, J. C. Whisstock, O. Onder, D. Brisson, S. McGowan, M. Klemba and D. C. Greenbaum, Proc. Natl. Acad. Sci. U. S. A., 2011, 108, 526–534 CrossRef PubMed.
- G. C. Van de Bittner, C. R. Bertozzi and C. J. Chang, J. Am. Chem. Soc., 2013, 135, 1783–1795 CrossRef CAS PubMed.
- Q. Gong, W. Shi, L. Li and H. Ma, Chem. Sci., 2016, 7, 788–792 RSC.
- K. Gu, Y. Liu, Z. Guo, C. Lian, C. Yan, P. Shi, H. Tian and W. H. Zhu, ACS Appl. Mater. Interfaces, 2016, 8, 26622–26629 CrossRef CAS PubMed.
- J. J. Reichling and M. M. Kaplan, Dig. Dis. Sci., 1988, 33, 1601–1614 CrossRef CAS PubMed.
- W. Jiang, Q. Fu, H. Fan, J. Ho and W. Wang, Angew. Chem., Int. Ed., 2007, 46, 8445–8448 CrossRef CAS PubMed.
- M. Su, M. Wei, Z. Zhou and S. Liu, Biomed. Chromatogr., 2013, 27, 946–952 CrossRef CAS PubMed.
- X. Xiong, A. Barathi, R. W. Beuerman and D. T. H. Tan, J. Chromatogr. B: Anal. Technol. Biomed. Life Sci., 2003, 796, 63–70 CrossRef CAS.
- R. E. Beattie, D. J. S. Guthrie, D. T. Elmore, C. H. Williams and B. Walker, Biochem. J., 1987, 242, 281–283 CrossRef CAS PubMed.
- J. A. Goldbarg and A. M. Rutenburg, Cancer, 1958, 11, 283–291 CrossRef CAS PubMed.
- T. Uete, H. Tsuchikura and K. Ninomiya, Clin. Chem., 1970, 16, 412–415 CAS.
- S. Mizukami, K. Tonai, M. Kaneko and K. Kikuchi, J. Am. Chem. Soc., 2008, 130, 14376–14377 CrossRef CAS PubMed.
- W. Zhang, F. Liu, C. Zhang, J. G. Luo, J. Luo, W. Yu and L. Kong, Anal. Chem., 2017, 89, 12319–12326 CrossRef CAS PubMed.
- P. Wu and X. P. Yan, Chem. Soc. Rev., 2013, 42, 5489–5521 RSC.
- Z. Liu and S. Liu, Anal. Bioanal. Chem., 2018, 410, 4145–4152 CrossRef CAS PubMed.
- Z. Hai, J. Wu, L. Wang, J. Xu, H. Zhang and G. Liang, Anal. Chem., 2017, 89, 7017–7021 CrossRef CAS PubMed.
- Z. Zhou, F. Wang, G. Yang, C. Lu, J. Nie, Z. Chen, J. Ren, Q. Sun, C. Zhao and W. H. Zhu, Anal. Chem., 2017, 89, 11576–11582 CrossRef CAS PubMed.
- D. W. Li, L. L. Qu, K. Hu, Y. T. Long and H. Tian, Angew. Chem., Int. Ed., 2015, 54, 12758–12761 CrossRef CAS PubMed.
- R. A. Hoebe, C. H. Van Oven, T. W. J. Gadella, P. B. Dhonukshe, C. J. F. Van Noorden and E. M. M. Manders, Nat. Biotechnol., 2007, 25, 249–253 CrossRef CAS PubMed.
- J. E. Hutti, E. T. Jarrell, J. D. Chang, D. W. Abbott, P. Storz, A. Toker, L. C. Cantley and B. E. Turk, Nat. Methods, 2004, 1, 27–29 CrossRef CAS PubMed.
- A. Lee, G. F. S. Andrade, A. Ahmed, M. L. Souza, N. Coombs, E. Tumarkin, K. Liu, R. Gordon, A. G. Brolo and E. Kumacheva, J. Am. Chem. Soc., 2011, 133, 7563–7570 CrossRef CAS PubMed.
- B. Sharma, R. R. Frontiera, A. I. Henry, E. Ringe and R. P. Van Duyne, Mater. Today, 2012, 15, 16–25 CrossRef CAS.
- A. Campion and P. Kambhampati, Chem. Soc. Rev., 1998, 27, 241–250 RSC.
- Y. Wang, B. Yan and L. Chen, Chem. Rev., 2013, 113, 1391–1428 CrossRef CAS PubMed.
- S. Schlücker, Angew. Chem., Int. Ed., 2014, 53, 4756–4795 CrossRef PubMed.
- N. Feliu, M. Hassan, E. Garcia Rico, D. Cui, W. Parak and R. Alvarez-Puebla, Langmuir, 2017, 33, 9711–9730 CrossRef CAS PubMed.
- C. Zong, M. Xu, L. J. Xu, T. Wei, X. Ma, X. S. Zheng, R. Hu and B. Ren, Chem. Rev., 2018, 118, 4946–4980 CrossRef CAS PubMed.
- S. J. He, K. K. Liu, S. Su, J. Yan, X. H. Mao, D. F. Wang, Y. He, L. J. Li, S. P. Song and C. H. Fan, Anal. Chem., 2012, 84, 4622–4627 CrossRef CAS PubMed.
- Y. Q. Wang, B. Yan and L. X. Chen, Chem. Rev., 2013, 113, 1391–1428 CrossRef CAS PubMed.
- R. A. Copeland, S. P. A. Fodor and T. G. Spiro, J. Am. Chem. Soc., 1984, 106, 3872–3874 CrossRef CAS.
- J. B. Broderick, M. J. Natan, T. V. O'Halloran and R. P. Van Duyne, Biochemistry, 1993, 32, 13771–13776 CrossRef CAS PubMed.
- K. C. Bantz, A. F. Meyer, N. J. Wittenberg, H. Im, Ö. Kurtuluş, S. H. Lee, N. C. Lindquist, S. H. Oh and C. L. Haynes, Phys. Chem. Chem. Phys., 2011, 13, 11551–11567 RSC.
- Y. C. Cao, R. Jin, J. M. Nam, C. S. Thaxton and C. A. Mirkin, J. Am. Chem. Soc., 2003, 125, 14676–14677 CrossRef CAS PubMed.
- K. Faulds, L. Stewart, W. Smith and D. Graham, Talanta, 2005, 67, 667–671 CrossRef CAS PubMed.
- P. Li, B. B. Ma, L. B. Yang and J. H. Liu, Chem. Commun., 2015, 51, 11394–11397 RSC.
- M. Tsujimoto, Y. Goto, M. Maruyama and A. Hattori, Heart Failure Rev., 2008, 13, 285–291 CrossRef CAS PubMed.
- P. C. Lee and D. Meisel, J. Phys. Chem., 1982, 86, 3391–3395 CrossRef CAS.
- M. Aioub, B. Kang, M. A. Mackey and M. A. El-Sayed, J. Phys. Chem. Lett., 2014, 5, 2555–2561 CrossRef CAS PubMed.
- X. M. Wu, X. R. Sun, Z. Q. Guo, J. B. Tang, Y. Q. Shen, T. D. James, H. Tian and W. H. Zhu, J. Am. Chem. Soc., 2014, 136, 3579–3588 CrossRef CAS PubMed.
- C. X. Yan, Z. Q. Guo, Y. Y. Shen, Y. Chen, H. Tian and W. H. Zhu, Chem. Sci., 2018, 9, 4959–4969 RSC.
- E. López-Tobar, B. Hernández, M. Ghomi and S. Sanchez-Cortes, J. Phys. Chem. C, 2013, 117, 1531–1537 CrossRef.
- L. H. Dubios and R. G. Nuzzo, Annu. Rev. Phys. Chem., 1992, 43, 437–463 CrossRef.
Footnote |
| † Electronic supplementary information (ESI) available: Experimental details and supplementary figures. See DOI: 10.1039/c8an02182a |
| This journal is © The Royal Society of Chemistry 2019 |

