
Inherently targeted estradiol-derived carbon dots for selective killing of ER (+) breast cancer cells via oridonin-triggered p53 pathway activation†
Aftab Hossain
Khan
,
Ambalika
Basak
,
Afreen
Zaman
and
Prasanta Kumar
Das
 *
*
School of Biological Sciences, Indian Association for the Cultivation of Science, Jadavpur, Kolkata – 700 032, India. E-mail: bcpkd@iacs.res.in
First published on 16th October 2024
Abstract
One of the most prevalent cancers globally is breast cancer and approximately two thirds of the breast cancers are hormone receptor positive with estrogen receptors (ER) being a prominent target. Notably, p53 that controls several cellular functions and prevents tumor formation, gets suppressed in breast cancers. Reactivation of p53 can lead to cell cycle arrest as well as apoptosis. Therefore, targeting the estrogen receptor for selective delivery of anticancer drugs that can reactivate p53 in ER (+) breast cancers can be a crucial method in breast cancer therapy. Herein, we have designed and developed estradiol-derived inherently targeted specific carbon dots (E2-CA-CD) from 17β-estradiol and citric acid following a solvothermal method. The synthesized carbon dots were characterized using spectroscopic and microscopic techniques. The water soluble, intrinsically fluorescent E2-CA-CD showed excellent biocompatibility in MCF-7, MDA-MB-231 as well as NIH3T3 cells and demonstrated target specific bioimaging in ER (+) MCF-7 cells due to the overexpressed ER receptors. Furthermore, oridonin, a well-known hydrophobic anticancer drug capable of upregulating the p53 pathway, was loaded on the carbon dots to increase its bioavailability. E2-CA-CD-Ori caused ∼2.2 times higher killing in ER (+) MCF-7 cells compared to ER (−) MDA-MB-231 cells and normal cells NIH3T3. Also, E2-CA-CD-Ori showed ∼3 fold better killing in MCF-7 cells compared to native oridonin. E2-CA-CD-Ori-induced killing of MCF-7 cells took place through the early to late apoptotic pathway along with the elevation of the intracellular ROS level. Importantly, E2-CA-CD-Ori triggered the activation of the p53 pathway in MCF-7 cells, which in turn induced apoptosis involving the upregulation of Bax and downregulation of Bcl-2 leading to the selective and efficient killing of ER (+) MCF-7 cells.
1. Introduction
Breast cancer, predominantly affecting women, stands out as the most prevalent type of cancer diagnosed globally with an estimated 2.26 million cases recorded in 2020.1 Breast cancer cells are categorized according to their stage of progression, level of aggressiveness, and hormonal receptor status. Three distinct classes of hormone receptor profiles that commonly exhibit overexpression in breast cancer are, (1) estrogen receptor (ER)/progesterone receptor (PR), (2) human epidermal growth factor receptor 2 (HER2) and (3) triple-negative breast cancers (TNBC) characterized by the absence of any of these three receptors.2,3 Among all types of breast cancers, about 70% are hormone receptor positive. Therefore, estrogen receptors have become a prominent target for selective delivery of anticancer drugs to ER (+) breast cancers.Existing therapeutic strategies such as chemotherapy and radiotherapy are the most prevalent treatment procedures, but also have severe side effects and exhibit resistance to the existing drugs resulting in reappearance of aggressive secondary tumors.4,5 Several efforts have been made for target-specific delivery of anticancer drugs by means of different delivery vehicles, which includes liposomes, polymeric micelles, nanogels, carbon nanotubes, graphene oxides, etc.6–14 In this context, the development of diagnostic probes combined with targeted drug delivery will enhance therapeutic efficacy in cancer treatment.15,16 Nanoparticle-based theranostic agents such as quantum dots and silica nanoparticles have gathered significant attention.17–19 However, the poor aqueous solubility and inadequate cellular tolerance limit their usage as delivery vehicles.20,21 In this regard, carbon dots with intrinsic fluorescence, photostability and potential biocompatibility have made significant contributions in biomedicine, bioimaging, sensing, drug delivery and others.22–31
Carbon dots are zero-dimensional carbon allotropes that exhibit excellent physical and chemical properties.32 Ease of synthesis and tailor-made surface functionalization of carbon dots make them task specific to be used for cell staining and cargo delivery vehicles.33,34 Herein, 17β-estradiol has been chosen as the precursor for carbon dot preparation. 17β-Estradiol is a ligand of the well-known intracellular steroid receptors, which binds to the estrogen receptors and controls several important intracellular events connected to the overexpression of proteins linked to the proliferation of ER (+) breast cancer cells (cyclin D1, p53) and angiogenesis.35,36
p53, known as the “guardian of the genome”, plays a pivotal role in regulating cellular functions and inhibiting tumorigenesis, particularly in breast cancer.37 Alterations in the Tp53 (tumor protein p53) gene affect p53 activity, either via mutations or overexpression of negative regulators like MDM2 or MDMX.38 To counter this, several therapeutic strategies have been developed to reactivate the p53 pathway.38 Oridonin, derived from Rabdosia rubescens, has shown potential in activating the p53 pathway leading to cell cycle arrest and apoptosis in cancer cells.39 However, oridonin could not be exploited to its fullest ability in cancer therapy due to poor aqueous solubility and lack of target specificity.40 To this end, oridonin will be loaded into estradiol-derived carbon dots to impart target specificity and increase bioavailability.
To date, there are few reports on estradiol functionalized nano vehicles such as nanogels, polymersomes, liposomes and so on for targeting ER (+) cell lines.41,42 Estradiol has been mostly conjugated with different nanocarriers to make it target specific. Sarkar et al. reported estradiol hemisuccinate-modified carbon dots as a target specific theranostic agent for MCF-7 cells.43 However, there is no such report where estradiol itself has been used to prepare intrinsically fluorescent and inherently target-specific carbon dots. Herein, we have developed estradiol-derived carbon dots (E2-CA-CD) from a mixture of 17β-estradiol and citric acid following solvothermal method. Physicochemical characteristics of the synthesized carbon dots were explored using spectroscopic and microscopic techniques. Leveraging 17β-estradiol as a natural ligand for the ER receptors, E2-CA-CD was utilized as a target specific diagnostic probe for ER (+) breast cancer cells. The anticancer drug oridonin was successfully encapsulated within E2-CA-CD. Oridonin-loaded E2-CA-CD (E2-CA-CD-Ori) showed ∼2.0-fold higher killing against ER (+) MCF-7 cells compared to ER (−) MDA-MB-231 cells, as well as non-cancerous NIH3T3 cells. Moreover, it exhibited ∼3-fold higher cytotoxicity to MCF-7 cells compared to native oridonin. The enhanced anticancer effect of the E2-CA-CD-Ori complex was found to be attributed to the upregulation of the p53 pathway, inducing apoptosis in ER (+) breast cancer cells.
2. Experimental section
2.1 Materials
17β-Estradiol, formamide and citric acid were purchased from Sigma Aldrich, Merck and SRL, India, respectively. All the solvents were bought from SRL, India and Sigma Aldrich, respectively. Cell culture reagents, the LIVE/DEAD viability kit and the annexin V-FITC apoptosis kit were purchased from Invitrogen. Oridonin was purchased from BLD chemicals. Snakeskin dialysis tubing (3.5 KDa MWCO) was purchased from Thermo Scientific. All the experiments were performed using Milli-Q water. MCF-7, MDA-MB-231 and NIH3T3 cells were purchased from NCCS, Pune. Fluorescence, UV-vis and FTIR spectra were recorded using an Agilent Cary Eclipse, Agilent Cary 60 and PerkinElmer Spectrum 100, respectively. Zeta potential of the carbon dots was measured using a Nano-ZS of Malvern Instruments Limited. A telsonic bath sonicator was used to perform bath sonication.2.2 Synthesis of estradiol-derived carbon dots
Estradiol-derived carbon dots (E2-H-CD) were in the absence of any additive synthesized from 17β-estradiol hydrothermally by dissolving 17β-estradiol in conc. NaOH followed by heating in an autoclave chamber at 180 °C for 6 h. The carbon dots were purified through dialysis and solid carbon dots were obtained after lyophilization (Scheme S1, ESI†). Estradiol-derived carbon dots (E2-CD and E2-CA-CD) were also prepared following a solvothermal method using formamide as a solvent.44 In brief, 17β-estradiol was dispersed in formamide using bath sonication and transferred to a Teflon-coated stainless steel autoclave chamber. Then it was heated at 180 °C for 10 h. The solution was cooled down to room temperature, redispersed in ethylacetate followed by centrifugation at 15![[thin space (1/6-em)]](https://www.rsc.org/images/entities/char_2009.gif) 000 rpm for 30 min at 4 °C. The same process was repeated thrice. Finally, the dark brown precipitate was redispersed in distilled water and a brown coloured solution was obtained after removing the insoluble particles through filtration. The brown coloured solution was lyophilized to get E2-CD and stored at −20 °C for further experiments (Scheme S2, ESI†). A similar procedure was followed to prepare E2-CA-CD from 17β-estradiol (50 mg) and citric acid (50 mg) via a solvothermal method using formamide as a solvent (Scheme 1 and Scheme S3, ESI†).
000 rpm for 30 min at 4 °C. The same process was repeated thrice. Finally, the dark brown precipitate was redispersed in distilled water and a brown coloured solution was obtained after removing the insoluble particles through filtration. The brown coloured solution was lyophilized to get E2-CD and stored at −20 °C for further experiments (Scheme S2, ESI†). A similar procedure was followed to prepare E2-CA-CD from 17β-estradiol (50 mg) and citric acid (50 mg) via a solvothermal method using formamide as a solvent (Scheme 1 and Scheme S3, ESI†).
 | ||
| Scheme 1 Solvothermal preparation of E2-CA-CD from 17β-estradiol and citric acid. | ||
2.3 Characterization of estradiol derived carbon dots
The size and morphology of the synthesized E2-H-CD, E2-CD and E2-CA-CD dots were studied using a JEOL JEM 2100F UHR microscope. For this, 5 μL of each carbon dot solution (50 μg mL−1) was drop cast on a carbon coated 300 mesh copper grid and kept overnight. Finally, the grid was kept under vacuum for 4 h before imaging under a transmission electron microscope. For atomic force microscopic analysis, 20 μL of E2-CA-CD solution was drop cast on a fresh mica surface and dried overnight. AFM images were taken using an Asylum Research MFP-3D in non-contact mode after keeping the sample under vacuum for 4 h prior to imaging. Zeta (ζ) potential of the aqueous solution of E2-CA-CD was measured using a Zetasizer (Malvern Instruments, UK). X-Ray diffraction spectra of dried E2-CA-CD on a glass slide were obtained using a Bruker D8 Advance X-ray diffractometer having CuKα radiation (α = 0.15406 nm) as the source (voltage and current was 40 kV and 30 mA, respectively).2.4 UV-Visible study
The UV-Vis spectrum of E2-CA-CD was obtained using an Agilent Cary 60 spectrophotometer. Absorption spectra of E2-CA-CD (50 μg mL−1) were recorded in a quartz cell (path length 10 mm) keeping the temperature constant at 25 °C using a Peltier thermostat.2.5 Fluorescence study
An Agilent Cary Eclipse luminescence spectrometer was utilized for recording excitation-dependent emission spectra of E2-H-CD (125 μg mL−1), E2-CD (25 μg mL−1) and E2-CA-CD (25 μg mL−1) by varying λex from 250 to 320 nm in the case of E2-H-CD, and from 250 to 350 nm for both E2-CD and E2-CA-CD (excitation and emission slits at 5 nm). The temperature was kept constant at 25 °C during the experiment by using a Peltier thermostat.2.6 FTIR study
In order to get the FTIR spectra of E2-CA-CD and native 17β-estradiol, at first KBr pellets of the respective samples were prepared by mixing the KBr powder with the samples followed by compressing at higher pressure for 5 min. Finally, the spectra were recorded using a PerkinElmer Spectrum 100 spectrometer within the range of 4000–500 cm−1.2.7 Quantum yield measurement
Quantum yield of E2-CA-CD was determined relative to an optical dilute standard fluorophore quinine sulfate solution having a well-established quantum yield (ϕs). The Parker–Rees method was utilized to determine the quantum yields (ϕu) of the unidentified fluorophore. | (1) |
2.8 Cell culture
ER (+) breast cancer cells MCF-7, ER (−) breast cancer cells MDA-MB-231, and non-cancerous cells NIH3T3 were cultured in DMEM (high glucose) containing 10% FBS and antibiotics (100 mg L−1 streptomycin and 100 IU mL−1 penicillin). Cells were grown in a 25 mL cell culture flask and kept in a humidified atmosphere of 5% CO2 at 37 °C. Subculture of all the cells was performed every 2 days by replacing FBS-supplemented media. The adherent cells were detached from the surface of culture flask by using trypsin after 75–80% confluence of the cultured cells. These cells were utilized for further cellular studies.2.9 Cytocompatibility assay
Cytocompatibility of the synthesized E2-CA-CDs in MCF-7, MDA-MB-231 and NIH3T3 cells was examined using the MTT reduction method. In this method, mitochondrial dehydrogenase of alive cells converts tetrazolium salt into a water insoluble formazan product. The quantity of the formazan was estimated by measuring its absorbance value after dissolving in DMSO. The amount of formazan produced is directly related to the number of live cells. Prior to the assay, MCF-7, MDA-MB-231, and NIH3T3 cells were separately cultured in a 96-well plate with 15000 cells per well in a humidified atmosphere of 5% CO2 at 37 °C. When the cell concentration reached ∼70% confluency, cells were supplemented with fresh medium and varying concentrations of E2-CA-CD (5–500 μg mL−1) were added. The cells were incubated in the presence of E2-CA-CDs for 24 h followed by incubation with 5 mg mL−1 MTT dye for 4 h. SpectraMax iD5 was utilized to measure the absorbance of the produced formazan after dissolving in DMSO at 570 nm. The number of alive cells can be calculated using the following equation:| % viability = {(A570 (treated cells) − background)/(A570 (untreated cells) − background)} × 100. | (2) |
2.10 Bioimaging
ER (+) breast cancer cells MCF-7, ER (−) breast cancer cells MDA-MB-231 and noncancerous NIH3T3 were cultured (1 × 10⁴ cells per well) in a chamber slide. E2-CA-CDs were added to the chamber slide of all the three types of cells for 12 h incubation in a humidified atmosphere of 5% CO2 at 37 °C. After incubation, the cells were washed with PBS (pH = 7.4) two times. Then, the cells were fixed using 4% paraformaldehyde solution for 30 min followed by mounting with 50% glycerol. The cells on the slide were covered and kept for 24 h before imaging. Finally, images were taken using an Olympus IX83 inverted microscope under 20× magnification.2.11 Loading of oridonin
To the aqueous solution of E2-CA-CDs (2 mg mL−1), oridonin solution in DMSO (1 mg mL−1) was added and stirred for 24 h. Then, the solution was dialysed again Milli-Q using SnakeSkin 3.5 KDa MWCO dialysis tubing for 3 h. UV-Vis absorbance of the solution was recorded and the drug loading efficiency was calculated using the standard calibration curve of oridonin| y = 0.02229x − 0.0157 | (3) |
| Drug loading efficiency (DLE) = [amount of drug loaded in nanocarrier/amount of drug taken] × 100. | (4) |
2.12 Cytotoxicity assay
The MTT reduction method was again employed to examine killing of ER (+) breast cancer cells MCF-7, ER (−) breast cancer cells MDA-MB-231 and non-cancerous cells NIH3T3 in the presence of oridonin-loaded E2-CA-CD (E2-CA-CD-Ori) and native oridonin. MCF-7, MDA-MB-231 and NIH3T3 cells were individually grown in 96 well (2 × 10⁴ cells per well) plates under a humidified atmosphere at 37 °C and 5% CO2. The cells were supplemented with fresh culture medium upon 70% confluency and treated with varying concentrations of E2-CA-CD-Ori (5–500 μg mL−1) as well as native oridonin (5–150 μg mL−1). After 24 h of incubation, the cell killing percentage was determined by employing the microculture MTT reduction method, which utilizes the following equation| % cell killing = 100 − [(A570(treated cells) − background)/A570(untreated cells) − background) × 100]. | (5) |
2.13 LIVE/DEAD viability assay
Cytocompatibility of MCF-7, MDA-MB-231 and NIH3T3 cells in the presence of E2-CA-CD and E2-CA-CD-Ori were examined by LIVE/DEAD assay kit (for eukaryotic cells) as reported earlier. The LIVE/DEAD assay kit contains a mixture of two nucleic acid binding stains, calcein AM (acetomethoxy) (component A) and ethidium homodimer-1 (component B). The green fluorescence due to calcein AM indicates live cells while red fluorescence due to ethidium homodimer-1 indicates dead cells. Just before the assay, 4 μL of the provided EthD-1 solution and 1 μL of the supplied calcein AM stock solution were mixed in 2 mL of PBS buffer, and the solution was mixed properly using a vortex. The resulting mixture was then added to the MCF-7 cells treated with E2-CA-CD and E2-CA-CD-Ori for 12 h at 37 °C and incubated for 30 min. After washing with PBS twice, imaging of the cells was done in an Olympus IX83 microscope at 10× magnification. For calcein, excitation filter BP460–495 nm and a band absorbance filter covering wavelengths below 505 nm were used whereas for ethidium homodimer-1, excitation filter BP530–550 and a band absorbance filter covering wavelengths below 570 nm were used.2.14 Flow cytometry
To study the selective internalization of carbon dots, MCF-7, MDA-MB-231 and NIH3T3 cells were individually grown in well plates and incubated with E2-CA-CD (250 μg mL−1) for 12 h in a humidified atmosphere at 37 °C. After incubation, all the cells were washed with PBS buffer to remove the excess compounds from the culture medium and detached from the culture plates using a cell scraper. Cell pellets were obtained after centrifugation for 5 min, which were again suspended in 500 μL PBS for flow cytometry using a BD FACS Aria III flow cytometer.Again, a flow cytometric assay using annexin V-FITC/PI staining was performed in order to study the mechanism of E2-CA-CD-Ori-mediated cancer cell death. In brief, MCF-7 cells were grown in culture plates and treated with native E2-CA-CD or E2-CA-CD-Ori each at a concentration of 250 μg mL−1 and native oridonin at a concentration of 75 μg mL−1 for 12 h. Next, the cells were detached using a cell scraper and pellets were obtained by centrifugation at 2000g for 5 min at 4 °C followed by washing with cold PBS. The cell pellets were re-suspended in binding buffer (100 μL) at a concentration of 1 × 10⁶ cells per mL followed by incubation with annexin V/FITC (5 μL) and PI (5 μL) in the dark for 15 min at room temperature. Finally, 400 μL of binding buffer was added to each of the tubes and the samples were analyzed for E2-CA-CD-Ori-induced cancer cell apoptosis by a BD FACS Aria III flow cytometer, at λex = 488 nm and λem = 533 ± 30 nm (FL-1) bandpass filter for annexin V-FITC and 585 ± 40 nm (FL-2) bandpass filter for PI.
2.15 Nuclear condensation study by Hoechst 33342 staining
In MCF-7 cells, nuclear condensation study was performed by staining the nuclei with Hoechst 33342 dye (Invitrogen). This dye diffuses across the undamaged cellular membrane followed by binding to cellular DNA that enables the identification of nuclear condensation, which is a characteristic feature of apoptosis. For this experiment, MCF-7 cells were incubated with E2-CA-CD (250 μg mL−1), E2-CA-CD-Ori (250 μg mL−1) and native oridonin (75 μg mL−1) for 12 h. Next, the cells were incubated with Hoechst 33342 for 10 min at 37 °C after washing with PBS in the dark. After incubation, the cells were thoroughly washed with PBS and imaging was carried out using an Olympus IX83 inverted fluorescence microscope at 40× magnification.
2.16 Measurement of intracellular reactive oxygen species (ROS)
Reactive oxygen species (ROS) play a crucial role in shaping the tumor microenvironment (TME) and are therefore considered a promising therapeutic target for combating cancer. Dichlorofluorescein diacetate (DCFH-DA, Sigma) was used to detect ROS generation in MCF-7 cells following treatment separately with E2-CA-CD, E2-CA-CD-Ori and native oridonin for 12 h. The cancer cells were washed with PBS followed by incubation with DCFH-DA in the dark for 20 min and they were again washed with PBS thrice. Finally, fluorescence microscopy was done using an Olympus IX83 inverted fluorescence microscope at 10× magnification to observe the green fluorescence of 2′,7′-dichlorofluorescein (DCF) produced within the living cells.2.17 Immunoblotting analysis
To investigate alterations in protein translation via immunoblotting, MCF-7 cells were cultured at a cell density of 2 × 10⁶ cells per well. Next, the cells were separately incubated with E2-CA-CD, E2-CA-CD-Ori and native oridonin for 6 h each. After the incubation period, the wells were washed with PBS and the cells were detached using trypsinization, followed by centrifugation to obtain the cell pellets. The resulting cell pellets were lysed at 4 °C using RIPA buffer (Thermo Fisher Scientific). The protein concentration in the lysates was determined using Bradford reagent (Sigma). Subsequently, equivalent amounts of protein samples were prepared and loaded onto SDS-PAGE protein gels for electrophoresis, followed by transfer onto a polyvinylidene fluoride (PVDF) membrane. After the successful completion of the transfer step, the PVDF membrane was blocked at room temperature for one hour and finally incubated with the primary antibody overnight at 4 °C. Before secondary incubation, the membrane was thoroughly washed with 0.1% Tween 20 in tris buffer saline (TBST) and subjected to secondary antibody incubation for 1 h at room temperature. Afterwards, the membrane was washed again with TBST, and finally the protein bands were detected using an electrochemiluminescence (ECL) assay.3. Results and discussion
Breast cancer, one of the major global health problems, is affecting millions of individuals annually. This cancer has the characteristics of various hormone receptor profiles, with estrogen receptors being a prominent target for treating breast cancers. Several nanoparticles have been explored for targeted drug delivery to overcome the limitations of current therapies like chemotherapy and radiotherapy.17–19 However, some of them suffer from drawbacks like poor solubility, metal toxicity and so on.20,21 Carbon dots, a novel carbon allotropes, have received due importance as a delivery vehicle because of their ease of customization, biocompatibility and intrinsic fluorescence properties.45,46 Estradiol has been explored in different instances in targeted therapy by means of nanomaterial-based delivery vehicles (liposome, nanogels, nanoparticle, etc). In most of the cases, estradiol has been conjugated with the various transporters for targeted drug delivery. However, estradiol itself has not been used to prepare inherently target specific carbon dots. In the present study, we aim to synthesize carbon dots derived from 17β-estradiol to serve as a targeted cellular transporter in breast cancer therapy with specific focus on delivering the encapsulated drug to ER (+) cancer cells. 17β-Estradiol is a well-known ligand of steroid receptors, and is overexpressed in ER (+) cancer cells, which induces conformational changes and subsequent release of molecular chaperones. This process triggers the transcription of various genes, stimulating mammary cell proliferation, which can lead to increased cell division, DNA replication, and mutations. Concurrently, we tried to target p53 dysfunction, a tumor suppressor protein often dysregulated in breast cancer, using small molecule compounds like oridonin. Utilization of oridonin often gets limited due to its poor aqueous solubility and bioavailability, which may be overcome through encapsulation in the 17β-estradiol-derived carbon dots.3.1 Synthesis and characterization of estradiol-derived carbon dots
17β-Estradiol, a potent estrogen, primarily produced in the ovaries, plays a pivotal role in regulating various physiological processes.35 Hence, we intend to use 17β-estradiol-derived carbon dots as a target specific theranostic agent for ER (+) breast cancers.At first, we tried to prepare 17β-estradiol-derived carbon dots by a hydrothermal method. Since 17β-estradiol is insoluble in aqueous media, we tried to solubilize it using conc. NaOH solution and heating it in a Teflon-coated stainless steel autoclave chamber at 180 °C for 6 h (Scheme S1, ESI†) followed by purification through dialysis. The carbon dots obtained from this method (E2-H-CD) showed blue fluorescence at λem = 365 nm upon excitation at λex = 280 nm (Fig. S1a, ESI†). However, E2-H-CD suffered from lower solubility and less stability in the aqueous medium probably due to larger sized aggregated (∼20 nm) carbon dots as observed in the TEM image (Fig. S1b, ESI†). Hence, E2-H-CD could not be used for further experiments. To overcome the solubility hurdle, we tried to disperse the estradiol in organic solvents such as formamide following a previously reported solvothermal method44 and heated in a Teflon-coated stainless steel autoclave chamber at 180 °C for 10 h (Scheme S2, ESI†). The prepared carbon dots (E2-CD) were purified through centrifugation followed by filtration. The fluorescence intensity of the obtained carbon dots was found to be considerably low (Fig. S2, ESI†) having emission maxima in the blue range, λem = 336 nm, upon excitation at λex = 310 nm (Fig. S2, ESI†) and showed blue emission under UV torch irradiation. These poorly formed carbon dots could not be characterized by TEM. Thus, E2-CD may not be suitable for cellular applications.
Hence, estradiol-derived carbon dots (E2-CA-CD) were synthesized in a slightly modified protocol from 17β-estradiol and citric acid (1:1 weight ratio) as a carbon source and functionalizing agent by a solvothermal method using formamide as a solvent (Scheme 1 and Scheme S3, ESI†).44 The obtained carbon dots were purified through centrifugation followed by filtration. The carbon dot E2-CA-CD was completely soluble in water and the zeta potential value was found to be −11.8 mV, which signifies good stability of the carbon dots in aqueous media. The estradiol-derived carbon dots E2-CA-CD showed blue fluorescence in the visible region under UV torch irradiation (Fig. S3, excitation at 365 nm, ESI†). All further experiments were carried out using E2-CA-CD.
 | ||
| Fig. 1 (a) FEG-TEM image, (b) high resolution FEG-TEM image and (c) AFM image of E2-CA-CD. | ||
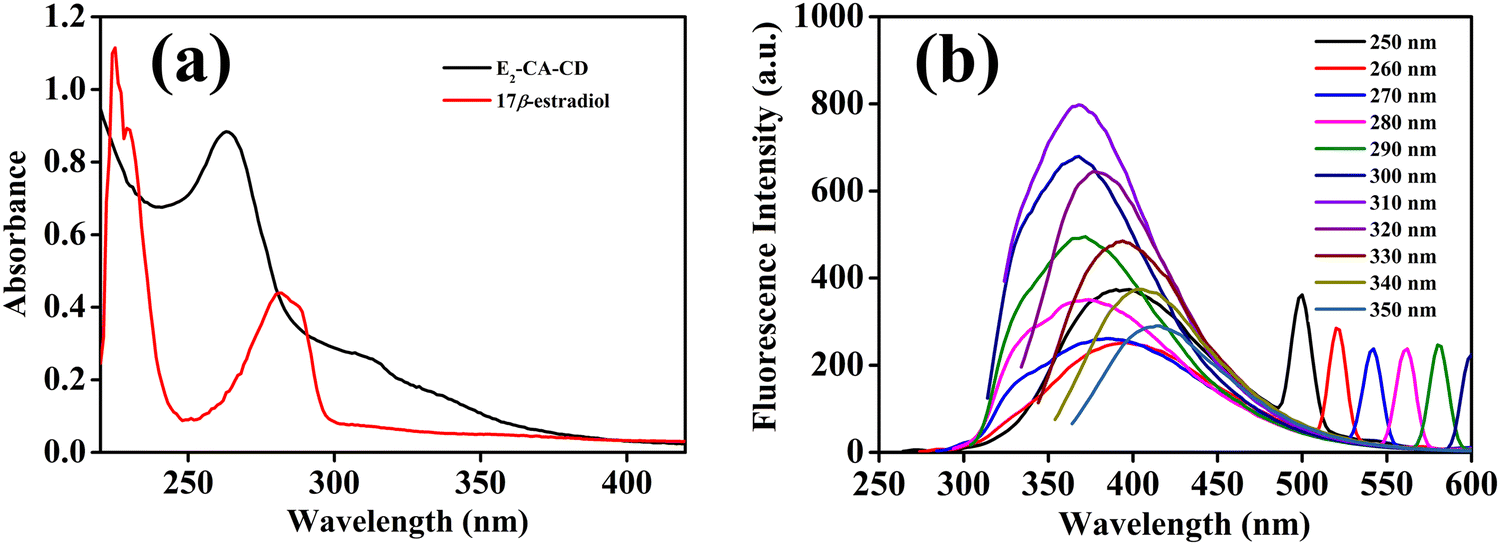 | ||
| Fig. 2 UV-Vis spectra of (a) E2-CA-CD and native 17β-estradiol, and (b) fluorescence spectra of E2-CA-CD. | ||
![[double bond, length as m-dash]](https://www.rsc.org/images/entities/char_e001.gif) C bond of the aromatic rings. The spectra of E2-CA-CD contain characteristic peaks at ∼1300 cm−1 and at ∼1000 cm−1 that correspond to the C–O stretching frequency and aromatic C–H out of plane bending frequency, which were also present in the spectra of 17β-estradiol. However, in the case of E2-CA-CD, the peaks got shifted to higher frequency probably due to the involvement of H-bonding interaction (Fig. 3a).49 FTIR spectra further confirmed the successful formation of E2-CA-CD dots with retention of the functional groups of 17β-estradiol. XRD analysis was done for further characterization of E2-CA-CD. From the XRD spectrum of E2-CA-CD, a peak ranging from 20° to 25° was observed, which indicates the amorphous nature of the carbon dots (Fig. 3b).
C bond of the aromatic rings. The spectra of E2-CA-CD contain characteristic peaks at ∼1300 cm−1 and at ∼1000 cm−1 that correspond to the C–O stretching frequency and aromatic C–H out of plane bending frequency, which were also present in the spectra of 17β-estradiol. However, in the case of E2-CA-CD, the peaks got shifted to higher frequency probably due to the involvement of H-bonding interaction (Fig. 3a).49 FTIR spectra further confirmed the successful formation of E2-CA-CD dots with retention of the functional groups of 17β-estradiol. XRD analysis was done for further characterization of E2-CA-CD. From the XRD spectrum of E2-CA-CD, a peak ranging from 20° to 25° was observed, which indicates the amorphous nature of the carbon dots (Fig. 3b).
 | ||
| Fig. 3 (a) FTIR spectra of 17β-estradiol and E2-CA-CD, and (b) XRD spectra of E2-CA-CD. | ||
3.2 Cytocompatibility of E2-CA-CD
Before proceeding to the biological experiments, the cytocompatibility of the newly synthesized E2-CA-CD was checked in different cell lines using the MTT assay. Varying concentrations of E2-CA-CD (5–500 μg mL−1) were added to the ER (+) MCF-7 cells, ER (−) MDA-MB-231 cells and non-cancerous NIH3T3 cells and incubated for 24 h. The results confirmed negligible toxicity of E2-CA-CD towards all three cell lines (Fig. 4). Even at the highest concentration (500 μg mL−1), almost 80% of the cells remained viable (Fig. 4). These results confirmed the notable biocompatibility of E2-CA-CD, affirming its potential utilization in biomedicinal applications including cellular transportation.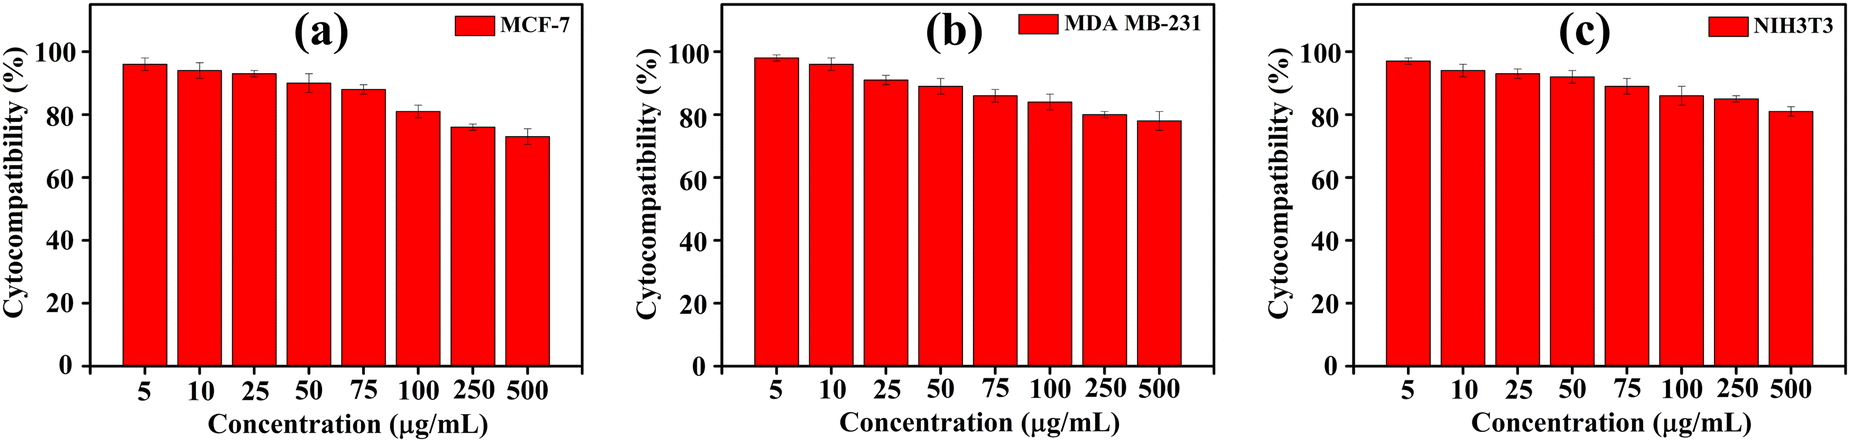 | ||
| Fig. 4 Cytocompatibility of E2-CA-CD in (a) MCF-7, (b) MDA-MB-231 and (c) NIH3T3 cells. | ||
3.3 Bioimaging
The estrogen receptor (ER) is predominantly overexpressed in estrogen-responsive organs such as ovary, uterus, and mammary glands. Overexpression of estrogen receptors in MCF-7 cells makes it a potential target for selective drug delivery to ER (+) breast cancers. To investigate the selective internalization of the synthesized carbon dots in ER (+) MCF-7 cells, a bioimaging experiment was carried out utilizing the intrinsic fluorescence properties of E2-CA-CD. ER (+) MCF-7, ER (−) MDA-MB-231 and non-cancerous NIH3T3 cells were incubated with E2-CA-CD (250 μg mL−1) for 12 h and images were taken under a fluorescence microscope at 20× magnification. Fascinatingly, in the case of ER (+) MCF-7, bright blue fluorescence was observed that confirmed the successful internalization of E2-CA-CD within MCF-7 cells (Fig. 5a and b). In the case of both ER (−) MDA-MB-231 (Fig. 5d and e) and NIH3T3 (Fig. 5g and h), no notable blue fluorescence was observed inside the cells. Estradiol-derived E2-CA-CD got easily internalized into the ER (+) MCF-7 cells owing to the overexpression of ER receptors and brightened them with blue emission. On the other hand, MDA-MB-231 cells and the non-cancerous cells NIH3T3 were unable to uptake E2-CA-CD due to the absence of ER receptors and subsequently negligible fluorescence was observed in these two cell lines. Hence selective internalization was achieved into the ER (+) cancer cells by the inherently target specific estradiol-derived carbon dots, E2-CA-CD. | ||
| Fig. 5 Brightfield and fluorescence microscopic images and corresponding flow cytometric analysis plots after 12 h of incubation with E2-CA-CD (250 μg mL−1): (a)–(c) MCF-7 cells, (d)–(f) MDA-MB-231 cells and (g)–(i) NIH3T3 cells. Scale bars correspond to 20 μm. The mean fluorescence intensity values are given in the insets. | ||
To further confirm the target specific internalization of E2-CA-CD into the MCF-7 cells in comparison to the other two cell lines, flow cytometric analysis was performed for all the investigated cell lines. In the case of MCF-7 cells, a significantly high mean fluorescence intensity value of ∼15500 was observed (Fig. 5c), while in case of ER (−) MDA-MB-231 and NIH3T3 cells, a considerably low mean fluorescence intensity value of ∼5600, ∼5950, respectively was noted (Fig. 5f and i). This indicates around three-fold better internalization of the E2-CA-CD carbon dots in the ER (+) MCF-7 cell lines compared to that of ER (−) MDA-MB-231 and NIH3T3 cells. Both fluorescence microscopic images and flow cytometric analysis delineated the target specificity of the E2-CA-CD towards ER (+) positive cell lines, which subsequently endorsed the utilization of E2-CA-CD as a biolabeling probe towards ER-receptor expressing cancer cells.
3.4 Oridonin loading
After ensuring the selective targeting ability of the E2-CA-CD, we were intrigued to analyze the drug loading capacity of the carbon dots as well as the specific killing of the ER (+) cells over ER (−) as well as non-cancerous cells. Oridonin has been chosen as the anticancer drug because of its potential in activating the p53 pathway leading to cell cycle arrest, and apoptosis in cancer cells.39 Utilization of oridonin in cancer therapy often gets limited due to its poor aqueous solubility.40 To this end, oridonin solution in DMSO-water (1 mg mL−1) was mixed with aqueous carbon dot solution (2 mg mL−1) and stirred overnight at 4 °C. Subsequently, the mixture solution was dialyzed for 3 h against Milli-Q water to separate the unloaded oridonin from the drug-loaded carbon dots. The successful loading of the drug was confirmed from UV-vis spectroscopy (Fig. S4a, ESI†) and the loading efficiency was found to be 84% calculated using the standard calibration curve of oridonin (Fig. S4b, ESI†).In order to confirm the successful loading of the drug, the UV-vis spectrum of oridonin loaded E2-CA-CD was compared with the UV spectra of native oridonin and E2-CA-CD. Oridonin showed a characteristic UV-vis absorption maximum at λmax = 242 nm and E2-CA-CD exhibited absorbance maximum at λmax = 263 nm (Fig. 6). In the case of oridonin loaded E2-CA-CD, two peaks of both carbon dots and oridonin were observed in the similar absorbance range, which indicated the successful loading of oridonin (Fig. 6). Probably, the adsorption of hydrophobic oridonin on the surface of the E2-CA-CD dots facilitated its encapsulation within the nano-vehicle.
 | ||
| Fig. 6 UV-Vis spectra of E2-CA-CD, oridonin, and E2-CA-CD-Ori. | ||
3.5 Dose-dependent cytotoxic efficacy of oridonin-loaded E2-CA-CD against cancer cells
Selective internalization of the estradiol-derived carbon dots within ER (+) MCF-7 cells observed in the bioimaging experiment (Fig. 5), inspired us to utilize the biocompatible E2-CA-CD as a cellular transporter. In this context, we investigated the cellular toxicity of the oridonin loaded E2-CA-CD (E2-CA-CD-Ori) against ER (+) MCF-7 cells, ER (−) MDA-MB-231 cells and non-cancerous NIH3T3 cells using an MTT assay. Oridonin shows potential anticancer activity against gastric cancer, oral cancer, ovarian cancer, leukemia, myeloma, etc. through inhibiting proliferation, inducing apoptosis and autophagy, reversing drug resistance and so on.50 Oridonin is also known to induce cell cycle arrest and apoptosis in MCF-7 cells through activation of the p53 pathway.39 To investigate the cytotoxic efficacy of oridonin-loaded E2-CA-CD, MCF-7, MDA-MB-231, and NIH3T3 cells were incubated with varying concentrations (5–500 μg mL−1) of E2-CA-CD-Ori for 24 hours at 37 °C in a 5% CO2 atmosphere. Following this incubation, the media was replaced with MTT dye solution and further incubated for 4 hours. The resulting dye was then dissolved in DMSO to measure absorbance. The % killing of ER (+) MCF-7 cells got steadily enhanced with increase in the amount of E2-CA-CD-Ori from 10 μg mL−1 to 500 μg mL−1 (Fig. 7). At 5 μg mL−1, around 5 ± 2% MCF-7 cells got killed, which got significantly improved to 65% at 250 μg mL−1 of E2-CA-CD-Ori. At the highest investigated concentration of the complex comprising of [E2-CA-CD-Ori] = 500 μg mL−1 where [oridonin] ∼150 μg mL−1 (considering the weight ratio of oridonin to E2-CA-CD = 1:2 and drug loading efficiency 84%), notably high, 82 ± 3% killing of ER (+) MCF-7 cells was observed (Fig. 7). On the other hand, in the case of ER (−) MDA-MB-231, the killing ability by E2-CA-CD-Ori increased very sluggishly from 5% at 10 μg mL−1 to only 37 ± 2% at 500 μg mL−1 under similar experimental conditions (Fig. 7). A similar trend was observed for the normal NIH3T3 cells, where only 40 ± 2% killing was observed at the highest concentration, 500 μg mL−1 of E2-CA-CD-Ori (Fig. 7). Therefore, in the case of ER (+) MCF-7 cells, ∼2.0 to 2.2 fold higher killing was observed by E2-CA-CD-Ori compared to NIH3T3 and ER (−) MDA-MB-231 cells, respectively. These results can be attributed to the inherent target specificity of E2-CA-CD, which resulted in the highly selective therapeutic efficacy to estrogen receptor-rich cancer cells over the non-cancerous and estrogen receptor negative cancer cells.
 | ||
| Fig. 7 % killing of MDA-MB-231, NIH3T3 and MCF-7 cells determined by MTT assay incubated with varying concentrations of E2-CA-CD-Ori, where [E2-CA-CD-Ori] = 5–500 μg mL−1, ([oridonin] = 5–150 μg mL−1) for 24 h. The experimental errors were in the range of 1–3% in triplicate experiments. | ||
Moreover, in the case of native oridonin, almost similar killing efficiency was noted in all the investigated cell lines (Fig. S5, ESI†). At the highest concentration of oridonin (equivalent to that in the E2-CA-CD-Ori complex, [oridonin] = 150 μg mL−1), 27 ± 3% killing was observed for MCF-7, which were ∼22 ± 2% and 24 ± 2% for MDA-MB-231 and NIH3T3 cells, respectively (Fig. S5, ESI†). These results indicated the non-selective as well as inefficient killing ability of native oridonin probably due to the lower aqueous solubility and absence of any target specific ligand. Thus, it can be concluded that E2-CA-CDs are inherently target specific and highly selective towards ER (+) cancer cells due to the presence of the estradiol moiety that can interact with estradiol receptors of breast cancer cells. Thereby, it selectively delivered loaded oridonin to the ER (+) MCF-7 cells resulting in the efficient killing of cancer cells.
3.6 LIVE/DEAD viability assay
The selectivity of drug-loaded carbon dot towards ER (+) MCF-7 cells and the cytocompatibility of carbon dots were further studied using a LIVE/DEAD viability assay kit. MCF-7, MDA-MB-231 and NIH3T3 were treated with E2-CA-CD and E2-CA-CD-Ori (250 μg mL−1) ([oridonin = 75 μg mL−1]) for 12 h. Fluorescence images were taken after incubation of the treated cells with a LIVE/DEAD viability kit for 30 min. For E2-CA-CD treated cells, only the presence of bright green fluorescence was observed for all the investigated cell lines, ER (+) MCF-7, ER (−) MDA-MB-231 and noncancerous NIH3T3 cells (Fig. S6a, c and e, ESI†), while no cells with red fluorescence were observed for all three cases (Fig. S6b, d and f, ESI†). This observation clearly depicts the viability of the synthesized carbon dots for all three types of cell lines.In the case of oridonin-loaded carbon dots, all the cells were again treated with E2-CA-CD-Ori for 12 h followed by incubation with a LIVE/DEAD viability kit for 30 min. In the case of MCF-7 cells, the dominant presence of both green and red fluorescent cells was observed that endorsed the major existence of dead cells (Fig. S7a and b, ESI†) owing to the successful internalization of E2-CA-CD-Ori within ER (+) MCF-7 breast cancer cells. On the other hand, primarily bright green fluorescence was noted in MDA-MB-231 cells with negligible amount of red fluorescence (Fig. S7c and d, ESI†). While for NIH3T3 cells, exclusively bright green fluorescence was observed (Fig. S7e and f, ESI†). The dominant presence of green fluorescent cells in MDA-MB-231 and NIH3T3 indicates the existence of the majority of alive cells as E2-CA-CD-Ori did not get internalized in the ER (−) as well as non-cancerous cells due to the absence of ER receptors. Hence, the LIVE/DEAD assay further confirmed the target-specific theranostic utility of the E2-CA-CD-Ori complex for ER (+) breast cancer therapy.
3.7 Mechanism of E2-CA-CD-Ori-mediated ER (+) breast cancer cell killing
The anticancer efficacy of E2-CA-CD-Ori was further evaluated by studying programmed cell death mechanisms in MCF-7 cells following exposure to the E2-CA-CD, E2-CA-CD-Ori and native oridonin utilizing annexin V-FITC/propidium iodide (PI) staining combined with flow cytometric analysis. The scatterplot was divided into four quadrants based on the annexin V-FITC and PI staining patterns, distinguishing characteristics between control and treated cell groups. The Q1 quadrant represents the population of necrotic cells that stain negative for annexin V-FITC and positive for PI. The early apoptotic cell population that stained positive for annexin V-FITC was found in the Q4 quadrant. The late apoptotic cell population that stained positive for both annexin V-FITC and PI, was situated in the Q2 quadrant. Healthy, viable cells that stained negative for both annexin V-FITC and PI were observed in the Q3 quadrant. Untreated cells and treatment of ER (+) MCF-7 cells with only E2-CA-CD resulted in annexin V-FITC/PI negatively stained cancer cells observed from the total population of cells residing in quadrant Q3, thereby indicating viable non-apoptotic cells (Fig. 8a and b). This observation further confirmed the cytocompatible nature of E2-CA-CD. In the case of the native drug, exposure to oridonin (75 μg mL−1) for 12 hours resulted in only a small fraction of MCF-7 cells undergoing early apoptosis, as evidenced by the limited population in the Q4 quadrant, while the majority of cells remained in the Q3 quadrant (Fig. 8c). This signifies the lower bioavailability of oridonin to the cancer cells in absence of drug delivery vehicle that resulted in inefficient killing of cancer cells. In contrast, treatment with E2-CA-CD-Ori complex (250 μg mL−1) ([oridonin] = 75 μg mL−1) for 12 h resulted in significant populations in Q4 and to a certain extent in Q2 quadrants, indicating E2-CA-CD-Ori induced apoptosis through an early to late apoptotic pathway (Fig. 8d). This enhanced apoptotic efficiency of the E2-CA-CD-Ori complex is appropriate for selectivity, enhancing the therapeutic effect and reducing the toxicity of the free drug towards non-cancerous cells. | ||
| Fig. 8 Flow cytometric analysis of apoptosis in (a) untreated control MCF-7 cells, as well as MCF-7 cells treated with (b) E2-CA-CD, (c) native oridonin, and (d) E2-CA-CD-Ori for 12 h. | ||
3.8 Nuclear assessment of cancer cells following treatment with E2-CA-CD-Ori
After ensuring the apoptotic potential of the E2-CA-CD-Ori complex, we delved deeper into the apoptotic changes in the nuclei of ER (+) MCF-7 cells following exposure to the nano-formulation. We have focused on the nuclear shrinkage along with chromatin condensation that appears during late-phase apoptosis of cancer cells. The effect of E2-CA-CD (250 μg mL−1), E2-CA-CD-Ori (250 μg mL−1) and the free drug (75 μg mL−1) on the MCF-7 cells was investigated after 12 h of exposure. The nuclei of the cells were stained with Hoechst 33342, and subsequently fluorescence microscopic images were captured. Nuclei of the cells treated with E2-CA-CD displayed spherical shaped healthy nuclei similar to the nuclei of untreated cells (Fig. S8a and b, ESI†). This analysis not only proves the biocompatibility of the synthesized carbon dots, but also reinforced the notion that exposure to the drug-loaded E2-CA-CD induced apoptotic features within MCF-7 cells. Alongside this, treatment with the native drug under similar experimental conditions displayed negligible changes in the nuclear morphology and caused the generation of a smaller number of apoptotic bodies in MCF-7 cells (Fig. S8c, ESI†). Interestingly, upon incubation with the E2-CA-CD-Ori formulation, the nuclei of MCF-7 cells exhibited signs of nuclear shrinkage, nuclear fragmentation, chromatin condensation, and the formation of apoptotic bodies (Fig. S8d, ESI†). These observations proposed a loss of nuclear morphology, revealing the progression of cancer cell apoptosis induced by E2-CA-CD-Ori.3.9 Intracellular ROS generation
Intracellular ROS level has a significant role in the cell apoptotic signaling pathway.40 In order to determine whether ROS are involved in E2-CA-CD-Ori-induced cell apoptosis, we measured the intracellular ROS generation by the DCFH-DA staining method in MCF-7. For this purpose, untreated cells along with cells treated with E2-CA-CD (250 μg mL−1), E2-CA-CD-Ori (250 μg mL−1) and the free drug oridonin (75 μg mL−1) for 12 h were subsequently incubated with DCFH-DA dye in the absence of light. Upon entering the cell, DCFH-DA undergoes deacetylation, converting into a nonfluorescent compound which in the presence of reactive oxygen species (ROS), undergoes oxidation, transforming into a green fluorescent compound known as 2′,7′-dichlorofluorescein. (DCF). Untreated cells as well as the cells treated with E2-CA-CD showed very feeble fluorescence, depicting no increase in the intracellular ROS levels (Fig. S9a and b, ESI†). In the case of native oridonin-treated MCF-7 cells, considerably lower amount of green fluorescence signal was observed indicating less ROS generation that can be correlated with the negligible impact of native oridonin due to lower bioavailability (Fig. S9c, ESI†). Importantly, exposure to E2-CA-CD-Ori (250 μg mL−1) ([oridonin = 75 μg mL−1]) resulted in a notable increase of ROS generation revealed by the enhanced bright green fluorescence of DCF in MCF-7 cells (Fig. S9d, ESI†). Hence, it can be concluded that the target specific delivery of oridonin using E2-CA-CD elevated the intracellular ROS generation, which resulted in a higher level of apoptosis in MCF-7 cells.3.10 E2-CA-CD-Ori induced p53 pathway-mediated apoptosis in MCF-7 cells
p53, the tumor suppressor protein, is a major transcription factor stabilized within the nucleus upon DNA damage or oncogenic signaling that regulates several cellular functions. p53 acts as a central orchestrator of cellular responses to stress and DNA damage, ensuring genomic stability and preventing tumorigenesis through its diverse array of functions in the nucleus, cytoplasm, and mitochondria.51 The p53 protein plays a crucial role in the G1/S checkpoint of the cell cycle, retorting to DNA damage by controlling cell cycle progression and promoting apoptosis in different cell types.52 Upon exposure of cells to a situation of DNA damage, checkpoints become activated to pause cell growth and potentially repair the DNA before moving to the next phase of the cell cycle (G1 or G2) which results in the upregulation of p53. In the case of severe DNA damage, apoptosis is also triggered to eradicate irreparably damaged cells. Additionally, p53 and cdk inhibitors like p21 decelerate cell cycle progression, causing arrest at the G1 and G2 phases that allows time for DNA repair.53,54Although Tp53 is the most frequently altered gene in breast cancer, almost two-thirds of the breast cancer cases retain the wild type status, the majority of which belong to the luminal-like subtype.55 In these types of breast cancers, the activity of p53 is majorly suppressed due to the overexpression of its primary negative regulators MDM2 or MDMX. For the remaining one third of cases, the functions of p53 remain inactivated due to mutations, which is predominantly observed in case of HER2+ and basal-like subtypes.38 To date, many therapeutic strategies have been established to target the mechanisms of p53 inactivation and to restore its tumor suppressive functions. The search for small molecules that can reactivate the p53 signaling pathway has also gained significant interest in the last few decades. Oridonin, a diterpenoid compound isolated from Rabdosia rubescens, is one such small molecule that can upregulate the p53 pathway.39 However, its efficacy gets challenged in cancer therapy due to poor aqueous solubility and lack of target specificity.40 To overcome this issue, oridonin was loaded on E2-CA-CD and the E2-CA-CD-Ori formulation selectively killed the ER (+) MCF-7 cells through the ROS-induced early to late apoptotic pathway with desired target specificity and efficiency.
Herein, we were interested in verifying whether upregulation of the p53 signaling mechanism is responsible for uploaded oridonin-induced apoptosis. The activation of p53 occurs through phosphorylation. Hence, we investigated the expressions of p53 and phosphorylated p53 (p-p53) in MCF-7 cells following exposure to E2-CA-CD, oridonin and E2-CA-CD-Ori for 6 h along with the control alone (Fig. 9). The results indicated that there was no notable alteration in p53 protein expression in all four groups (Fig. 9). However, a noteworthy effect was observed on p-p53 protein expression. For native E2-CA-CD-treated MCF-7 cells, no expression of p-p53 protein was observed similar to the control group (Fig. 9). In the case of native oridonin, meager expression of p-p53 was observed, whereas a significant increase in p-p53 expression was noted for E2-CA-CD-Ori-treated MCF-7 cells (Fig. 9). Thus, the E2-CA-CD-Ori complex caused substantial upregulation of the p-p53 pathway in drug-loaded E2-CA-CD-treated MCF-7 cells.
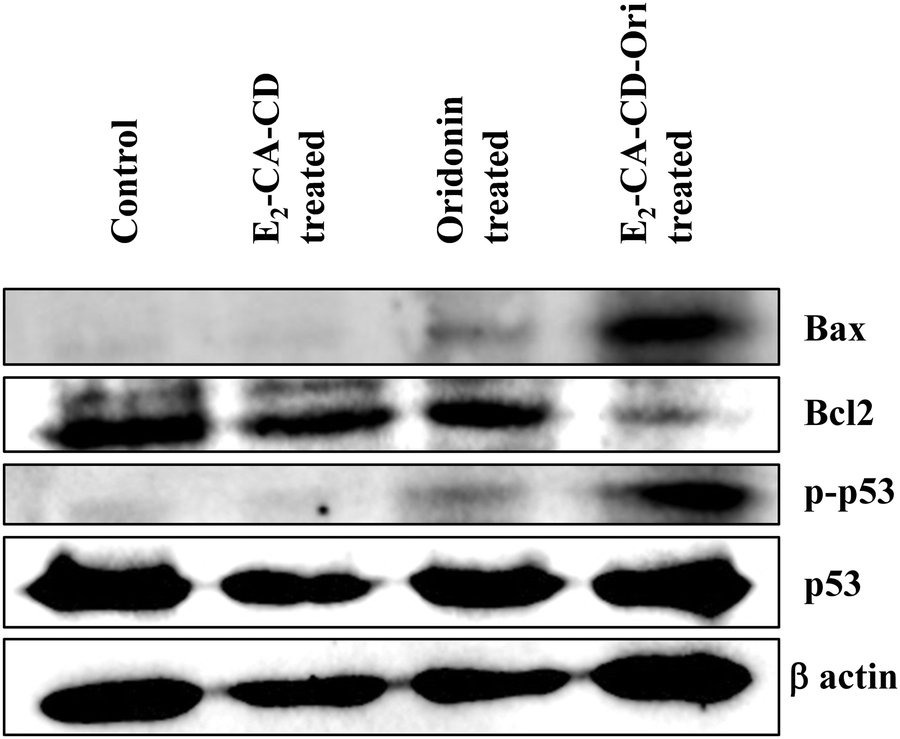 | ||
| Fig. 9 Immunoblot analysis of p53, p-p53, Bcl2, and Bax levels in MCF-7 cells treated with E2-CA-CD, native oridonin, and E2-CA-CD-Ori for 6 h. β-Actin levels are shown as a loading control. | ||
It has been previously reported that in the case of oridonin-treated MCF-7 cells, p53 plays another important role by promoting apoptosis through Bax/Bcl-2 to remove un-rectifiable cells from cell cycle arrest where expression of Bcl-2 got decreased and Bax was activated. Bcl-2 inhibits apoptosis and supports cell survival, while Bax functions within mitochondria to induce cytochrome c release, initiating caspase-9 activation that facilitates apoptotic progression.39 Therefore, we have checked the effect of E2-CA-CD, oridonin and E2-CA-CD-Ori after 6 h of treatment of MCF-7 cells on Bax/Bcl-2 protein expression from an immunoblotting assay. In the case of the control and native E2-CA-CD, similar expression of Bcl-2 was noted while there was no observable expression of Bax (Fig. 9). For native oridonin-treated MCF-7 cells, a little influence was observed on the Bax expression, while negligible downregulation was noted in Bcl-2 expression (Fig. 9). Encouragingly, for E2-CA-CD-Ori-treated MCF-7 cells, significant downregulation of Bcl-2 as well as upregulation of Bax expression was observed (Fig. 9). Thus, it can be concluded that in comparison to native oridonin, E2-CA-CD-Ori more efficiently promoted cell cycle arrest through p53 pathway activation and also induced apoptosis mediated by p53 involving the upregulation of Bax and the downregulation of Bcl-2 that led to the selective and efficient killing of ER (+) MCF-7 cells. The raw data of the immunoblots has been included in the ESI† (Fig. S10).
4. Conclusion
In summary, we have successfully developed estradiol-derived carbon dot E2-CA-CD from 17β-estradiol and citric acid following a solvothermal method using formamide as a solvent. These intrinsically fluorescent carbon dots showed excellent biocompatibility. The inherently target specific E2-CA-CD was utilized for selective bioimaging of ER receptor-enriched MCF-7 cells against ER (−) MDA-MB-231 and non-cancerous NIH3T3 cells. Hydrophobic oridonin (otherwise water insoluble) was successfully loaded on E2-CA-CD with the aim of selective killing of ER (+) cancer cells. Oridonin-loaded E2-CA-CD (E2-CA-CD-Ori) showed ∼2.2 fold higher killing of ER (+) MCF-7 cells compared to ER (−) MDA-MB-231 and NIH3T3 cells. Moreover, this E2-CA-CD-Ori complex exhibited ∼3 fold higher killing of MCF-7 cells compared to native oridonin. Selective and efficient killing of ER (+) MCF-7 cells by E2-CA-CD-Ori took place through the early to late apoptotic pathway with enhanced intracellular ROS level as well as loss of nuclear morphology. Importantly, E2-CA-CD-Ori triggered the activation of the p53 pathway in MCF-7 cells, which in turn upregulated Bax and downregulated Bcl2 leading to the selective and efficient killing of ER (+) MCF-7 cells. Thus, this study confirmed that the inherent targeting ability of E2-CA-CD along with its intrinsic fluorescent characteristic made it a potential material for theranostic applications in treating ER (+) breast cancer cells.Author contributions
P. K. D. and A. H. K. designed the research work. A. H. K., A. B., and A. Z. performed the research investigations. P. K. D., A. H. K., A. B., and A. Z., analyzed the data and wrote the manuscript.Data availability
The data supporting this article have been included as part of the ESI.†Conflicts of interest
The authors declare that they have no known competing financial interests or personal relationships that could have appeared to influence the work reported in this paper.Acknowledgements
P. K. D. is thankful to the Science and Engineering Research Board (SERB), the Department of Science and Technology (DST), India, for financial assistance (No. CRG/2021/000235). A. H. K., A. B. and A. Z. acknowledge CSIR, India and IACS, India and UGC, India, respectively for their research fellowships. The authors thank Gopal Manna for assisting in preparing the TOC.References
- L. Wilkinson and T. Gathani, Br. J. Radiol., 2022, 95(1130), 20211033 CrossRef PubMed.
- M. D. Althuis, J. H. Fergenbaum, M. Garcia-Closas, L. A. Brinton, M. P. Madigan and M. E. Sherman, Cancer Epidemiol., Biomarkers Prev., 2004, 13, 1558–1568 CrossRef CAS.
- D. C. Allred, Mod. Pathol., 2010, 23, S52–S59 CrossRef CAS PubMed.
- K. Tryfonidis, D. Zardavas, B. S. Katzenellenbogen and M. Piccart, Cancer Treat. Rev., 2016, 50, 68–81 CrossRef PubMed.
- C. X. Ma, C. G. Sanchez and M. J. Ellis, Oncology, 2009, 23, 133–142 Search PubMed.
- X. Xiong, Y. Huang, W. L. Lu, X. Zhang, H. Zhang, T. Nagai and Q. Zhang, J. Pharm. Sci., 2005, 94, 1782–1793 CrossRef CAS PubMed.
- G. Mondal, S. Barui, S. Saha and A. Chaudhuri, J. Controlled Release, 2013, 172, 832–840 CrossRef CAS PubMed.
- N. Nasongkla, E. Bey, J. Ren, H. Ai, C. Khemtong, J. S. Guthi, S. F. Chin, A. D. Sherry, D. A. Boothman and J. Gao, Nano Lett., 2006, 6, 2427–2430 CrossRef CAS PubMed.
- J. Z. Du, T. M. Sun, W. J. Song, J. Wu and J. Wang, Angew. Chem., Int. Ed., 2010, 49, 3621–3626 CrossRef CAS PubMed.
- S. Brahmachari, M. Ghosh, S. Dutta and P. K. Das, J. Mater. Chem. B, 2014, 2, 1160–1173 RSC.
- X. Yang, X. Zhang, Z. Liu, Y. Ma, Y. Huang and Y. Chen, J. Phys. Chem. C, 2008, 112, 17554–17558 CrossRef CAS.
- C. K. Kim, P. Ghosh, C. Pagliuca, Z. J. Zhu, S. Menichetti and V. M. Rotello, J. Am. Chem. Soc., 2009, 131, 1360–1361 CrossRef CAS PubMed.
- P. Ghosh, G. Han, M. De, C. K. Kim and V. M. Rotello, Adv. Drug Delivery Rev., 2008, 60, 1307–1315 CrossRef CAS PubMed.
- C. L. Huang, C. C. Huang, F. D. Mai, C. L. Yen, S. H. Tzing, H. T. Hsieh, Y. C. Ling and J. Y. Chang, J. Mater. Chem. B, 2015, 3, 651–664 RSC.
- D. E. Lee, H. Koo, I. C. Sun, J. H. Ryu, K. Kim and I. C. Kwon, Chem. Soc. Rev., 2012, 41, 2656–2672 RSC.
- C. S. Cutler, H. M. Hennkens, N. Sisay, S. Huclier-Markai and S. S. Jurisson, Chem. Rev., 2013, 113, 858–883 CrossRef CAS PubMed.
- G. P. Luo, J. Long, B. Zhang, C. Liu, S. R. Ji, J. Xu, X. Yu and Q. Ni, Expert Opin. Drug Delivery, 2012, 9, 47–58 CrossRef CAS PubMed.
- M. Zhang and F. M. Kievit, Acc. Chem. Res., 2011, 44(10), 853–862 CrossRef PubMed.
- Z. X. Li, J. C. Barnes, A. Bosoy, J. F. Stoddart and J. I. Zink, Chem. Soc. Rev., 2012, 41, 2590–2605 RSC.
- A. M. Derfus, W. C. W. Chan and S. N. Bhatia, Nano Lett., 2004, 4, 11–18 CrossRef CAS PubMed.
- L. Cheng, K. Yang, M. Shao, X. Lu and Z. Liu, Nanomedicine, 2011, 6, 1327–1340 CrossRef CAS PubMed.
- D. Chakraborty, S. Sarkar and P. K. Das, ACS Sustainable Chem. Eng., 2018, 6(4), 4661–4670 CrossRef CAS.
- M. Chowdhury, S. Pal, A. Ghosh and P. K. Das, Chem. – Eur. J., 2023, 29, e202300928 CrossRef CAS PubMed.
- S. Paudyal, F. A. Vallejo, E. K. Cilingir, Y. Zhou, K. J. Mintz, Y. Pressman, J. Gu, S. Vanni, R. M. Graham and R. M. Leblanc, ACS Appl. Bio Mater., 2022, 5, 3300–3309 CrossRef CAS PubMed.
- J. Du, N. Xu, J. Fan, W. Sun and X. Peng, Small, 2019, 15, e1805087 CrossRef PubMed.
- S. Maiti, K. Das and P. K. Das, Chem. Commun., 2013, 49, 8851–8853 RSC.
- K. Das, S. Sarkar and P. K. Das, ACS Appl. Mater. Interfaces, 2016, 8, 25691–25701 CrossRef CAS PubMed.
- M. Chowdhury and P. K. Das, ACS Appl. Bio Mater., 2021, 4, 5132–5144 CrossRef CAS PubMed.
- M. Bartkowski, Y. Zhou, M. N. A. Mustafa, A. J. Eustace and S. Giordani, Chem. – Eur. J., 2024, 30, e202303982 CrossRef CAS PubMed.
- T. Feng, X. Ai, H. Ong and Y. Zhao, ACS Appl. Mater. Interfaces, 2016, 8, 18732–18740 CrossRef CAS PubMed.
- S. N. Baker and G. A. Baker, Angew. Chem., Int. Ed., 2010, 49, 6726–6744 CrossRef CAS PubMed.
- S. Zhu, Q. Meng, L. Wang, J. Zhang, Y. Song, H. Jin, K. Zhang, H. Sun, H. Wang and B. Yang, Angew. Chem., Int. Ed., 2013, 52, 3953–3957 CrossRef CAS PubMed.
- A. B. Bourlinos, A. Stassinopoulos, D. Anglos, R. Zboril, M. Karakassides and E. P. Giannelis, Small, 2008, 4, 455–458 CrossRef CAS PubMed.
- H. Ding, F. Du, P. Liu, Z. Chen and J. Shen, ACS Appl. Mater. Interfaces, 2015, 7, 6889–6897 CrossRef CAS PubMed.
- M. Ghosh and P. K. Das, Colloids Surf., B, 2016, 142, 367–376 CrossRef CAS PubMed.
- D. R. Ciocca and M. A. Faanelli, Trends Endocrinol. Metab., 1997, 8, 313–321 CrossRef CAS PubMed.
- D. E. Moulder, D. Hatoum, E. Tay, Y. Lin and E. M. McGowan, Cancers, 2018, 10(6), 189 CrossRef PubMed.
- C. Marvalim, A. Datta and S. C. Lee, Theranostics, 2023, 13(4), 1421–1442 CrossRef CAS PubMed.
- Q. Cui, J. H. Yu, J. N. Wu, S. I. Tashiro, S. Onodera, M. Minami and T. Ikejima, Acta Pharmacol. Sin., 2007, 28, 1057–1066 CrossRef CAS PubMed.
- Y. Zhao, W. Xiao, W. Peng, Q. Huang, K. Wu, C. E. Evans, X. Liu and H. Jin, Front. Bioeng. Biotechnol., 2021, 9, 600579 CrossRef PubMed.
- L. Paoletti, N. Zoratto, M. Benvenuto, D. Nardozi, V. Angiolini, P. Mancini, L. Masuelli, R. Bei, G. V. Frajese, P. Matricardi, M. Nalli and C. D. Meo, Carbohydr. Polym., 2022, 314, 120900 CrossRef PubMed.
- B. Mamnoon, L. Feng, J. Froberg, Y. Choi, V. Sathish and S. Mallik, Mol. Pharmaceutics, 2020, 17, 4312–4322 CrossRef CAS PubMed.
- S. Sarkar, K. Das and P. K. Das, ACS Sustainable Chem. Eng., 2017, 5, 8356–8369 CrossRef CAS.
- S. Pandit, P. Behera, J. Sahoo and M. De, ACS Appl. Bio Mater., 2019, 2, 3393–3403 CrossRef CAS PubMed.
- B. Zhi, X. X. Yao, Y. Cui, G. Orr and C. L. Haynes, Nanoscale, 2019, 11, 20411–20428 RSC.
- Y. Han, L. Liccardo, E. Moretti, H. Zhao and A. Vomiero, J. Mater. Chem. C, 2022, 10, 11827–11847 RSC.
- M. Mondal and S. Pramanik, Mater. Lett.: X, 2023, 18, 100195 CAS.
- Z. Gan, H. Xu and Y. Hao, Nanoscale, 2016, 8, 7794–7807 RSC.
- P. Hobza and Z. Havlas, Chem. Rev., 2000, 100, 4253–4264 CrossRef CAS PubMed.
- X. Li, C. T. Zhang, W. Ma, X. Xie and Q. Huang, Front. Pharmacol., 2021, 12, 645824 CrossRef CAS PubMed.
- O. Hassin and M. Oren, Nat. Rev. Drug Discovery, 2023, 22, 127–144 CrossRef CAS PubMed.
- M. Ciciarello, R. Mangiacasale, M. Casenghi, M. Z. Limongi, M. D’Angelo, S. Soddu, P. Lavia and E. Cundari, J. Biol. Chem., 2001, 276, 19205–19213 CrossRef CAS PubMed.
- F. Bunz, A. Dutriaux, C. Lengauer, T. Waldman, S. Zhou, J. P. Brown, J. M. Sedivy, K. W. Kinzler and B. Vogelstein, Science, 1998, 282, 1497–1501 CrossRef CAS PubMed.
- M. Fritsche, C. Haessler and G. Brandner, Oncogene, 1993, 8, 307–318 CAS.
- N. A. Ungerleider, S. G. Rao, A. Shahbandi, D. Yee, T. Niu, W. D. Frey and J. G. Jackson, Breast Cancer Res., 2018, 20, 115 CrossRef PubMed.
Footnote |
| † Electronic supplementary information (ESI) available: Synthetic schemes, characterization data of E2-H-CD and E2-CD, image of a cuvette containing E2-CA-CD under a UV lamp, UV spectra and standard calibration curve of oridonin, killing of MCF-7, MDA-MB-231 and NIH3T3 using native oridonin, live–dead fluorescence microscopic images of cells treated with E2-CA-CD and E2-CA-CD-Ori, nuclear staining of MCF-7 cells with Hoechst 33342 dye, fluorescence microscopic images of intracellular ROS generation in MCF-7 cells, and raw data of the immunoblots. See DOI: https://doi.org/10.1039/d4tb01415d |
| This journal is © The Royal Society of Chemistry 2024 |