DOI:
10.1039/D3SU00451A
(Tutorial Review)
RSC Sustainability, 2024,
2, 852-870
The power of pores: review on porous thermoelectric materials
Received
5th December 2023
, Accepted 21st February 2024
First published on 21st February 2024
Abstract
Waste heat can be utilized to generate electric power via thermoelectric solid-state materials in a more reliable and noise-free way than conventional heat power systems. However, the primary concern arises from its low efficiency compared to conventional conversion technologies. Thermoelectric efficiency is measured in terms of a figure of merit (ZT), which is proportional to electrical conductivity (σ) and Seebeck coefficient (S) and is inversely proportional to the thermal conductivity (κ) of a material system. A material that has high electrical conductivity usually has low Seebeck coefficient and high thermal conductivity and vice versa and, therefore, a low ZT value. Hence, semiconductors are a vital choice for achieving a high ZT value compared to ceramics and metals, where all the above-mentioned parameter values are in an intermediate range. Researchers have been working for decades to independently control these thermoelectric parameters via various routes, such as nanostructuring, doping, compositional tuning, and band gap engineering. One significant approach in this direction is introducing controlled porosity into thermoelectric materials to achieve low thermal conductivity (κ) while minimizing any detrimental impact on electrical conductivity (σ). This review highlights the importance of porosity and its effect on porous thermoelectric materials and summarizes recent progress in developing advanced porous structures for high-performance thermoelectric materials systems. It also offers some prospects and strategies to independently control κ with a very low synergistic effect on σ to achieve a high ZT value.
Sustainability spotlight
Porous thermoelectric materials have emerged as a promising avenue for advancing sustainability in the realm of energy materials. Controlled porosity can elevate the thermoelectric efficiency of materials by reducing thermal conductivity without compromising the electrical transport properties of the materials. Efficient thermoelectric materials can address critical environmental challenges by reducing greenhouse gas emissions and energy consumption. Through ongoing research, experimentation, and collaboration, porous thermoelectric materials are paving the way for a greener and more sustainable future, where energy production and utilization are harmonized with environmental stewardship. In this review, we present some recent studies carried out by researchers to study the potential of porous microstructures in improving the thermoelectric properties of various material systems. This work aligns with the two UN sustainability goals: SDG 07 “affordable and clean energy” and SDG 13 “climate action.”.
|
Introduction
Despite the growing demand for energy in the 21st century, a significant amount is being dissipated in the form of heat everywhere.1,2 Thermoelectric materials have received considerable attention owing to their intrinsic ability to transform heat into electricity or vice versa through solid-state devices.3–5 The thermoelectric effect is based on the principle that a temperature gradient across a material can generate a potential difference across the two ends of the material.6,7 This is because heat flow causes electrons to be piled up at one side of the junction, resulting in the flow of electric current through an outer connected circuit to generate electricity.8,9 There are various applications of thermoelectric technology, such as power generation from dissipated heat, refrigeration, and remote sensing. They offer several advantages over conventional harvesting technologies, including low maintenance, reliability, silent operation, and absence of moving parts.10,11 Despite numerous positive features, the main challenge in the commercialization of thermoelectric systems is usually low conversion efficiency. The efficiency of the thermoelectric material system is determined by ZT with respect to the measured temperature.
The ZT expression can be written as
where
S is the Seebeck coefficient,
σ is electrical conductivity,
κ is the total thermal conductivity, and
T is the absolute temperature. Achieving a high
ZT value in thermoelectric materials requires a high Seebeck coefficient and high electrical conductivity but low thermal conductivity.
12–14 However, controlling these parameters independently is very challenging due to their interdependence on each other.
15,16 This is mainly due to the requirement of increasing the power factor (
S2σ) and simultaneously reducing the thermal conductivity. Enhancing both electrical conductivity and the Seebeck coefficient simultaneously proves difficult because they typically vary oppositely with changes in charge carrier concentration. Additionally, concurrently increasing
σ and decreasing thermal conductivity pose a challenge, as the electronic component of thermal conductivity tends to follow the same trend of
σ.
17 The Wiedemann–Franz relationship divides thermal conductivity into two parts that play a role in determining the thermal properties of solids: one is associated with phonons (or lattice vibrations) and the other arises from electrons.
18 To control
κ without affecting the electrical transport properties of a material, we need to independently control the lattice part of the thermal conductivity, which is more closely related to phonon scattering.
19,20 Therefore, independent reduction in the lattice part of the
κ without significantly affecting the electronic part within the same system is termed ‘phonon-glass, electron-crystal’ (PGEC). In the PGEC concept, semiconductors are designed like a crystal structure that transmits charge carriers like a good semiconductor crystal by blocking the flow of heat efficiently through effective phonon scattering similar to amorphous glass.
21
The key point for understanding is how heat conduction occurs inside a crystal structure and what are the parameters that affect heat conduction inside a material system. As atoms are closely packed within the crystal structure, they vibrate at their natural frequencies all the time. The vibration of one atom in the crystal is linked with neighboring atoms and exists as an interconnecting network of vibrations rather than as an isolated entity. The lattice vibrations behave like standing waves within a crystal structure. These lattice waves are quanta of crystal vibration terms as phonons, which are responsible for the transportation of thermal energy throughout the materials.22
The timespan of phonon existence in the material may vary depending on its frequency or, in other words, energy. The phonons can have a wide range of frequencies depending on their polarization (i.e., transverse or longitudinal) and their vibrational mode (i.e., optical or acoustic) and hence can carry different amounts of heat.23 The factors that determine the heat conduction within the material are heat capacity (Cp), mean free path (ℓ) and group velocity (vg) of phonons. The group velocity is responsible for the propagation of phonons in the material related to the frequency and wavenumber of phonons and can be defined as  .24–26 By increasing the temperature of the material, different modes of phonon can be excited. However, only a few of these modes are responsible for heat transfer, such as long-wavelength acoustic phonons. However, optical phonons have low group velocities and are poor carriers of heat.27 However, the mean free path of the acoustic phonon responsible for heat conduction does not remain the same and can vary by more than an order of magnitude. The mean free path can vary by changing the purity or harmonicity of the material.28,29 Anharmonic lattice vibrations involve non-linear interactions among atoms within a crystal lattice. In harmonic approximation, atoms exhibit regular and predictable vibrations around their equilibrium positions. However, real materials introduced anharmonicity, causing irregularities in these vibrations and resulting in the scattering of phonons, which are the elementary excitations responsible for heat conduction in a crystal lattice. Numerous studies have explored the effect of increasing anharmonic lattice vibrations on a decrease in lattice thermal conductivity.30–32 Another important factor is the scattering of phonons within the material, which can greatly affect its thermal conductivity. Phonon scattering is high for a structure with more defects, such as impurities, vacancies, and grain boundaries, as shown in Fig. 1.33,34 The most common methods for reducing the thermal conductivity of materials are doping,35 microstructure control,36 grain boundary engineering,37 compositional optimization,38 and incorporating porosity.39
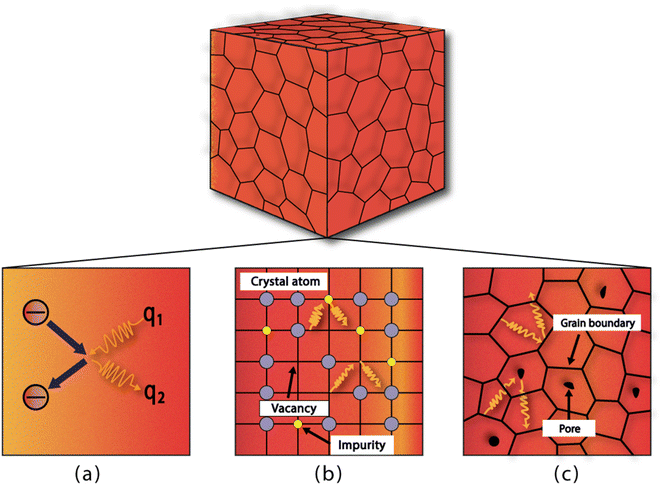 |
| | Fig. 1 Different sites for phonon scattering: (a) phonon–electron scattering, (b) scattering due to impurities or vacancies, and (c) scattering caused by grain boundaries and pores. | |
A porous structure is a solid matrix with incorporated voids, where pores can be opened or closed depending on the matrix materials and processing scheme. Pores are of three types based on their size, as shown in Fig. 2. These pores when induced in a structure result in a large surface area that enables numerous active sites to promote various processes, such as catalysis, adsorption and separation.40 Porous structures have applications in various research areas, such as solar cell,41 super capacitors,42 batteries,43 sensors,44 bio-medical,45 opto-electronics,46 and thermoelectric.47
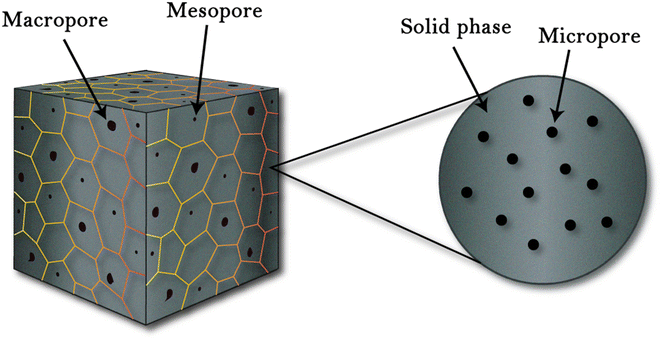 |
| | Fig. 2 Porous structures defined by (IUPAC): microporous (pore size < 2 nm), mesoporous (2–50 nm), and macro-porous (>50 nm).48 | |
The incorporation of controlled porosity into the structure is an effective way to increase phonon scattering and reduce thermal conductivity. Many studies have reported incorporating porous structures within the material to successfully control thermal conductivity.49–52 The scattering mechanism in porous structures is more complex than other scattering types, such as point defects and grain boundaries. Hohyun et al. described a model of phonon scattering at the pore site and its effect on the thermal conductivity of the material. According to the proposed model, the inclusion of pores in the structure also affects the electrical conductivity of the material. The group suggested that the low value of the electron effective mass and the small relaxation time of charge carriers can cause a slight decrease in electrical conductivity and an overall enhancement in ZT.53 Various efforts have been made so far to incorporate controlled porosity, aiming to enhance thermoelectric performance across various material systems. The subsequent sections delve into some of these efforts.
Hollow hexagonal porous Al-doped ZnO towers
Bo et al.54 synthesized Al-doped ZnO(AZO) by co-precipitation and then processed by spark plasma sintering (SPS). At 40 °C, precursors such as Zn(CH3COO)2·2H2O and Al(NO3)3 were mixed in deionized water (D.I), and ammonia was added gradually to maintain a pH of 8. The precipitate was permitted to settle at the bottom, and the supernatant was removed. The sediment was washed several times with D.I. water. Subsequently, the drying was carried out overnight at 100 °C and calcined for 2 h at 800 °C in a furnace. The calcined powders were then subjected to SPS sintering at various temperatures (400, 500, 600, 700, 800, 900, and 1000 °C) for 5 minutes at 80 MPa. The fractured surface at various temperatures of the samples after SPS is depicted in Fig. 3 through FE-SEM micrographs. The undoped AZO powder exhibits a hollowed and tower-like structure with around 1 μm diameter, as revealed by the FE-SEM images. The diameter of the pores inside the tower is approximately 800 nm. As the SPS temperature increases, the samples become denser, and the inner diameter of the hollow tower decreases significantly. Despite sintering the sample at 400 °C, the hollow structure remains stable, as observed in the FE-SEM in Fig. 3. After sintering above 800 °C, porosity reduces rapidly, and the structure becomes almost compact solid at 1000 °C, as shown in the FE-SEM images in Fig. 3.
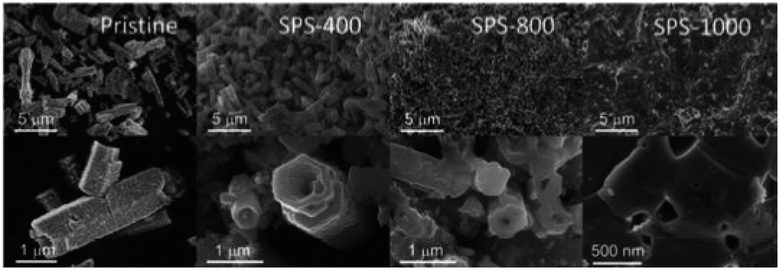 |
| | Fig. 3 FE-SEM of Al-doped ZnO(AZO) sintered in SPS at various temperatures. Reprinted with permission from.54 Copyright 2020, American Chemical Society. | |
Fig. 4(a) displays the interdependence of temperature and total thermal conductivity. The results indicate a decrease in thermal conductivity across all samples with increasing temperature. The FE-SEM in Fig. 3 shows that the high porosity in AZO may be attributed to the hollow tower, whereas the pores inside the tower were much smaller. Consequently, the hollow structure within the tower acts as a more efficient phonon scattering center, which causes a considerable reduction in thermal conductivity. When sintered at extremely high temperature, i.e. 1000 °C, small pores or voids still existed, which acted as centers for phonon scattering, and could explain the decrease in thermal conductivity up to 20.6 W m−1 K−1 at room temperature. As shown in Fig. 4(b), the ZT graph showed an increase in ZT with temperature due to the decrease in thermal conductivity in all samples. High porosity in Al-doped ZnO is shown to effectively suppress lattice thermal conductivity, thus holding the potential to significantly improve thermoelectric performance. However, the highly porous sample has low thermal conductivity but exhibits relatively poor electrical conductivity. Upon sintering at elevated temperatures, there is a noticeable increase in thermal conductivity, along with substantial enhancement in electrical conductivity. The enhancement in electrical conductivity with increasing sintering temperature, observed in both Al-doped and undoped-ZnO, is likely attributed to an increase in carrier concentration. As the sintering temperature increases, the gradual removal of defects leads to an increase in carrier concentration, thereby greatly enhancing electrical conductivity. Conversely, high-temperature sintering may generate oxygen vacancies, acting as donors in ZnO and contributing to the overall increase in carrier concentration. For the sample sintered at 1000 °C, electrical conductivity experiences a notable increase, while the lattice thermal conductivity remains relatively low due to residual pores. Particularly, the numerous small pores or voids were identified through positron annihilation measurements. Combining these findings, the resulting ZT value attains 0.275 at 500 °C for the sample sintered at 1000 °C. However, when compared to previously reported studies on ZnO porous materials, the performance of porous ZnO falls short of expectations. The reported data indicate an achieved ZT of 0.52 at 826 °C.32
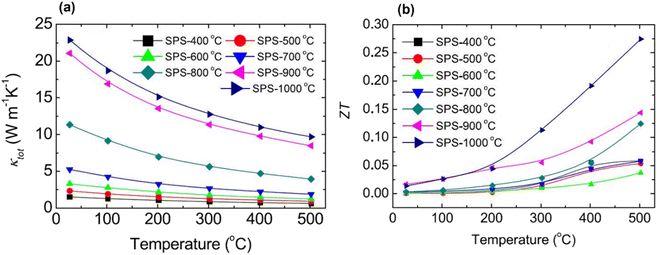 |
| | Fig. 4 Interdependence of temperature and (a) thermal conductivity and (b) ZT of sintered 2 at% Al-doped ZnO at different temperatures. Reprinted with permission from.54 Copyright 2020, American Chemical Society. | |
Nanoscale porosity in Bi2Te3
Wang et al.55 prepared porous n-type Bi2Te3 pellets using the solvothermal approach, as shown in Fig. 5. Bismuth and tellurium oxides were added into the solution of polyvinylpyrrolidone and ethylene glycol. To create an alkaline environment, NaOH was also added into the solution and stirred for several minutes before placing it inside the autoclave. The autoclave was heated up to 210 °C for several hours and then placed at room temperature. After cooling, the sample was washed several times and then dried at 60 °C. To measure thermoelectric properties, the sample was sintered via SPS for 5 h at 300 °C to form a solid consolidated pellet.
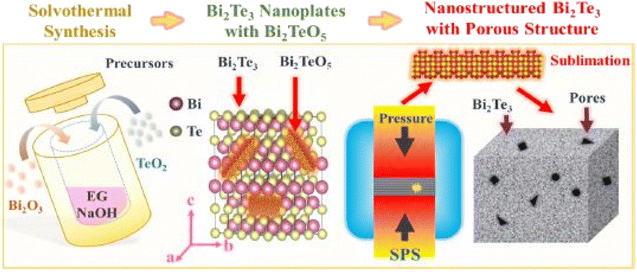 |
| | Fig. 5 Graphical abstract of Bi2Te3 pellets synthesis using a solvothermal approach assisted with spark plasma sintering. Reprinted with permission from.55 Copyright 2019, American Chemical Society. | |
The SEM of the synthesized Bi2Te3 sample is presented in Fig. 6(a)–(c), revealing hexagonal nanoplates. The thickness is around 20 nm, as shown in the inset of Fig. 6(c). The sintered Bi2Te3 nanostructured pellet is displayed in Fig. 6(d)–(f). Sintering caused the sublimation of Bi2TeO5 inducing pores into the Bi2Te3 pellets, which clearly shows a porous structure with pores that are uniformly distributed throughout the structure. Fig. 6(f) depicts a typical pore size of 400 nm in the matrix. The thermal measurements reveal that the thermal conductivity of the sintered porous Bi2Te3 decreased as the temperature increased from 300 to 560 K. The smallest value of thermal conductivity was measured at approximately 0.5 W m−1 K−1 and 418 K, as shown in Fig. 7(a).
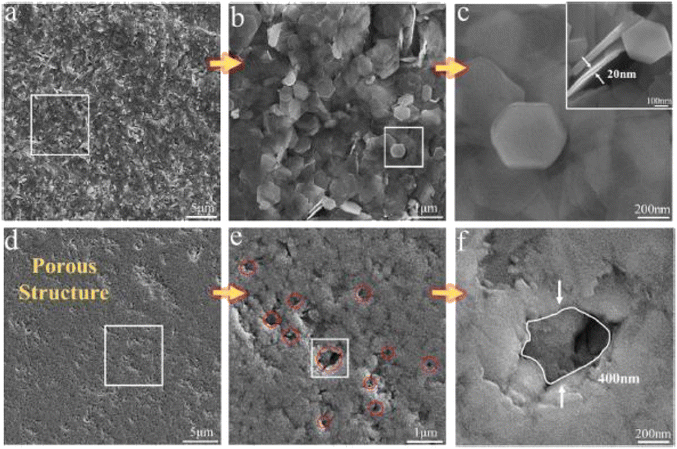 |
| | Fig. 6 SEM images: (a) as-synthesized Bi2Te3 nano powder; (b) enlarged view of the selected area from image (a); (c) further enlarged view of the selected area from (b); (d) porous Bi2Te3 after sintering; (e) enlarged view of the selected area in (d); and (f) enlarge view of selected in (e). Reprinted with permission from.55 Copyright 2019, American Chemical Society. | |
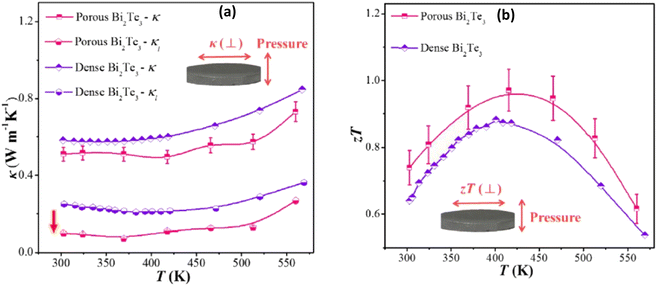 |
| | Fig. 7 Interdependence of temperature and (a) thermal conductivity and lattice thermal conductivity and (b) ZT of the as-sintered nanostructured porous Bi2Te3 pellet compared with dense nanostructured Bi2Te3. Reprinted with permission from.55 Copyright 2019, American Chemical Society. | |
The decrease in thermal conductivity is mainly due to the incorporated porosity, which leads to a large decrease in the lattice part of the thermal conductivity, as depicted in Fig. 7(a). The porous structure effectively scatters phonons at grain boundaries and the interfaces of pores, resulting in an extremely low lattice thermal conductivity of less than 0.1 W m−1 K−1 at 370 K. This ultimately leads to an improved ZT value of approximately 1, as shown in Fig. 7(b).
Porous In2O3 using template synthesis techniques
Du et al.56 prepared mesoporous In2O3 using a template synthesis method. In(NO3)3·4·5H2O was mixed in ethanol with the subsequent addition of the KIT-6 template. An oil bath was used to stir the mixture at 45 °C to remove ethanol. The obtained residual was kept for 3 h at 250 °C to convert In(NO3)3 into In2O3. NaOH was used as a leaching agent for 24 hours to remove the KIT-6 template. The solution was collected by filtration, rinsed with distilled water, and dried for 24 hours at 100 °C to form light yellow powder. The mesoporous In2O3 powders were then manually ground in an agate mortar for 10 minutes, and pellets were prepared by pressing under a static pressure of 20 MPa for 10 minutes to prepare the samples for further characterization. HRTEM images of 50 °C-In2O3 and 100 °C-In2O3 are presented in Fig. 8, which reveals that the porosity of In2O3 decreases from approximately 44% at 50 °C to 40% at 100 °C. It can be observed that both samples contain ordered pores, with 100 °C-In2O3 exhibiting a higher degree of pore ordering than 50 °C-In2O3.
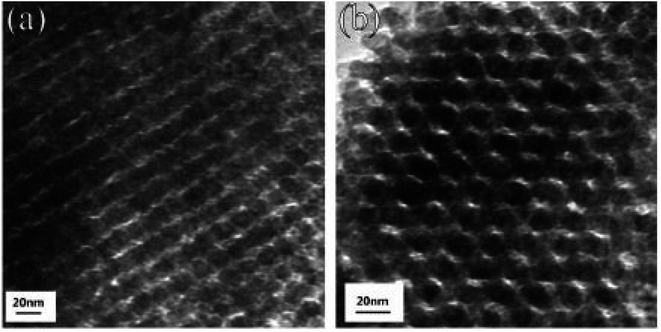 |
| | Fig. 8 HRTEM images of (a) 50 °C-In2O3 and (b) 100 °C-In2O3. Copyright 2019, Elsevier.56 | |
Fig. 9(a) depicts the thermal conductivity of In2O3 samples. It is clear from the graph that the thermal conductivity of each sample decreases consistently as the temperature increases. However, for sintered In2O3 nanocrystals (SPS-600, SPS-800, and SPS-900), thermal conductivity increases with sintering temperature. For instance, the thermal conductivity of SPS-600 is 2.28 W m−1 K−1, which increases to 9.8 W m−1 K−1 and 12.6 W m−1 K−1 at room temperature as the sintering temperature increases to 800 °C and 900 °C, respectively. Interestingly, the thermal conductivity of the two mesoporous In2O3 samples decreases significantly compared to the sintered In2O3 nanocrystals. For example, the thermal conductivities of 50 °C-In2O3 and 100 °C-In2O3 are 0.86 W m−1 K−1 and 0.58 W m−1 K−1 at room temperature, respectively, which are lower than that of SPS-900. This shows that a major factor in lowering thermal conductivity is relative porosity, where increased porosity results in lower thermal conductivity. From 50 °C to 300 °C, the ZT values of both mesoporous In2O3 and SPS-treated In2O3 nanocrystals are depicted in Fig. 9(b). The ZT of each of the In2O3 samples exhibits a monotonic increase with temperature. However, the increase in ZT values is particularly noticeable in the 50 °C-In2O3 sample, that is 0.08 at 300 °C, which is almost three times higher than that of 900 °C SPS-treated nanocrystals. These results suggest that, despite the decrease in electrical conductivity due to the introduction of a pore structure, a considerable decrease in thermal conductivity leads to a substantial improvement in ZT values. Nevertheless, when compared to other oxides, such as La0.7Sr0.3MnO3, In2O3 has demonstrated an enhancement in its ZT value, which is primarily attributed to the incorporation of pores. La0.7Sr0.3MnO3, for instance, achieves a ZT value of 0.017 at 326 °C.57
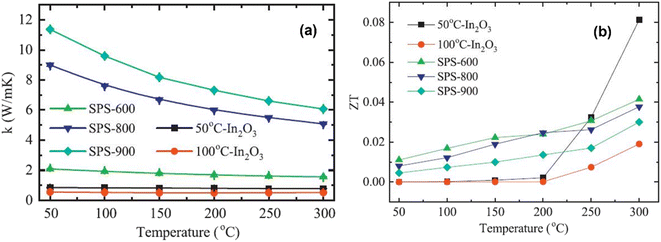 |
| | Fig. 9 Interdependence of temperature and (a) the total thermal conductivity and (b) ZT factor of mesoporous In2O3 and SPS-treated In2O3 nanocrystals. Copyright 2019, Elsevier.56 | |
Sonication-assisted synthesized porous PbTe
Hawng et al.58 prepared porous PbTe using PVA and NaCl as sacrificial materials, as illustrated in Fig. 10. Pb powder and Te powder were mixed and placed inside a silica tube in a box furnace at 1323 K for 10 h to melt them; then, they were allowed to cool to ambient temperature. A ball mill is used to grind the obtained ingot of PbTe into fine powder. Further, NaCl and PVA are mixed with PbTe using a high-energy ball mill, followed by the SPS technique to consolidate into a disk shape. As PVA and NaCl are highly soluble in water, disk-shaped PbTe–NaCl pellet and PbTe-PVA pellet were placed inside water for sonication to remove PVA and NaCl to form pores.
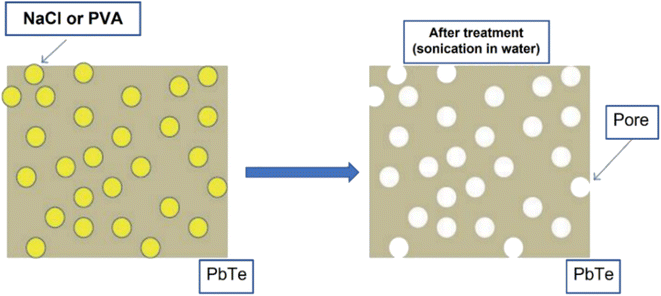 |
| | Fig. 10 Illustration of pore generation in the host matrix (PbTe) using sacrificial materials (PVA and NaCl). Reproduced from ref. 58. | |
The SEM results of densified PbTe-PVA and PbTe–NaCl samples are shown in Fig. 11(a) and (c) with a high density of 98%, respectively. However, after sonication, the densities decreased to 96% and 95% for each sample. Fig. 11(e) and (d) clearly show the presence of pores with sizes ranging from 200 nm to 2 micrometers, indicating that the sonicated samples have porosity of approximately 7.3%.
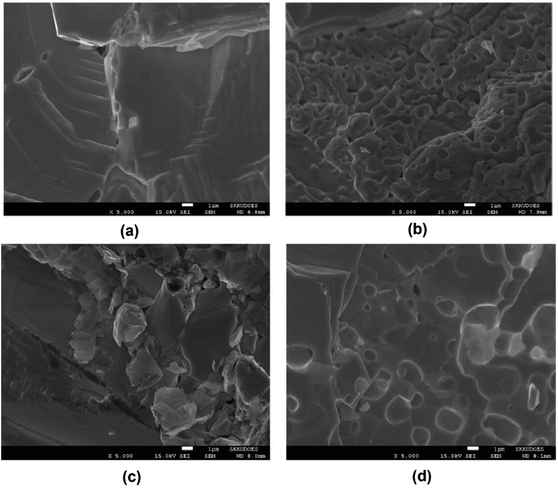 |
| | Fig. 11 SEM images: PbTe-PVA (a) prior to sonication, (b) post sonication, PbTe–NaCl, (c) prior to sonication and (d) post sonication. Reproduced from ref. 58. | |
Fig. 12(a) shows that the formation of pores can be confirmed through thermal conductivity data. Throughout the measured temperature range, the thermal conductivities of PbTe–NaCl and PbTe-PVA are smaller than that of bulk PbTe, indicating that these pores act as phonon scattering centers. It is noticeable that sonication significantly reduced the thermal conductivity of PbTe–NaCl and PbTe-PVA, which suggests that the presence of pores induced strong phonon scattering, thereby minimizing the path for phonon transport. Fig. 12(b) shows that the introduction of porogens into the PbTe host matrix caused a change in the Seebeck coefficient values due to differences in the density and physical properties of PbTe and porogens. However, after sonication, the values of the Seebeck coefficient remain like the bulk PbTe matrix, indicating that the method of pore generation presented does not significantly increase the thermopower of the PbTe host.
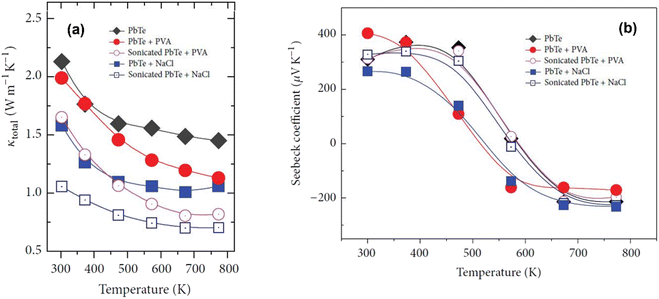 |
| | Fig. 12 Interdependence of temperature and (a) total thermal conductivities and (b) Seebeck coefficient value before and after sonication of PbTe samples. Reproduced from ref. 58. | |
Incorporating porosity in (Bi,Sb)2Te3 using NaCl as a porogen
Hao et al.59 prepared porous p-type (Bi,Sb)2Te3 using the mechanical alloying method. (Bi,Sb)2Te ingots and NaCl powder porogens were placed inside the stainless-steel jar in the presence of an argon atmosphere. Ball milling was performed at a milling speed of 470 rpm for 10 h. The obtained sample from milling was placed inside a high pressure sintering (HPS) apparatus at 3.2 GPa and 700 K for 15 min. After HPS, the sample was washed using an ultrasonic bath to remove NaCl and form a porous structure. Fractured surfaces were examined using FE-SEM images, as presented in Fig. 13. The pointed circles in Fig. 13(a) and (c) show the distribution of NaCl grains before sonication. The SEM image revealed the presence of two types of pore structure, namely closed pores and through pores, which were formed because of the removal of NaCl through ultrasonication, as depicted in Fig. 13(b) and (d). This resulted in the successful formation of porous (Bi,Sb)2Te3 through ultrasonication. The size distribution of the pores in the samples is depicted in the insets of Fig. 13, where the pore size ranges from 10 nm to 300 nm.
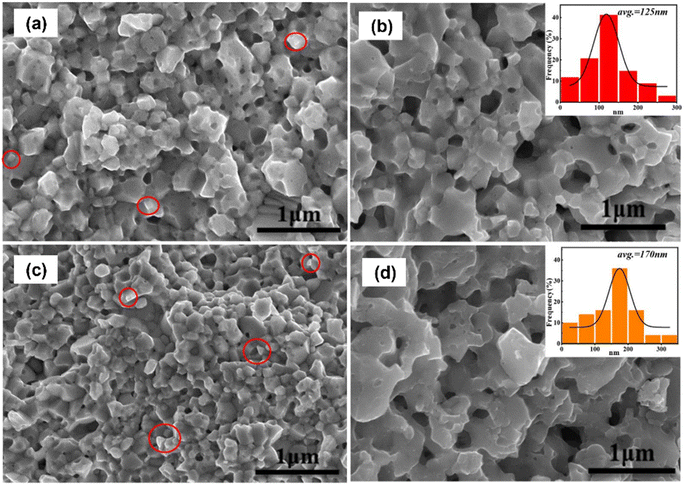 |
| | Fig. 13 FE-SEM images of NaCl-(Bi,Sb)2Te3 composite samples without washing: (a) D0.5 and (c) D1.5. NaCl grains are circled. FE-SEM images of (Bi,Sb)2Te3 composite materials after washing: (b) D1.0 and (d) D2.0. The insets in (b) and (d) represent the statistical pore size distribution of each sample. Reproduced from ref. 59. | |
The thermal conductivity of all the samples is depicted in Fig. 14(a). It is observed that as the temperature increases, there is a prominent reduction in thermal conductivity. This decrease is due to increased porosity, as this enhances phonon scattering. At 493 K, when porosity increases from 10% to 39%, thermal conductivity decreases from 0.67 to 0.39. This shows how porosity affects the overall thermal conductivity of the samples. The ZT values increase considerably as the temperature increases, as shown in Fig. 14(b). It is observed that the ZT values of porous samples are significantly increased compared to the dense sample from 373 K to 493 K. Among them, the D1.0 sample has the maximum ZT value (1.05) at 493 K, which is 33% higher than that of the D 0.0 sample (ZT = 0.79). However, compared to compact structures of Sb-based materials, AgSbTe2 demonstrates an almost 1.5 ZT at near room temperature, which is a considerably high value compared to porous (Bi,Sb)2Te3 structures.60 However, there can be numerous other parameters that need to be considered, such as synthesis conditions and slight variations in compositions.
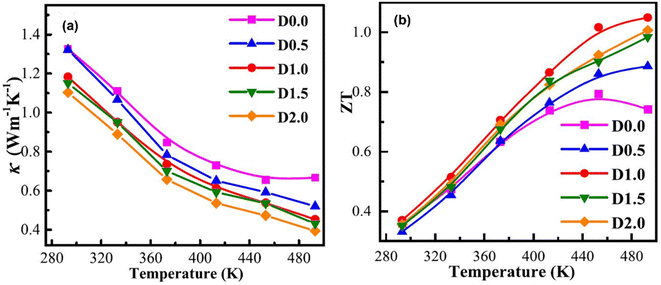 |
| | Fig. 14 Dependence of temperature on (a) total thermal conductivity and (b) ZT. Reproduce from ref. 59. | |
Porous n-type β-Ag2Se of hierarchical structure
Chen et al.61 prepared porous n-type β-Ag2Se using wet mechanical alloying method, followed by SPS sintering. Precursors, such as Ag powder, selenium powder and n-heptane, were added inside a polyamide jar under the N2 atmosphere. Then, n-heptane was used to prevent excessive cold-welding. Ball milling was performed at a speed of 500 rpm for 8 h at 10 min intervals after every 20 min. To remove n-heptane, the obtained sample was placed inside a vacuum oven for 12 h at 343 K. Further, SPS at different temperatures was used to densify the obtained sample into disk-shaped pellets. This leads to porous β-Ag2Se formation with a hierarchical structure. Fig. 15(a)–(f) shows the SEM of all the sintered samples. According to the observations, the average size of particles depicted in Fig. 15(a) is approximately 50 nm, indicating that there was no noticeable change in grain size, due to the fast-sintering process and low sintering temperature. However, when the temperature was raised to 423 K, fused nanograins with nanopores became visible, as depicted in Fig. 15(b). On further increase in sintering temperature, the size of fused particles and pores also increased, as shown in Fig. 15(c) and (d). Once the sintering surpassed 673 K temperature, the particle size ceased to grow; nonetheless, the pores continued to enlarge and damage the interfaces of adjacent particles, as shown in Fig. 15(e) and (f).
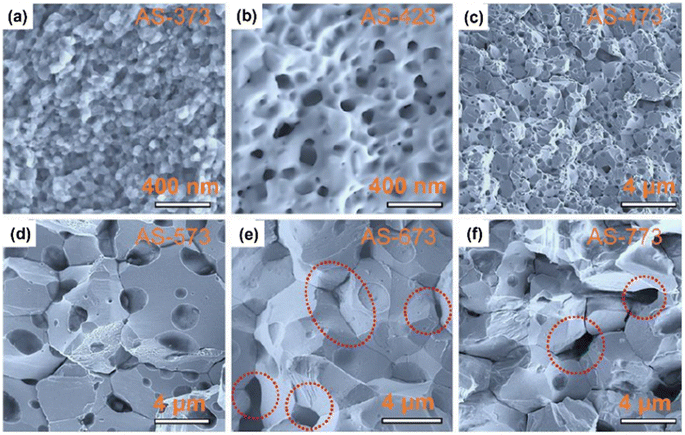 |
| | Fig. 15 SEM images of (a) AS-373, (b) AS-423, (c) AS-473, (d) AS-573, (e) AS-673, and (f) AS-773. Highlighted areas in (e) and (f) show the pores within the particles. Reprinted with permission from.61 Copyright 2020, American Chemical Society. | |
Fig. 16(a) depicts the thermal conductivity of each sample. It is evident that all samples have low thermal conductivity values, measuring below 1 W m−1 K−1. Specifically, AS-373 exhibits a thermal conductivity value of approximately 0.87 W m−1 K−1 ranging from 300 to 390 K, while the remaining samples exhibit similar thermal conductivity values, ranging from 0.75 to 0.97 W m−1 K−1. Among all the samples, AS-773 possesses the lowest thermal conductivity value measuring from 0.75 to 0.87 W m−1 K−1 due to its high porosity and low density. The reduction in the thermal conductivity value is due to the following mechanisms: strong phonon scattering at the pore interface, nano-sized grains, semi-coherent interfaces, high-density dislocations, and localized strains.
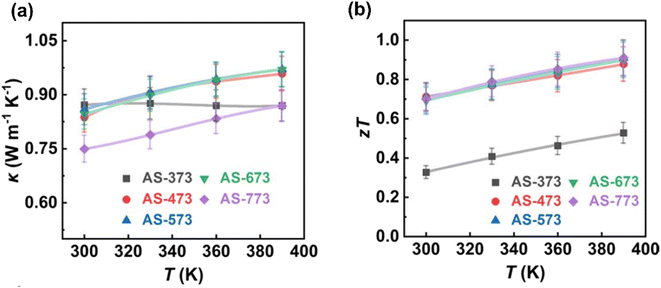 |
| | Fig. 16 Interdependence of temperature with (a) total thermal conductivity and (b) ZT. Reprinted with permission from.61 Copyright 2020, American Chemical Society. | |
Furthermore, Fig. 16(b) illustrates the ZT values. Except for AS-373, the remaining samples exhibit high ZT values, indicating that pore-size engineering enhances the transport properties of β-Ag2Se. This enhancement results in ZT values ranging from approximately 0.7 to 0.9 in the range of 300–390 K, which is consistent with findings reported in another study.62
Formation of porous YbCd2Sb2 using the annealing method
Feng et al.63 prepared porous YbCd2Sb2 using a simple annealing method. In more detail, Yd, Cd and Sb were all sealed inside a carbon-coated quartz tube and heated for 15 h at 1273 K, then cooled down to 673 K in 1 h and annealed for 48 h. The annealed ingot was ground into fine powder and sintered using SPS under an inert atmosphere with an applied pressure of 50 MPa. The dense sample after SPS was again annealed for 10 h at 773 K in a quartz tube under vacuum to remove impurities and thus obtain a high density of strain lines with porous structure, as shown in Fig. 17(d). The SEM image of YbCd2Sb2 in Fig. 17(d) shows that there are different sizes of pores distributed on the fractured surface. The pre-annealed dense surface of YbCd2Sb2 was completely different (Fig. 17(c)).
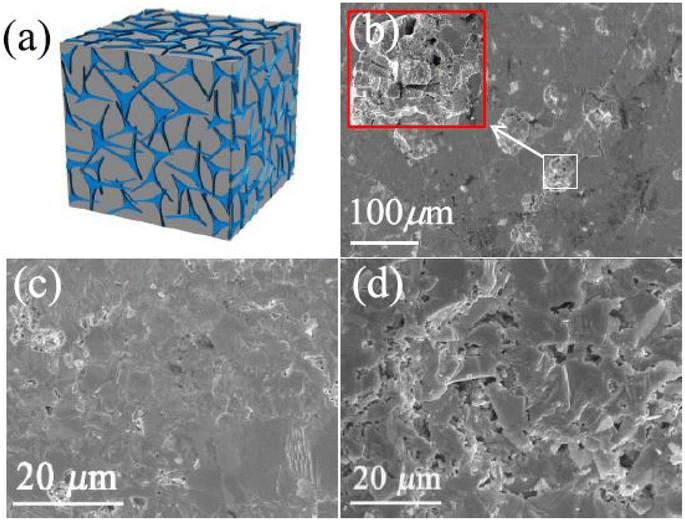 |
| | Fig. 17 Pore fabrication for YbCd2Sb2via annealing to expel impurities (a); SEM images of the surface after 10 h annealing (b); and the cracked surfaces of YbCd2Sb2-dense (c) and porous (d). Reprinted with permission from.63 Copyright 2021, American Chemical Society. | |
Fig. 18(a) shows the thermal conductivity values of YbCd2Sb2-dense/porous samples. The thermal conductivity of the porous-YbCd2Sb2 sample was reduced by 16% over the entire temperature range compared with that of dense-YbCd2Sb2. This occurs because pores induce phonon scattering, thereby leading to a decrease in thermal conductivity. Finally, the ZT value of porous YbCd2Sb2 becomes more than 1; this is greater than the average ZT value of pristine p-AB2C2, which is 0.61, as shown in Fig. 18(b).
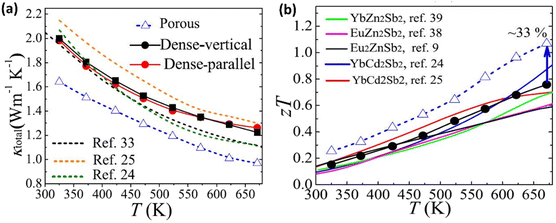 |
| | Fig. 18 Interdependence of temperature and (a) total thermal conductivity and (b) calculated ZT. Reprinted with permission from.63 Copyright 2021, American Chemical Society. | |
Pelletized nanorods of BiTeSe into porous structures
Xu et al.64 synthesized porous Bi2Te2.5Se0.5 using the solution synthesis method, followed by the SPS densification. Precursors (such as TeO2, SeO2, KOH, and PVP) were mixed in ethylene glycol and heated to 110 °C to create Bi–Te–Se. At 110 °C, N2H4·H2O was injected into the solution and maintained the temperature at 110 °C for 1 h under the flow of nitrogen, which formed Te–Se nanorods. In the next step, the obtained solution was mixed with anhydrous N2H4 and Bi(NO3)3·5H2O solution and placed for 1 h at 110 °C under nitrogen atmosphere to form Bi–Te–Se nanorods. These nanorods were heated at 140 °C for another 3 h to obtain hollow nanorods, as shown in Fig. 19(c). The obtained colloidal dispersion was washed many times before being added to the graphite die for SPS consolidation. In the last step, powder was mixed with Te and sintered under a pressure of 40 MPa and a temperature of 400 °C for 5 min in SPS, which resulted in a porous nanostructure of Bi–Te–Se, as shown in Fig. 19(d).
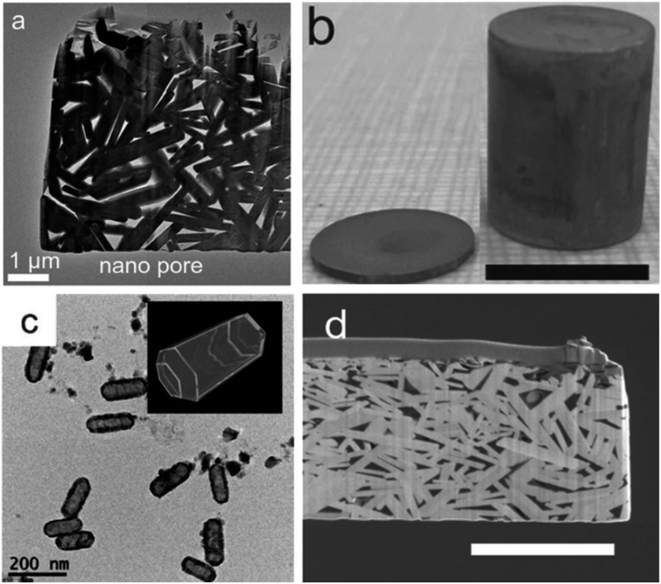 |
| | Fig. 19 (a) TEM image of the porous Bi2.02Te2.56Se0.44 nanocomposite (400 °C-sintered); (b) 400 °C-sintered pellet and cylinder, scale bar 10 mm; (c) low-magnification TEM images of Bi2Te2.5Se0.5 hollow nanorods and (d) SEM image of the FIB-cut specimen from the 400 °C-sintered disk, scale bar 2 mm. Reprinted from,64 copyright (2023), with permission from Elsevier. | |
Fig. 20(a) shows the variation in thermal conductivity with temperature for the studied samples. The 400 °C-sintered sample exhibited a decrease in thermal conductivity from 0.66 W m−1 K−1 at 313 K to 0.59 W m−1 K−1 at 438 K, followed by an increase to 0.62 W m−1 K−1 at 538 K. However, the sample sintered at 350 °C reaches its minimum thermal conductivity value of 0.48 W m−1 K−1 at 438 K. Fig. 20(b) shows the calculated ZT value. For the 350 °C-sintered sample, the ZT value was 0.61 at 313 K, which increased gradually as the temperature increased until it peaked at 1.18 at 463 K. The ZT remained above 1.0 in the range of 388 K–513 K. Similarly, a maximum ZT value of 1.0 was also attained for the 400 °C-sintered sample. The presence of large porosity, dislocation, grain boundary and alloy mass disorder contributed to the low thermal conductivity and high ZT.
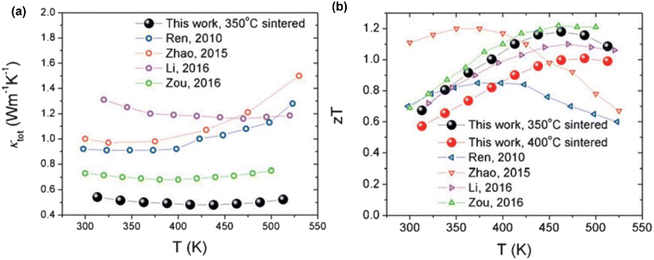 |
| | Fig. 20 Interdependence of temperature with (a) thermal conductivity and (b) calculated ZT of porous nanocomposite. Reprinted from,64 copyright (2023), with permission from Elsevier. | |
Porous Cu11.5Ni0.5Sb4S13-x via sublimation
Hu et al.65 prepared porous Cu11.5Ni0.5Sb4S13-x using the mechanical alloying method, followed by SPS sintering, as illustrated in Fig. 21(a). Raw materials (such as Cu, Sb, Ni, and S) were added into a stainless-steel jar along with sacrificial material (BiI3) according to composition in the presence of inert gas. Mechanical alloying was carried out for 10 hours at 460 rpm. The obtained powder was loaded inside a graphite die for SPS under a pressure of 50 MPa for 5 min at 723 K. Finally, the obtained sample was annealed to sublimate BiI3, which resulted in a porous microstructure, as shown in Fig. 21(c).
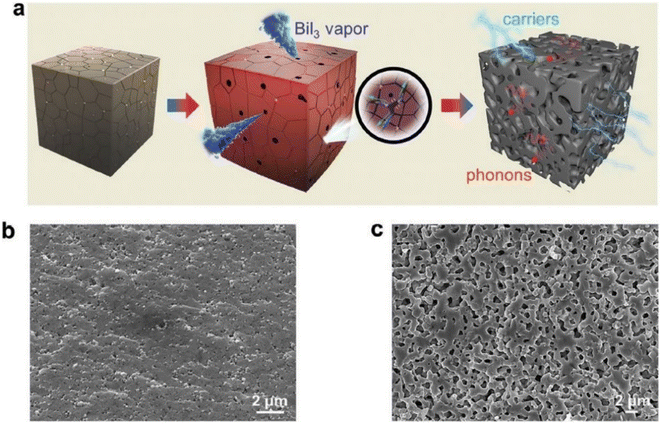 |
| | Fig. 21 (a) 3D pictorial representation of porous network generation during the BiI3 sublimation. SEM images of the fracture surface: (b) AD 0 vol% and (c) AP 0.7 vol%. Reproduce from ref. 65. | |
Fig. 22(a) shows the thermal conductivity of the annealed and unannealed samples. The UAD and AP 0.7 vol% had the lowest thermal conductivity at 723 K, measuring 0.82 W m−1 K−1, a 36% decrease from the UAD 0 vol% sample. At 573–723 K, the dense UAD x vol% (x = 0.7, 1.0) samples sharply reduced, indicating that additional phonon scattering centers were formed. The thermal conductivity of porous AP x vol% (x = 0.7, 1.0) samples remained below 0.9 W m−1 K−1 over the entire temperature range. Engineering hierarchical structures and pores within the structure significantly reduced lattice thermal conductivity, and a higher weighted mobility also led to a high ZT value of 1.15 at 723 K in porous AP 0.7 vol%, which was also an increase in UAD 0 vol% of 47.8%, as presented in Fig. 22(b).
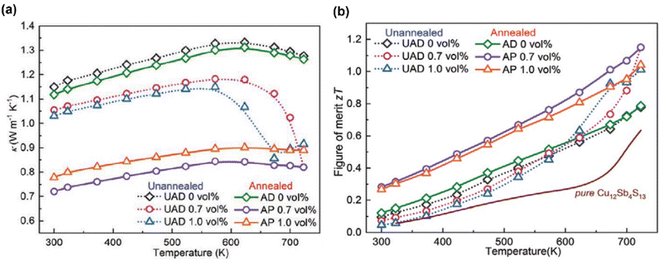 |
| | Fig. 22 Interdependence of temperature with (a) the total thermal conductivity and (b) ZT value of tetrahedrites with different compositions. Reproduce from ref. 65. | |
Nano-micro-porous skutterudites
Khan et al.66 prepared powder samples that had nano to micrometer size pores. Samples were placed in a quartz tube at 1050 °C for 5 hours. Subsequently, the furnace was cooled to 800 °C, kept for 2 hours, cooled to 600 °C and kept for 15 hours. After grinding the obtained powder, the sample was again pressed using cold isostatic pressing, and the above heating cycles were repeated using the same furnace. Following the sintering process, the samples were prepared for analysis. Fig. 23(a) depicts the SEM analysis of the sample before annealing, revealing no visible porosity. However, after annealing, pores were generated, as illustrated in Fig. 23(b) and (c).
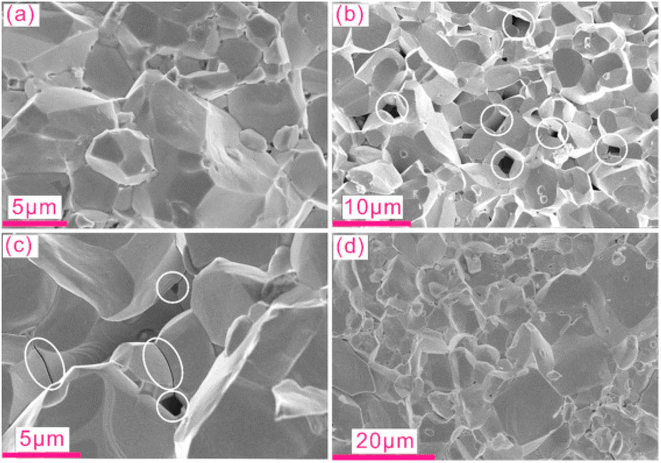 |
| | Fig. 23 SEM micrographs of different samples before and after annealing. Cracked surface of CoSb2.75Si0.075Te0.175 sample (a) prior to annealing, also called pristine, and (b) after annealing, white circles mark the pores in the materials. (c) Nanometer-scale pores along grain boundaries are observed in addition to micrometer-sized pores, while (d) indicates the absence of free Si and/or pores in CoSb2.875Si0.125 after annealing. Reproduced from ref. 66. | |
As illustrated in Fig. 24(a), the temperature dependence of the thermal conductivity is presented. The pristine sample demonstrates the highest thermal conductivity value, while samples after annealing exhibit relatively lower values. This decrease is primarily attributed to the presence of pores, which serve as additional scattering sites for phonons, thereby reducing the overall thermal conductivity. As depicted in Fig. 24(b), these modified samples show over 100% enhancement in the ZT value compared to pristine samples. It is noteworthy that, to date, the highest reported ZT value for an unfilled skutterudite stands at 1.6 around 500 °C for the Co23.4Sb69.1 alloy.
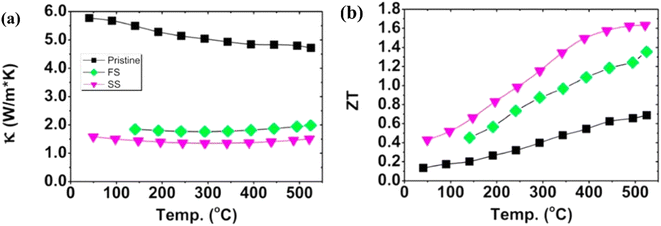 |
| | Fig. 24 Interdependence of temperature and (a) total thermal conductivity and (b) ZT value of skutterudite with different compositions. Reproduced from ref. 66. | |
The results of all the above-mentioned reports are summarized, as depicted in Fig. 25. Slight improvement in ZT has been successfully achieved by various researchers. However, no breakthrough has been reported in introducing a paradigm shift in porous thermoelectric research. In almost all these reported works, electrical properties were compromised due to porosity incorporation, as shown in Fig. 25(a).
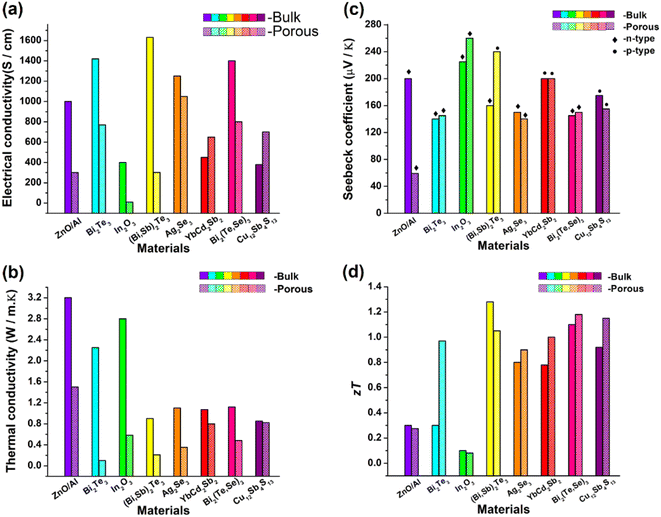 |
| | Fig. 25 Comparison between the bulk sample and porous sample of different thermoelectric materials reported in the literature. (a) Electrical conductivities of almost all samples were compromised when porosity was incorporated as porosity obstructs the flow of electrons. (b) Thermal conductivity of all the porous structures decreased due to the scattering of phonons at pore sites. However, the presence of voids or pores in a porous structure limits the number of possible channels for these heat carriers to pass through the substance. (c) Seebeck coefficient bulk vs. porous structures. (d) Figure-of-merit (ZT) values of most of the porous samples were slightly improved compared with those of bulk samples. | |
To achieve better performance of thermoelectric structures, it is necessary to suppress thermal conductivity without compromising electrical transport properties. In such a scenario, atomic scale-controlled porosity is desired in structures to effectively control the lattice part of thermal conductivity without compromising composition and density. Recently, scientists from Tokyo university67 unveiled a new mechanism to introduce controlled porosity in binary alloy systems using the dealloying technique, as illustrated in Fig. 25. The system used in this method was Si–Mg–Bi. Initially, the Si–Mg precursor was dissolved into the Bi melt. According to the phase diagram, Mg–Bi can form a homogeneous mixture, while Si–Bi was immiscible. Using this approach, Mg acted as a sacrificial element, while Si formed a porous structure using Bi as a dealloying melt. The precursor dissolved into the Bi melt when submerged, and the void was filled with Bi atoms etched away after drying, forming 3D porous Si (Fig. 26).
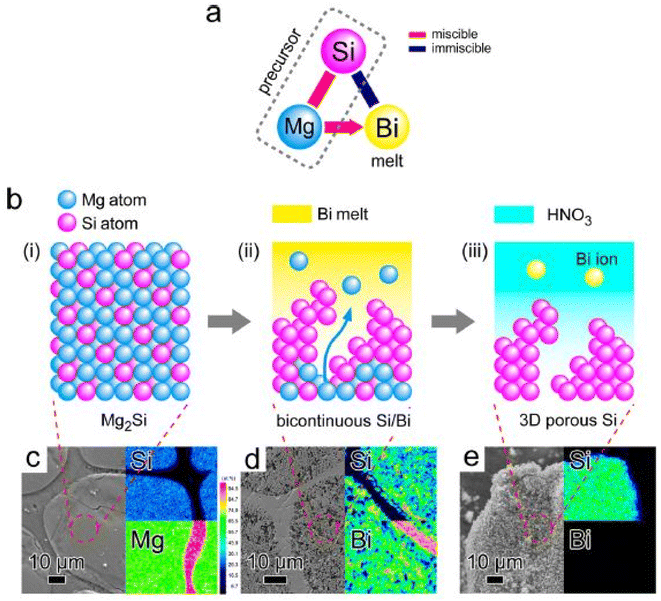 |
| | Fig. 26 (a and b) Bulk 3-dimensional silicon nanoparticle synthesized via metallic melt dealloying. SEM images with EDX mapping: (c) Si/Mg precursor, (d) after immersion in Bi, and (e) post etching. Reprinted with permission from.67 Copyright 2014, American Chemical Society. | |
The technique is effective for controlling atomic scale porosity in the binary system but is not easy for ternary alloy systems and cannot be effective for dense structures. It is difficult to obtain reasonable results if the same technique is applied to thermoelectric structures. Herein, we propose self-sacrificial element incorporation techniques to achieve controlled porosity without compromising the density, composition, and compactness of the structure. In the proposed scheme, the Se amount is intentionally kept higher than the stoichiometric in the Cu2SnSe3. During SPS sintering, the extra Se escapes from the matrix and hence leaves the Cu2SnSe3 structure with porosity, while the density and compactness are preserved. In this way, it is possible to achieve effective phonon scattering while preserving the electronic transport properties of the structure, thereby independently controlling the lattice part of the thermal conductivity. Our group is working on this idea and has already achieved the initial objectives, while the work is continued to explore it in more depth.
Conclusion
In this work, the effect of porosity on thermoelectric performance is explored in more detail with the help of previous studies conducted in this domain. This paper summarizes the research already conducted on porous thermoelectric materials and provides an in-depth analysis of the effect of porosity on thermoelectric performance. The effort is to explore the potential of porous thermoelectric structures and give future prospectives in this important area of thermoelectric research. To achieve high ZT values, it is pertinent to suppress the thermal conductivity without compromising electrical transport properties. In such a scenario, atomic scale-controlled porosity is desired in structures to effectively control the lattice part of thermal conductivity without compromising composition and density. Despite the progress made in porous thermoelectric materials research, several challenges still need to be addressed. One of the major challenges is producing atomic scale porosity without compromising the overall density of the structure. To tackle this issue, we suggest self-sacrificial element incorporation techniques to achieve controlled porosity without compromising the density and composition of the structure. We believe that this work will serve as a better guide for researchers interested in exploring the potential of pores in thermoelectric research.
Conflicts of interest
There are no conflicts to declare.
Acknowledgements
This work was supported by the Higher Education Commission Islamabad Pakistan, under the National Research Program for Universities (NRPU) grant (No. 2015691/NRPU/R&D/HEC/2021 2021).
References
- C. Forman, I. K. Muritala, R. Pardemann and B. Meyer, Estimating the global waste heat potential, Renewable Sustainable Energy Rev., 2016, 57, 1568–1579 CrossRef.
- J. M. Cullen and J. M. Allwood, Theoretical efficiency limits for energy conversion devices, Energy, 2010, 35(5), 2059–2069 CrossRef.
- J. R. Sootsman, D. Y. Chung and M. G. Kanatzidis, New and Old Concepts in Thermoelectric Materials, Angew. Chem., Int. Ed., 2009, 48(46), 8616–8639 CrossRef CAS PubMed.
- M. Siyar, M. Farid, H. Khan, M. A. Umar, W. H. Tanveer and A. Safdar, Controlled Morphology and Its Effects on the Thermoelectric Properties of SnSe2 Thin Films, Crystals, 2021, 11(8), 942 CrossRef CAS.
- M. Siyar, J.-Y. Cho, W.-C. Jin, E. H. Hwang, M. Kim and C. Park, Thermoelectric Properties of Cu2SnSe3-SnS Composite, Materials, 2019, 12(13), 2040 CrossRef CAS PubMed.
- J. Y. Cho, M. Siyar, S. H. Bae, J. S. Mun, M. Y. Kim and S. H. Hong,
et al., Effect of sintering pressure on electrical transport and thermoelectric properties of polycrystalline SnSe, Bull. Mater. Sci., 2020, 43(1), 63 CrossRef CAS.
- M. Siyar, J.-Y. Cho, W.-C. Jin, R. Jamil Ur and C. Park, The Effect of Substrate Temperature on the Microstructure and Thermoelectric Properties of Pulsed Laser Deposited Cu2SnSe3 Thin Film, J. Nanoelectron. Optoelectron., 2019, 14(10), 1382–1387 CrossRef CAS.
-
F. Bensebaa, Chapter 5 – Clean energy, in Interface Science and Technology, ed. Bensebaa F., Elsevier, 2013, vol. 19, pp. 279–383 Search PubMed.
- M. Hamid Elsheikh, D. A. Shnawah, M. F. M. Sabri, S. B. M. Said, M. Haji Hassan and M. B. Ali Bashir,
et al., A review on thermoelectric renewable energy: principle parameters that affect their performance, Renewable Sustainable Energy Rev., 2014, 30, 337–355 CrossRef.
- M. Massetti, F. Jiao, A. J. Ferguson, D. Zhao, K. Wijeratne and A. Würger,
et al., Unconventional Thermoelectric Materials for Energy Harvesting and Sensing Applications, Chem. Rev., 2021, 121(20), 12465–12547 CrossRef CAS PubMed.
- S. Patidar, Applications of Thermoelectric Energy: A Review, Int. J. Res. Appl. Sci. Eng. Technol., 2018, 6, 1992–1996 CrossRef.
- M. S. Dresselhaus, G. Chen, M. Y. Tang, R. G. Yang, H. Lee and D. Z. Wang,
et al., New Directions for Low-Dimensional Thermoelectric Materials, Adv. Mater., 2007, 19(8), 1043–1053 CrossRef CAS.
- G. J. Snyder and T. S. Ursell, Thermoelectric Efficiency and Compatibility, Phys. Rev. Lett., 2003, 91(14), 148301 CrossRef PubMed.
- C. Gayner and K. K. Kar, Recent advances in thermoelectric materials, Prog. Mater. Sci., 2016, 83, 330–382 CrossRef CAS.
- A. Ducka, B. Trawiński, B. Bochentyn, A. Dubiel and B. Kusz, Structure and thermoelectric properties of nickel-doped copper selenide synthesised in a hydrogen atmosphere, Mater. Res. Bull., 2021, 133, 111042 CrossRef CAS.
- J.-Y. Cho, M. Siyar, W. C. Jin, E. Hwang, S.-H. Bae and S.-H. Hong,
et al., Electrical Transport and Thermoelectric Properties of SnSe–SnTe Solid Solution, Materials, 2019, 12(23), 3854 CrossRef CAS PubMed.
-
S. Singh, K. Hirata, S. K. Pandey and T. Takeuchi, Recent advances in energy harvesting from waste heat using emergent thermoelectric materials, in Emerging Materials: Design, Characterization and Applications, ed. Thoutam L. R., Tayal S. and Ajayan J., Springer Nature Singapore, Singapore, 2022, pp. 155–184 Search PubMed.
- R. H. Tarkhanyan and D. G. Niarchos, Effect of hierarchically distributed nano-to microscale skutterudite inclusions on the lattice thermal conductivity of TiNiSn-based half-Heusler alloys, J. Alloys Compd., 2018, 732, 928–934 CrossRef CAS.
- J. Yang, L. Xi, W. Qiu, L. Wu, X. Shi and L. Chen,
et al., On the tuning of electrical and thermal transport in thermoelectrics: an integrated theory–experiment perspective, npj Comput. Mater., 2016, 2(1), 15015 CrossRef CAS.
- M. Siyar, J.-Y. Cho, Y. Youn, S. Han, M. Kim and S.-H. Bae,
et al., Effect of Annealing Temperature on the Phase Transition, Band Gap and Thermoelectric Properties of Cu2SnSe3, J. Mater. Chem. C, 2018, 6(7), 1780–1788 RSC.
- M. Beekman, D. T. Morelli and G. S. Nolas, Better thermoelectrics through glass-like crystals, Nat. Mater., 2015, 14(12), 1182–1185 CrossRef CAS PubMed.
-
T. M. Tritt, Thermal Conductivity: Theory, Properties, and Applications, Springer Science & Business Media, 2005 Search PubMed.
-
Y. K. Koh, Thermal conductivity and phonon transport, in Encyclopedia of Nanotechnology, ed. Bhushan B., Springer Netherlands, Dordrecht, 2012, pp. 2704–2711 Search PubMed.
- D. G. Cahill, W. K. Ford, K. E. Goodson, G. D. Mahan, A. Majumdar and H. J. Maris,
et al., Nanoscale thermal transport, J. Appl. Phys., 2003, 93(2), 793–818 CrossRef CAS.
- M. G. Holland, Analysis of Lattice Thermal Conductivity, Phys. Rev., 1963, 132, 2461–2471 CrossRef CAS.
-
P. G. Klemens, Thermal conductivity and lattice vibrational modes, in Solid State Physics, ed. Seitz F. and Turnbull D., Academic Press, 1958, vol. 7, pp. 1–98 Search PubMed.
- P. G. Klemens, Theory of lattice thermal conductivity: role of low-frequency phonons, Int. J. Thermophys., 1981, 2, 55–62 CrossRef CAS.
- K. Hirata, S. Singh and T. Takeuchi, Significantly reduced lattice thermal conductivity with anharmonic lattice vibrations and band edge effect in electronic thermal conductivity in Ag2S1-xSex (0 ≤ x ≤ 0.6), AIP Adv., 2023, 13(3), 035122 CrossRef CAS.
- K. Yadav, S. Singh, O. Muthuswamy, T. Takeuchi and K. Mukherjee, Unravelling the phonon scattering mechanism in half-Heusler alloys ZrCo1−xIrxSb (x = 0, 0.1 and 0.25), J. Phys.: Condens. Matter, 2022, 34(3), 035702 CrossRef CAS PubMed.
- S. Singh, S. Kumar Srivastav, A. Patel, A. Kumar, R. Chatterjee and T. Takeuchi,
et al., Enhancement in thermoelectric properties of n-type (La0.7Sr0.3MnO3)0.5.(NiO)0.5: composite and nano-structure effect, J. Phys. D: Appl. Phys., 2022, 55(6), 065503 CrossRef CAS.
- A. R. Muchtar, B. Srinivasan, S. L. Tonquesse, S. Singh, N. Soelami and B. Yuliarto,
et al., Physical Insights on the Lattice Softening Driven Mid-Temperature Range Thermoelectrics of Ti/Zr-Inserted SnTe—An Outlook Beyond the Horizons of Conventional Phonon Scattering and Excavation of Heikes' Equation for Estimating Carrier Properties, Adv. Energy Mater., 2021, 11(28), 2101122 CrossRef CAS.
- S. Biswas, S. Singh, S. Singh, S. Chattopadhyay, K. K. H. De Silva and M. Yoshimura,
et al., Selective Enhancement in Phonon Scattering Leads to a High Thermoelectric Figure-of-Merit in Graphene Oxide-Encapsulated ZnO Nanocomposites, ACS Appl. Mater. Interfaces, 2021, 13(20), 23771–23786 CrossRef CAS PubMed.
- R. He, T. Zhu, Y. Wang, U. Wolff, J.-C. Jaud and A. Sotnikov,
et al., Unveiling the phonon scattering mechanisms in half-Heusler thermoelectric compounds, Energy Environ. Sci., 2020, 13(12), 5165–5176 RSC.
- D. O. Lindroth and P. Erhart, Thermal transport in van der Waals solids from first-principles calculations, Phys. Rev. B, 2016, 94(11), 115205 CrossRef.
- O. Zapata-Arteaga, A. Perevedentsev, S. Marina, J. Martin, J. S. Reparaz and M. Campoy-Quiles, Reduction of the Lattice Thermal Conductivity of Polymer Semiconductors by Molecular Doping, ACS
Energy Lett., 2020, 5(9), 2972–2978 CrossRef CAS PubMed.
- J. Jang, B.-K. Koo, M.-S. Kim and J. E. Lee, Microstructure change and thermal conductivity reduction in p-type Bi–Sb–Te thermoelectric materials using a metal fatty acid as process control agent, Appl. Surf. Sci., 2023, 611, 155643 CrossRef CAS.
-
A. A. Wilson, P. J. Taylor, D. Choi and S. P. Karna, Grain boundary engineering for thermal conductivity reduction in bulk nanostructured thermoelectric materials, in Novel Thermoelectric Materials and Device Design Concepts, 2019 Search PubMed.
- C. Chen, D.-W. Liu, B.-P. Zhang and J.-F. Li, Enhanced Thermoelectric Properties Obtained by Compositional Optimization in p-Type BixSb2−xTe3 Fabricated by Mechanical Alloying and Spark Plasma Sintering, J. Electron. Mater., 2011, 40(5), 942–947 CrossRef CAS.
- H. Chen, H. Xiang, F.-Z. Dai, J. Liu, Y. Lei and J. Zhang,
et al., High porosity and low thermal conductivity high entropy (Zr0.2Hf0.2Ti0.2Nb0.2Ta0.2)C, . Journal of Materials Science & Technology, 2019, 35(8), 1700–1705 Search PubMed.
- R. L. Vekariya, A. Dhar, P. K. Paul and S. Roy, An overview of engineered porous material for energy applications: a mini-review, Ionics, 2018, 24(1), 1–17 CrossRef CAS.
- K. Zhu, N. R. Neale, A. Miedaner and A. J. Frank, Enhanced Charge-Collection Efficiencies and Light Scattering in Dye-Sensitized Solar Cells Using Oriented TiO2 Nanotubes Arrays, Nano Lett., 2007, 7(1), 69–74 CrossRef CAS PubMed.
- T. Brezesinski, J. Wang, S. H. Tolbert and B. Dunn, Next generation pseudocapacitor materials from sol–gel derived transition metal oxides, J. Sol-Gel Sci. Technol., 2011, 57(3), 330–335 CrossRef CAS.
- H. Qiao, Y. Wang, L. Xiao and L. Zhang, High lithium electroactivity of hierarchical porous rutile TiO2 nanorod microspheres, Electrochem. Commun., 2008, 10(9), 1280–1283 CrossRef CAS.
- D. J. Wales, J. Grand, V. P. Ting, R. D. Burke, K. J. Edler and C. R. Bowen,
et al., Gas sensing using porous materials for automotive applications, Chem. Soc. Rev., 2015, 44(13), 4290–4321 RSC.
- R. Sun, M. Åhlén, C.-W. Tai, É. G. Bajnóczi, F. de Kleijne and N. Ferraz,
et al., Highly Porous Amorphous Calcium Phosphate for Drug Delivery and Bio-Medical Applications, Nanomaterials, 2020, 10(1), 20 CrossRef CAS PubMed.
- V. Torres-Costa and R. J. Martín-Palma, Application of nanostructured porous silicon in the field of optics. A review, J. Mater. Sci., 2010, 45(11), 2823–2838 CrossRef CAS.
- J. Hu, C. Jiang, B. Feng, Q. Xiang, G. Li and Z. He,
et al., Introduction of porous structure: a feasible and promising method for improving thermoelectric performance of Bi2Te3 based bulks, J. Mater. Sci. Technol., 2018, 34(12), 2458–2463 CrossRef CAS.
-
T. Chaisuwan, Porous materials from polybenzoxazine, Handbook of Benzoxazine Resins, Elsevier, 2011, pp. 457–468 Search PubMed.
- P. Giulia, Thermoelectric materials: the power of pores, Nat. Rev. Mater., 2017, 2(2), 17006 CrossRef.
- Y. Yan, S. C. King, M. Li, T. Galy, M. Marszewski and J. S. Kang,
et al., Exploring the Effect of Porous Structure on Thermal Conductivity in Templated Mesoporous Silica Films, J. Phys. Chem. C, 2019, 123(35), 21721–21730 CrossRef CAS.
- T. G. Novak, K. Kim and S. Jeon, 2D and 3D nanostructuring strategies for thermoelectric materials, Nanoscale, 2019, 11(42), 19684–19699 RSC.
- T. Alexander, B. Subeshan and R. Asmatulu, Modifying the figure of merit of thermoelectric materials with inclusions of porous structures, Energy, Ecol. Environ., 2020, 5(5), 313–329 CrossRef.
- H. Lee, D. Vashaee, D. Z. Wang, M. S. Dresselhaus, Z. F. Ren and G. Chen, Effects of nanoscale porosity on thermoelectric properties of SiGe, J. Appl. Phys., 2010, 107(9), 094308 CrossRef.
- B. Zhou, L. Chen, C. Li, N. Qi, Z. Chen and X. Su,
et al., Significant Enhancement in the Thermoelectric Performance of Aluminum-Doped ZnO Tuned by Pore Structure, ACS Appl. Mater. Interfaces, 2020, 12(46), 51669–51678 CrossRef CAS PubMed.
- Y. Wang, W. D. Liu, H. Gao, L. J. Wang, M. Li and X. L. Shi,
et al., High Porosity in Nanostructured n-Type Bi(2)Te(3) Obtaining Ultralow Lattice Thermal Conductivity, ACS Appl. Mater. Interfaces, 2019, 11(34), 31237–31244 CrossRef CAS PubMed.
- K. Du, S. P. Deng, N. Qi, B. Zhou, Z. Q. Chen and X. L. Su,
et al., Ultralow Thermal Conductivity in In2O3 Mediated by Porous Structures, Microporous Mesoporous Mater., 2019, 288, 109525 CrossRef CAS.
- S. Singh, S. K. Srivastav, A. Patel, R. Chatterjee and S. K. Pandey, Effect of nanostructure on thermoelectric properties of La0.7Sr0.3MnO3 in 300–600 K temperature range, Mater. Res. Express, 2018, 5(5), 055026 CrossRef.
- J.-Y. Hwang, E. S. Kim, S. W. Hasan, S.-M. Choi, K. H. Lee and S. W. Kim, Reduction of Lattice Thermal Conductivity in PbTe Induced by Artificially Generated Pores, Adv. Condens. Matter Phys., 2015, 2015, 496739 Search PubMed.
- H. Zhao, B. Xu, Z. Ding, Y. Xue, J. Yang and W. Zhao,
et al., Enhancing Thermoelectric Properties of P-Type (Bi,Sb)2Te3 via Porous Structures, Ceram. Int., 2023, 49(3), 4305–4312 CrossRef CAS.
- S. Roychowdhury, T. Ghosh, R. Arora, M. Samanta, L. Xie and N. K. Singh,
et al., Enhanced atomic ordering leads to high thermoelectric performance in AgSbTe(2), Science, 2021, 371(6530), 722–727 CrossRef CAS PubMed.
- J. Chen, Q. Sun, D. Bao, T. Liu, W.-D. Liu and C. Liu,
et al., Hierarchical Structures Advance Thermoelectric Properties of Porous n-type β-Ag2Se, ACS Appl. Mater. Interfaces, 2020, 12(46), 51523–51529 CrossRef CAS PubMed.
- S. Singh, K. Hirata, D. Byeon, T. Matsunaga, O. Muthusamy and S. Ghodke,
et al., Investigation of Thermoelectric Properties of Ag2SxSe1−x (x = 0.0, 0.2 and 0.4), J. Electron. Mater., 2020, 49(5), 2846–2854 CrossRef CAS.
- J. Feng, W. Wang, S. Huang, B. Jiang, B. Zhu and Y. Zhou,
et al., Porous Thermoelectric Zintl: YbCd2Sb2, ACS Appl. Energy Mater., 2021, 4(1), 913–920 CrossRef CAS.
- B. Xu, T. Feng, M. T. Agne, L. Zhou, X. Ruan and G. J. Snyder,
et al., Highly Porous Thermoelectric Nanocomposites with Low Thermal Conductivity and High Figure of Merit from Large-Scale Solution-Synthesized Bi2Te2.5Se0.5 Hollow Nanostructures, Angew. Chem., Int. Ed., 2017, 56(13), 3546–3551 CrossRef CAS PubMed.
- H. Hu, H.-L. Zhuang, Y. Jiang, J. Shi, J.-W. Li and B. Cai,
et al., Thermoelectric Cu12Sb4S13-Based Synthetic Minerals with a Sublimation-Derived Porous Network, Adv. Mater., 2021, 33(43), 2103633 CrossRef CAS PubMed.
- A. U. Khan, K. Kobayashi, D.-M. Tang, Y. Yamauchi, K. Hasegawa and M. Mitome,
et al., Nano-micro-porous skutterudites with 100% enhancement in ZT for high performance thermoelectricity, Nano Energy, 2017, 31, 152–159 CrossRef CAS.
- T. Wada, T. Ichitsubo, K. Yubuta, H. Segawa, H. Yoshida and H. Kato, Bulk-Nanoporous-Silicon Negative Electrode with Extremely High Cyclability for Lithium-Ion Batteries Prepared Using a Top-Down Process, Nano Lett., 2014, 14(8), 4505–4510 CrossRef CAS PubMed.
|
| This journal is © The Royal Society of Chemistry 2024 |
Click here to see how this site uses Cookies. View our privacy policy here.  Open Access Article
 *ab and
Chan
Park
*cd
 .24–26 By increasing the temperature of the material, different modes of phonon can be excited. However, only a few of these modes are responsible for heat transfer, such as long-wavelength acoustic phonons. However, optical phonons have low group velocities and are poor carriers of heat.27 However, the mean free path of the acoustic phonon responsible for heat conduction does not remain the same and can vary by more than an order of magnitude. The mean free path can vary by changing the purity or harmonicity of the material.28,29 Anharmonic lattice vibrations involve non-linear interactions among atoms within a crystal lattice. In harmonic approximation, atoms exhibit regular and predictable vibrations around their equilibrium positions. However, real materials introduced anharmonicity, causing irregularities in these vibrations and resulting in the scattering of phonons, which are the elementary excitations responsible for heat conduction in a crystal lattice. Numerous studies have explored the effect of increasing anharmonic lattice vibrations on a decrease in lattice thermal conductivity.30–32 Another important factor is the scattering of phonons within the material, which can greatly affect its thermal conductivity. Phonon scattering is high for a structure with more defects, such as impurities, vacancies, and grain boundaries, as shown in Fig. 1.33,34 The most common methods for reducing the thermal conductivity of materials are doping,35 microstructure control,36 grain boundary engineering,37 compositional optimization,38 and incorporating porosity.39


