 Open Access Article
Creative Commons Attribution 3.0 Unported Licence
Unimer suppression enables supersaturated homopolymer swollen micelles with long-term stability after glassy entrapment†
Eric R.
Williams
,
Christian X.
Ruff
 and
Morgan
Stefik
 *
*
Department of Chemistry and Biochemistry, University of South Carolina, Columbia, SC 29208. E-mail: morgan@stefikgroup.com
First published on 8th February 2024
Abstract
Micelle sizes are critical for a range of applications where the simple ability to adjust and lock in specific stable sizes has remained largely elusive. While micelle swelling agents are well-known, their dynamic re-equilibration in solution implies limited stability. Here, a non-equilibrium processing sequence is studied where supersaturated homopolymer swelling is combined with glassy-core (“persistent”) micelles. This path-dependent process was found to sensitively depend on unimer concentration as revealed by DLS, SAXS, and TEM analysis. Here, lower-selectivity solvent combinations led to the formation of unimer-homopolymer aggregates and eventual precipitation, reminiscent of anomalous micellization. In contrast, higher-selectivity solvents enabled supersaturated homopolymer loadings favored by rapid homopolymer insertion. The demonstrated ∼40–130 nm core-size tuning exceeded prior equilibrium demonstrations and subsequent core-vitrification enabled size persistence beyond 6 months. Lastly, the linear change in micelle diameter with homopolymer addition was found to correlate with a plateau in the interfacial area per copolymer chain.
Introduction
Amphiphilic block polymer micelles have wide-ranging applications in the fields of drug delivery,1–6 nanoreactors,7–10 and as templates for organizing nanostructured materials.11,12 When in solution, the equilibrium size of a micelle is decided by a balance of entropic and enthalpic contributions to the free energy: notably the entropic contribution of core chain stretching to fill space, the entropic contribution of the corona chain stretching due to crowding/solvation, and the enthalpic contribution of the micelle-solvent interface.13 Oftentimes the free-energy contribution of the corona exceeds that of the core.14,15 This dominant entropic contribution from corona chain stretching is consistent with its typically elongated conformation when solvated and crowded environment near the core-corona interface. For example, the equilibrium interfacial area per chain (core-corona interface) was found to be almost the same for spherical, cylindrical and lamellar micelles.15 Equilibrium micelle sizes are also well known to be adjustable with hydrophobic core swelling molecules. For example, organic solvents such as 1,3,5-trimethylbenzene,16 other hydrocarbons17–22 and even high-pressure gasses23 can swell micelle cores. Thus, a range of micelle sizes are generally achievable from a single block polymer with a properly selected swelling agent.21,24 Homopolymer swelling agents benefit from being non-volatile, however, these too are generally reported with narrow tunability. For example, PEO-b-PS micelles swollen with PS homopolymer in THF led to an increase in micelle size from 26.0–39.4 nm with up to 20 wt% PS where higher loadings led to uncontrolled and multimodal size distributions.25 More recently, kinetically trapped (“persistent”) micelles of poly(ethylene oxide-b-hexyl acrylate) (PEO-b-PHA) were shown to be swellable with PHA homopolymer from 13.3–41.9 nm before transitioning to multimodal size distributions.26 These swollen persistent micelles were noted to exhibit dynamic homopolymer exchange i.e., active diffusion of homopolymer through the solvent phase from one micelle to another. Thus, the swollen state was only metastable, leading to PHA homopolymer phase separation within a day.Applications that depend upon specific micelle dimensions benefit from robust size persistence. However, dynamic (equilibrating) micelles are naturally unstable in the sense that their aggregation number is dependent upon the local environmental conditions (e.g., temperature, solvent, etc.). As noted above, the stability of persistent micelles27 swollen with homopolymer can also be limited by the active exchange of homopolymer chains.26 Here, the requirement for low molecular mass homopolymer naturally poses a challenge to χN based control, where χ is the effective interaction parameter between the homopolymer and the solvent (χhP-solvent) and N is proportional to the degree of polymerization.26–31 Glassy-core micelles offer a more robust modality of arresting chain exchange through core block vitrification rather than a fickle χN barrier, however, this approach has yet to be elaborated with homopolymer swelling. A recent study of glassy persistent micelles enumerated a set of design criteria necessary for glassy kinetic control: (1) the block polymer should feature a high-Tg core block, (2) the core block molecular mass must be sufficient to realize high-Tg behavior, and (3) all plasticizing solvents for the core block (THF, DCM, etc.) must be removed through e.g., dialysis or selective distillation after micelle formation. A distinct advantage of glassy persistent micelles is that they retain their dimensions essentially indefinitely in the absence of plasticizers or elevated temperatures. With homopolymer swollen glassy micelles being understudied, there remain many practical questions as to what changes occur at each stage of processing and how these changes correspond to fundamental driving forces.
Herein, a sequence of detailed characterizations are used to understand the changes occurring throughout the processing pathway of homopolymer-swollen glassy persistent micelles for the first time. It is first shown that the progression from non-selective to selective solvents brings about micellization of the PEO-b-PS diblock and that subsequently added homopolymer preferentially resides in the solution phase until a critical selective solvent composition is reached that drives the homopolymer into dynamic micelles. Lastly, these swollen dynamic micelles are vitrified through the removal of all plasticizing solvent, thus being dispersed in purely selective solvent. Careful analysis of the corresponding micelle dimensions as a function of homopolymer loading revealed a trend towards constant interfacial chain density, suggesting a critical chain density to limit the core-solvent interfacial energy.
Experimental
Materials
Anisole (99%, BeanTown Chemical), chloroform (>99%, Aldrich), ethanol (EtOH, 200 proof, Deacon Laboratories), methanol (MeOH, 99.8%, Fisher), and methylene chloride (DCM, 99%, Fisher) were stored over 50 vol% molecular sieves (3 Å, 8–12 mesh, Acros Organics) for a week prior to use.32 Cu(I) Br (99.99%, Aldrich), N,N,N′,N′′,N′′-pentamethyldiethylenetriamine (PMDETA, 98 + %, Acros Organics), N,N′-dicyclohexylcarbodiimide (DCC, 99%, BeanTown Chemical) and N,N-dimethyl formamide (DMF, 99.8%, Acros Organics) were all stored in an argon glovebox. L-Ascorbic acid (ACS Grade, VWR), 2-bromopropionic acid (>99%, Aldrich), Cu(II) Br (99%, Sigma), ethyl 2-bromopropionate (EBPA, 99%, Aldrich), poly(ethylene oxide) methyl ether (PEO, Mn = 5000 g mol−1, Sigma), formaldehyde (37% in aq. solution stabilized with 10–15% methanol, Alfa Aesar), hexanes (>98.5%, Fisher), phenol (crystals, ACS Grade, VWR), 4-(dimethylamino) pyridine (DMAP, 99%, Aldrich), and sodium hydroxide (Macron, 99 + %) were all used as received. Styrene (99%, stabilized, Acros Organics) was passed over a basic alumina column just prior to use to remove inhibitor.Synthesis of the (5k)PEO-Br macroinitiator
A Steglich esterification was used to produce a macroinitiator for atom transfer radical polymerization (ATRP). The macroinitiator synthesis is explained elsewhere in greater detail.28 In brief, 20 g of 5000 g mol−1 (4.0 mmol) PEO methyl ether was dissolved in 100 mL of anhydrous chloroform. Next, 1.33 mL (8.00 mmol) of 2-bromopropinoic acid was added dropwise with stirring. The flask was then chilled with an ice water bath for 10 minutes prior to the addition of 1.65 g (8.00 mmol) of DCC and 0.489 g (3.20 mmol) of DMAP. The flask was then allowed to stir for another 10 minutes before the ice bath was removed. The reaction was stirred at room temperature for 18 hours. Once the reaction had finished, the crude mixture was gravity filtered through a Whatman 2V filter paper with a diameter of 270 mm to remove the urea by-product. The solid by-product was discarded while the macroinitiator filtrate was retained. This filtrate was then concentrated into a viscous liquid by the removal of excess chloroform through rotary evaporation. The product was then precipitated in 500 mL of hexanes by a dropwise addition. The solid product was collected and allowed to dry in a vacuum chamber overnight without heat.Synthesis of the OS diblock
The PEO-b-PS diblock was prepared by activators generated by electron transfer atom transfer radical polymerization (AGET-ATRP)33 using the following molar ratios: (5k)PEO-Br![[thin space (1/6-em)]](https://www.rsc.org/images/entities/char_2009.gif) :
:![[thin space (1/6-em)]](https://www.rsc.org/images/entities/char_2009.gif) PMDETA
PMDETA![[thin space (1/6-em)]](https://www.rsc.org/images/entities/char_2009.gif) :
:![[thin space (1/6-em)]](https://www.rsc.org/images/entities/char_2009.gif) Cu(II) Br
Cu(II) Br![[thin space (1/6-em)]](https://www.rsc.org/images/entities/char_2009.gif) :
:![[thin space (1/6-em)]](https://www.rsc.org/images/entities/char_2009.gif) ascorbic acid
ascorbic acid![[thin space (1/6-em)]](https://www.rsc.org/images/entities/char_2009.gif) :
:![[thin space (1/6-em)]](https://www.rsc.org/images/entities/char_2009.gif) styrene of 1.00
styrene of 1.00![[thin space (1/6-em)]](https://www.rsc.org/images/entities/char_2009.gif) :
:![[thin space (1/6-em)]](https://www.rsc.org/images/entities/char_2009.gif) 1.00
1.00![[thin space (1/6-em)]](https://www.rsc.org/images/entities/char_2009.gif) :
:![[thin space (1/6-em)]](https://www.rsc.org/images/entities/char_2009.gif) 1.00
1.00![[thin space (1/6-em)]](https://www.rsc.org/images/entities/char_2009.gif) :
:![[thin space (1/6-em)]](https://www.rsc.org/images/entities/char_2009.gif) 0.45
0.45![[thin space (1/6-em)]](https://www.rsc.org/images/entities/char_2009.gif) :
:![[thin space (1/6-em)]](https://www.rsc.org/images/entities/char_2009.gif) 450. Styrene monomer was passed over a basic alumina column immediately prior to use to remove inhibitor. In a 100 mL round-bottom flask, 30.9 mL (270.0 mmol) of styrene was added to 3.00 g (0.600 mmol) of the previously synthesized (5k)PEO-Br macroinitiator and sealed with a rubber septum. This reaction mixture was then sparged with nitrogen gas for 20 minutes. Separately, stock solutions of ascorbic acid and Cu(II) Br were prepared in 50/50 vol% mixtures of DMF/anisole with concentrations of 12.5 and 30 mg mL−1, respectively. These solutions were also sparged with nitrogen for 10 minutes prior to taking aliquots for the polymerization. Next, 4.46 mL (0.600 mmol) of the Cu(II) Br and 3.80 mL (0.270 mmol) of the ascorbic acid stock solutions were injected into the reaction mixture. This was followed by the injection of 125 μL (0.600 mmol) of PMDETA after which time the reaction mixture was placed in an oil bath preheated to 110 °C. The reaction was allowed to proceed for 18 hours. The reaction mixture was then placed in the freezer for 1 hour and vented to air to terminate the polymerization. The crude reaction mixture was then solubilized with DCM and passed over a basic alumina column to remove the copper salts. The product was then concentrated by rotary evaporation to a viscous liquid and precipitated in 10× volume excess of room temperature MeOH by a dropwise addition. The product was collected by gravity filtration and dried under vacuum without heat prior to characterization.
450. Styrene monomer was passed over a basic alumina column immediately prior to use to remove inhibitor. In a 100 mL round-bottom flask, 30.9 mL (270.0 mmol) of styrene was added to 3.00 g (0.600 mmol) of the previously synthesized (5k)PEO-Br macroinitiator and sealed with a rubber septum. This reaction mixture was then sparged with nitrogen gas for 20 minutes. Separately, stock solutions of ascorbic acid and Cu(II) Br were prepared in 50/50 vol% mixtures of DMF/anisole with concentrations of 12.5 and 30 mg mL−1, respectively. These solutions were also sparged with nitrogen for 10 minutes prior to taking aliquots for the polymerization. Next, 4.46 mL (0.600 mmol) of the Cu(II) Br and 3.80 mL (0.270 mmol) of the ascorbic acid stock solutions were injected into the reaction mixture. This was followed by the injection of 125 μL (0.600 mmol) of PMDETA after which time the reaction mixture was placed in an oil bath preheated to 110 °C. The reaction was allowed to proceed for 18 hours. The reaction mixture was then placed in the freezer for 1 hour and vented to air to terminate the polymerization. The crude reaction mixture was then solubilized with DCM and passed over a basic alumina column to remove the copper salts. The product was then concentrated by rotary evaporation to a viscous liquid and precipitated in 10× volume excess of room temperature MeOH by a dropwise addition. The product was collected by gravity filtration and dried under vacuum without heat prior to characterization.
Synthesis of the hPS homopolymer
The hPS homopolymer was prepared by ATRP34 using the following molar ratios of EBPA![[thin space (1/6-em)]](https://www.rsc.org/images/entities/char_2009.gif) :
:![[thin space (1/6-em)]](https://www.rsc.org/images/entities/char_2009.gif) PMDETA
PMDETA![[thin space (1/6-em)]](https://www.rsc.org/images/entities/char_2009.gif) :
:![[thin space (1/6-em)]](https://www.rsc.org/images/entities/char_2009.gif) Cu(I) Br
Cu(I) Br![[thin space (1/6-em)]](https://www.rsc.org/images/entities/char_2009.gif) :
:![[thin space (1/6-em)]](https://www.rsc.org/images/entities/char_2009.gif) Styrene of 1.00
Styrene of 1.00![[thin space (1/6-em)]](https://www.rsc.org/images/entities/char_2009.gif) :
:![[thin space (1/6-em)]](https://www.rsc.org/images/entities/char_2009.gif) 1.00
1.00![[thin space (1/6-em)]](https://www.rsc.org/images/entities/char_2009.gif) :
:![[thin space (1/6-em)]](https://www.rsc.org/images/entities/char_2009.gif) 1.00
1.00![[thin space (1/6-em)]](https://www.rsc.org/images/entities/char_2009.gif) :
:![[thin space (1/6-em)]](https://www.rsc.org/images/entities/char_2009.gif) 100. Styrene monomer was passed over a basic alumina column immediately prior to use to remove inhibitor. A volume of 6.32 mL (55.2 mmol) of styrene was combined with 71.7 μL (0.552 mmol) of ethyl 2-bromopropionate in a 25 mL round-bottom flask and sealed with a rubber septum. In an argon glovebox, 79.2 mg (0.552 mmol) of Cu(I) Br was dissolved in 115.3 μL (0.552 mmol) of PMDETA and 0.40 mL of toluene. This solution was then injected into the reaction flask which was placed in a preheated oil bath set to 110 °C. The reaction was allowed to polymerize for 18 hours. The reaction mixture was then placed in the freezer for 1 hour and vented to air to terminate the polymerization. The crude reaction mixture was then solubilized with methylene chloride and passed over a basic alumina column to remove copper salts. The product was then concentrated by rotary evaporation to a viscous liquid and precipitated in 10× volume excess of room temperature MeOH by a dropwise addition. The product was collected by gravity filtration and dried under vacuum without heat prior to characterization.
100. Styrene monomer was passed over a basic alumina column immediately prior to use to remove inhibitor. A volume of 6.32 mL (55.2 mmol) of styrene was combined with 71.7 μL (0.552 mmol) of ethyl 2-bromopropionate in a 25 mL round-bottom flask and sealed with a rubber septum. In an argon glovebox, 79.2 mg (0.552 mmol) of Cu(I) Br was dissolved in 115.3 μL (0.552 mmol) of PMDETA and 0.40 mL of toluene. This solution was then injected into the reaction flask which was placed in a preheated oil bath set to 110 °C. The reaction was allowed to polymerize for 18 hours. The reaction mixture was then placed in the freezer for 1 hour and vented to air to terminate the polymerization. The crude reaction mixture was then solubilized with methylene chloride and passed over a basic alumina column to remove copper salts. The product was then concentrated by rotary evaporation to a viscous liquid and precipitated in 10× volume excess of room temperature MeOH by a dropwise addition. The product was collected by gravity filtration and dried under vacuum without heat prior to characterization.
Synthesis of the PF-Resol carbon precursors
Phenol-formaldehyde based carbon precursors were prepared in a previously reported manner35 with an improved purification step. In a typical synthesis, 3.05 g (32.40 mmol) of phenol crystals was dissolved in 0.65 mL (4.06 mmol) of a 20 wt% NaOH (aq.) solution. Next, 5.25 g (64.93 mmol) of the 37% formaldehyde solution was added, and the reaction was heated to 80 °C for 1 hour, during which time a color change from clear to a pale yellow was noted. The reaction mixture was then neutralized with 37% HCl and the NaCl by-product was removed by successive crystallizations from hot isopropanol at 80 °C. This process was repeated until no more NaCl crystals were evident by eye. Excess isopropanol was then removed by evaporation under reduced pressure to yield the final purified phenol-formaldehyde carbon resol.Polymer characterization
The molar mass of the OS diblock was determined using nuclear magnetic resonance (NMR) spectroscopy while gel permeation chromatography (GPC) was used to evaluate the molar mass of the hPS diblock as well as the molar mass dispersities (Đ) of both polymers. All proton NMR (1H-NMR) spectra were collected using a Bruker Avance III HD 300. The molar mass (Mn) of the OS diblock was determined by integration ratios between the aromatic styrene –C6H5 signal (δ = 6.30–7.26 ppm) and the known (5k)PEO ether signal –OCH2CH2– signal (δ = 3.66 ppm). All GPC data were collected using a Waters gel permeation chromatography GPC instrument equipped with a 515 HPLC pump, a 2410 refractive index detector and three styragel columns (HR1, HR3, HR4) in the effective molecular mass range of 0.1–5, 0.5–30, 5–600 kg mol−1, respectively. The eluent used was THF at a temperature of 30 °C and a flow rate of 1 mL min−1. The instrument was calibrated with polystyrene standards (2570, 1090, 579, 246, 130, 67.5, 34.8, 18.1, 10.4, 3.4 and 1.6 kg mol−1) received from Polymer Laboratories. The GPC samples were prepared by dissolution in THF at a concentration of ∼10 mg mL−1 and were filtered through a syringe filter with a pore diameter of 0.2 μm just prior to injection.Preparation of the glassy micelle stock swollen with hPS
The various solution compositions similarly required slightly different preparation techniques. The sample 50/50 vol% was prepared by dissolving 150 mg of OS in 5 mL of DCM, followed by the dropwise addition of 5 mL of EtOH. Please note that for all samples, the dropwise addition of EtOH was accompanied by frequent wrist stirring to aid in mixing. Similarly, the 58/42 vol% sample was prepared by dissolving the same mass of the OS polymer into 5 mL of DCM, followed by the drop-wise addition of 7 mL of EtOH. Lastly, the 63/37 vol% sample was prepared by dissolving the same mass of OS polymer into 3 mL of DCM, followed by the drop-wise addition of 5 mL of EtOH.In a separate vial, the desired amount of polystyrene homopolymer (hPS) was dissolved in DCM and EtOH was added such that the final hPS concentration was 10 mg mL−1 and the solution composition was 40 vol% EtOH, 60 vol% DCM. The hPS solution was then slowly added dropwise to the OS solution, stirring vigorously. Please note that the addition of the hPS solution to the 63/37 vol% EtOH/DCM micelle solutions will raise the DCM content in the resulting solution e.g., up to 49 vol% for sample OS-80hPS. The resulting micelle solution was then quenched by a dropwise addition of the micelle-hPS solution into 50 mL of EtOH with vigorous stirring. DCM was then removed from the solution by rotary evaporation at 40 °C. Please note that micelle samples swollen with polystyrene homopolymer are denoted as OS-XhPS where X is the mass percent of polystyrene homopolymer relative to the total mass of the OS diblock.
SAXS characterization
Small-Angle X-ray Scattering (SAXS) measurements were performed on micelle stocks in solution and carbon powders after aging heat treatments. X-ray experiments were conducted using a SAXSLab Ganesha instrument at the South Carolina SAXS Collaborative (SCSC). A Xenocs GeniX 3D microfocus source was used with a copper target to generate a monochromatic beam with a wavelength of 0.154 nm. The instrument was calibrated just prior to any measurement using the National Institute of Standards and Technology (NIST) reference material 640d silicon powder with a peak position of 2θ = 28.44°, where 2θ refers to the total scattering angle. A Pilatus 300k detector (Dectris) was used to collect the two-dimensional (2D) scattering pattern with nominal pixel dimensions of 172 × 172 μm2. The SAXS data were acquired with an X-ray flux of ∼1.2 M photons per second incident upon the sample with a sample-to-detector distance of 1502 mm. Micelle solutions were loaded into a 0.9 mm outer diameter borosilicate glass capillary (Charlessupper) followed by a flame sealing treatment and an additional sealing with candle wax. The 2D images were azimuthally integrated to yield the scattering vector and intensity using SAXSGUI software. All scattering data were background subtracted using identical capillaries with the same solvent mixture before fitting. Background subtraction was performed using the SAXSGUI software package. Unless otherwise stated, micelles in solution were fitted using the program SASFit with a comprehensive micelle form factor model that incorporated a constant background term c0. Model details are available in the ESI† section Micelle Form Factor Fitting. Some samples were fitted using McSAS version 1.3.1 using a hard sphere model with one active parameter and 200 refinement repetitions.Transmission electron microscopy (TEM)
Electron microscopy images were collected in bright-field imaging mode using a JEOL 1400 Plus Transmission Electron Microscope with an accelerating voltage of 120 keV. TEM grids were prepared by placing a 20 μL drop at 5 mg mL−1 concentration onto a carbon coated grid and allowing the sample to sit unperturbed for 5 minutes. Staining was performed by adding a 20 μL drop of 1 wt% aqueous uranyl acetate solution and wicking the grid dry after 10 minutes.Results and discussion
The ability to widely adjust micelle sizes and lock in a specific desired dimensions has remained elusive over the years. As introduced above, prior micelle swelling demonstrations either lacked size-persistence due to dynamic block polymer exchange or lacked longevity due to the dynamic exchange of homopolymer. Achieving kinetic control over both block polymer and homopolymer chains has remained challenging, with there currently being no prior reports with both of these attributes simultaneously. This challenge is in part due to a limited understanding of the sequence of events that can occur during homopolymer swelling which are further complicated by plasticization/vitrification when using glassy-core micelles. The strategy developed herein features homopolymer swelling for widely adjustable micelle core sizes through the use of a glassy core block and glassy homopolymer for long-term size-persistence following vitrification. Such kinetically controlled formation processes are naturally pathway dependent. The method studied here is based upon three steps: (1) micellization of the diblock polymer, (2) incorporation of the homopolymer, and (3) vitrification of the micelle cores. A poly(ethylene oxide-b-styrene) (PEO-b-PS, OS) was chosen as a prototypical amphiphilic block polymer which has the ability to form micelles with a glassy PS core and a solvated PEO corona in selective (hydrophilic) solvents. The following two sections detail the micellization of the block polymer followed by the addition of homopolymer to these micelles.Micellization of PEO-b-PS
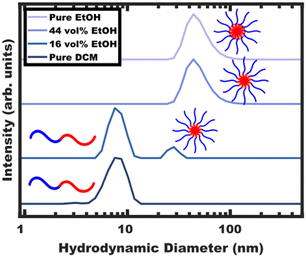
The processing began with block polymer being dispersed in a non-selective “good solvent” for both blocks. For PEO-b-PS, dichloromethane (DCM) was selected as the first solvent amongst many candidates that are plasticizing/good solvents including tetrahydrofuran (THF), N,N-dimethylformamide (DMF), chloroform, acetonitrile, ethyl acetate and toluene. The choice of DCM here is particularly motivated due to its ease of removal through selective distillation due to its low boiling point. The solution containing OS (Table S1, ESI†) in DCM was examined by DLS (Fig. 1) where the ∼8 nm hydrodynamic diameter indicates the presence of free diblock (unimer) chains without larger features suggesting a lack of micelle formation. Selective solvent was next used to induce micellization. As the final goal is to disperse glassy micelles in this selective solvent, it is important that it also be non-plasticizing towards the polystyrene core block to enable subsequent vitrification. A test towards this end is to check whether the block polymer or homopolymer are directly dispersible in this solvent. Here, direct dispersibility would indicate plasticization i.e., a solvent that is not suitable for glassy core micelles.36 For the present case of OS, ethanol (EtOH), methanol (MeOH), and water (H2O) were all found to be non-plasticizing and sufficiently selective (Fig. S4a, ESI†). This extent of selectivity is important to later control the localization of PS homopolymer (hPS), vide infra.EtOH was selected to induce micellization of OS block polymer. The progressive aggregation of OS with EtOH addition was tracked by DLS (Fig. 1) where the hydrodynamic diameter of free chains (<∼10 nm) is distinctly different from their micelle counterparts (>∼20 nm).
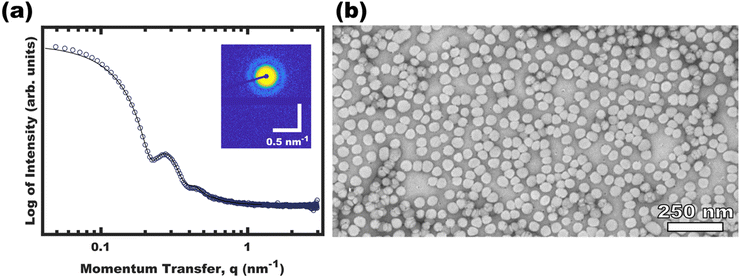
Micellization first became apparent at 16 vol% EtOH where the DLS intensity data corresponded to a majority of unimers with a minority of ∼30 nm micelles. Here, any observable quantity of free unimers indicates dynamic micelles with a constant unimer concentration equal to the critical micelle concentration (CMC). Further increasing the EtOH content to 44 vol% lead to a lack of observable unimers (decreasing CMC) and a corresponding increase in the micelle hydrodynamic diameter to ∼48 nm. Please note that the lack of observable unimers by DLS does not indicate kinetic entrapment since dilute unimers are obscured by the higher scattering strength of micelles (I ∝ dmicelle6).29 Selective removal of the DCM to yield pure EtOH as the solvent resulted in a similar ∼48 nm micelle hydrodynamic diameter without apparent unimers. The OS micelles in pure EtOH were also examined by SAXS and TEM (Fig. 2). The solution SAXS data were well-fitted using a micelle form factor (Table S2, ESI†) with a core diameter of 39.8 ± 4.0 nm (size distribution). This dimension was consistent with model-free TEM data where the micelle cores (light) were apparent after staining with an average core size of 42.1 ± 0.4 nm (error-of-the-mean). The consistent micelle core size observed under high vacuum by TEM and via solution SAXS fitting, suggest that the micelle core was not detectably solvated by the EtOH. OS micelles in pure EtOH are kinetically trapped as described previously,36 however, the micelle core size has negligible tunability without swelling agents.37,38
Addition of homopolymer to micelles: role of solvent selectivity
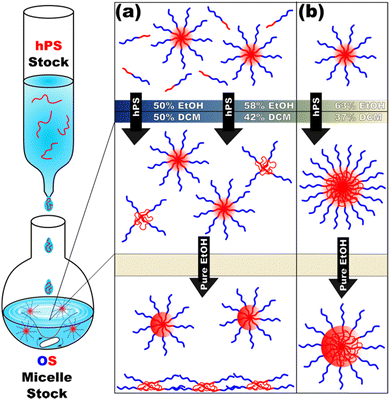
Micelle solutions were next combined with homopolymer solutions. Here, the insertion and retention of the homopolymer chains necessitates (1) that the solution is sufficiently selective that the homopolymer preferentially resides within the micelles while also (2) not being so selective that the homopolymer precipitates out of solution nor (3) vitrifies the micelle cores, locking out further homopolymer swelling.The hPS (Table S1, ESI†) used herein was insoluble in typical PS non-solvents (Fig. S4b, ESI†) and was screened with DCM/EtOH mixtures (Fig. S5, ESI†) to assess its tolerance towards cosolvent mixtures. In principle, these three conditions are satisfied by the gradual addition of selective solvent (EtOH) to a single solution of OS and hPS polymers in good solvent (DCM). Here, DLS reveals OS micellization as early as 16 vol% EtOH whereas the hPS is soluble until ∼45 vol% EtOH (Fig. S5, ESI†). Despite this apparent plausibility, the gradual increase in solvent selectivity rather led to precipitation (Fig. S6, ESI†). This precipitation when forming micelles in the presence of homopolymer is reminiscent of earlier reports on anomalous micellization.39,40 The homopolymer swelling of micelles with relatively low solvent selectivity is limited e.g., a prior report had a maximum of 20 wt% PS in PEO-b-PS when dispersed in THF.25 In contrast, our prior study of micelle swelling showed much higher supersaturated (metastable) loadings26 of homopolymer as a function of solvent selectivity. Thus, the precipitation here with gradual EtOH addition indicates that the hPS loadings are also supersaturated. A strategy was developed where pre-formed micelles serve as “sinks” to entrap hPS in micelles faster than it can precipitate. Here, hPS was dispersed as dilute unimers in DCM, with EtOH being added until the final solution composition was 60 vol% DCM, 40 vol% EtOH at a concentration of 10 mg mL−1. These solutions were then added to pre-formed OS micelle solutions with varying DCM content. The use of dilute unimers is important such that individual hPS chains are more likely to enter a micelle rather than aggregate with each other and form precipitants.
Following this plan, hPS dispersions were added to pre-formed OS micelles in DCM/EtOH mixtures of varying selectivity (Scheme 1).
Micelle solutions with solvent compositions ranging from 50–63 vol% EtOH were examined. Please note that the hPS used here is insoluble in all these compositions, thus there is an enthalpic driving force for hPS to avoid interfaces with the solvent phase. Two options for hPS are thus apparent: precipitation or combination with OS amphiphiles. Again, these experiments were biased towards the latter outcome by using dilute hPS solutions. Fig. 3 shows the SAXS scattering profiles and corresponding best-fits for OS micelle populations before and after the addition of 40 wt% hPS. The OS solutions were varied in their EtOH/DCM ratios containing: 50, 58, and 63 vol% EtOH. Since a complex mixture of sizes was noted by TEM (Fig. S10, ESI†), the SAXS data were fitted first using a Monte Carlo routine for spherical form factors without an assumed distribution profile. The number of micelle sizes were constrained to limit the extent of over-fitting. The resulting best-fits (Fig. 3 bar graphs) suggested that the OS micelles contained minor OS unimer content for the 50 and 58 vol% EtOH solutions where the addition of hPS then led to additional ∼10 nm aggregates. This perspective is consistent with the formation of unimer-homopolymer aggregates to minimize interfacial enthalpy (Scheme 1). Similar perspectives were found upon fitting these data with a micelle form factor model with bimodal distributions (Fig. S7 and Table S3, ESI†). In contrast, this analysis for OS in 63 vol% EtOH did not identify unimers in OS solution and rather led to an increase in micelle size upon homopolymer addition with minor content of unimer-homopolymer aggregates. This collection of observations indicates that higher-selectivity solvents (lower CMC value) are critical for homopolymers to swell micelle cores rather than form separate unimer-homopolymer aggregates.
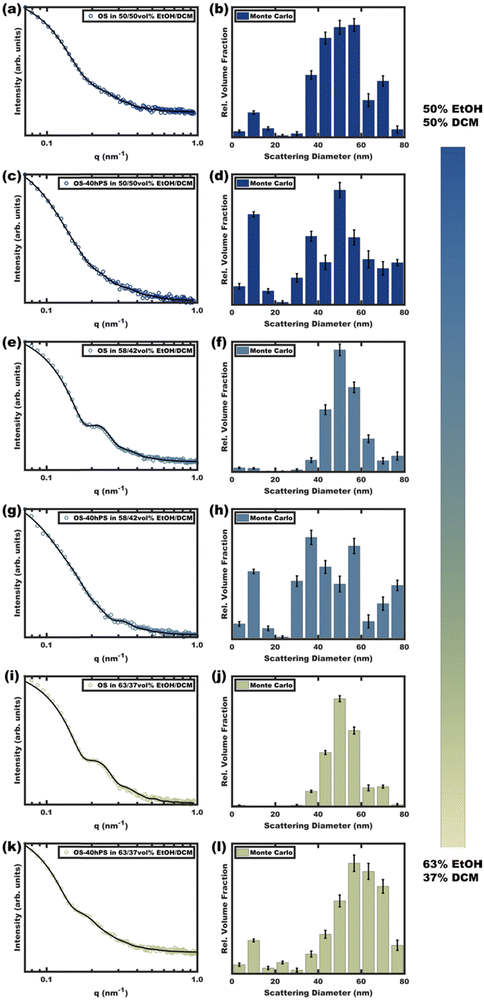 | ||
| Fig. 3 Scattering curves (a), (c), (e), (g), (i) and (k) for pure OS micelles as compared to those with 40 wt% hPS (OS–40hPS) were measured with different EtOH/DCM compositions for the OS solution where DCM core-swelling is anticipated. Monte Carlo fitting was used to reveal additional smaller size clusters (b), (d), (f), (h), (j) and (l). The error bars correspond to the uncertainty of the y-values. Complimentary form factor fitting with dual Gaussian distributions is shown in Fig. S7 (ESI†). | ||
Vitrification of the swollen glassy micelles
Having identified the conditions to realize swollen micelles with supersaturated homopolymer loadings, the next step was vitrification via the removal of plasticizers/good solvents (DCM). Again, the appropriate selection of non-selective and selective solvents based upon boiling points makes this purification facile via selective distillation.36,38 It should also be pointed out that such solvent exchanges are also generally possible via dialysis regardless of the boiling points. Having Tg > RT is also an essential attribute where the Flory-Fox equation41,42 predicts the Tg of the PS in the OS diblock polymer to be ∼97.5 °C whereas the Tg of the hPS is estimated at ∼90 °C. Thus, both the OS diblock and the hPS homopolymer are expected to be well within the high-Tg regime and are suitable for vitrification.Micelles were swollen with various amounts of hPS were vitrified by quenching in a large excess of EtOH followed by the selective distillation of DCM to leave purely EtOH as the solvent. Whereas micelle-homopolymer mixtures prepared using micelles in 50 and 58 vol% EtOH resulted in some precipitation upon DCM removal, those prepared using micelles in 63 vol% EtOH led to stable dispersions. The immobile nature of the core block after vitrification permits direct imaging by TEM since the micelles are stable when dried. Fig. 4c–h shows the expanding micelle corona size with increasing homopolymer content. The model-free TEM measurements of core diameter showed an increase of 88.1 nm from 39.8 to 127.9 nm with up to 250 wt% homopolymer loading across the series (Fig. 4b). The curious linear correlation of size to homopolymer loading will be elaborated upon in the next section. Also please note that these TEM measurements of micelle core size are performed under high vacuum and thus are exempt from the possibility of solvent-swelling. The corresponding TEM size distributional profiles are presented in Fig. S8 (ESI†). Fig. 4a shows the corresponding solution SAXS profiles of the vitrified OS micelles swollen with increasing amounts of hPS in pure EtOH. Across the series, a consistent leftward shift is noted for the scattering features corresponding to an increase in micelle size (d = 2π/q) with hPS addition. The best-fit micelle core diameters from SAXS fitting are plotted as a function of the homopolymer loading (w.r.t. OS mass) in Fig. 4b (Table S2, ESI†). The best-fit core diameters from SAXS when assuming zero solvent-swelling closely matched the TEM dimensions directly measured under high vacuum. For each extent of homopolymer swelling, this close correspondence of SAXS and TEM core sizes is consistent with a lack of solvent-core swelling and resulted in statistically indistinguishable interpretations from each technique. This would not be the case if the micelles were markedly swollen by solvent.
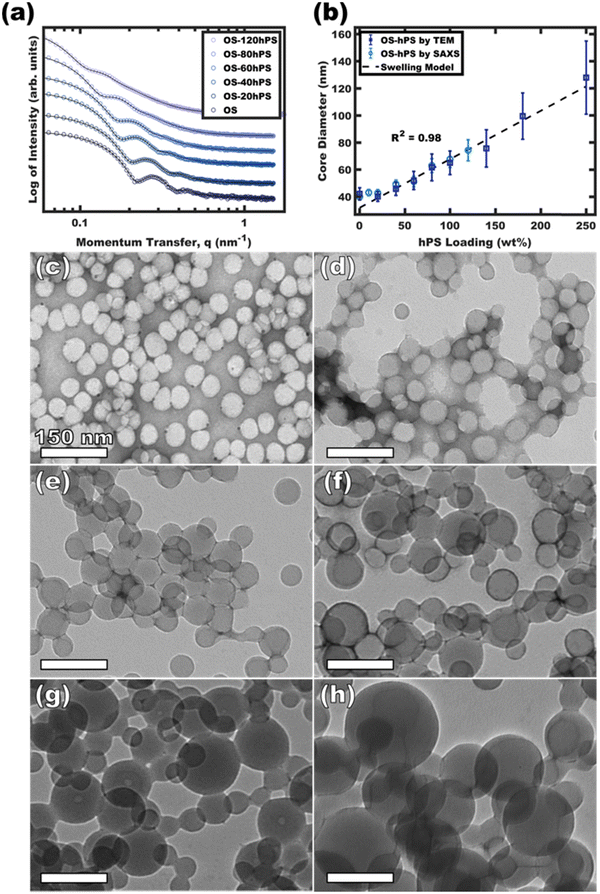 | ||
| Fig. 4 SAXS and TEM for OS micelles with increasing homopolymer loading. SAXS curves (a) were fitted to derive the core diameter distribution (b). SAXS plots were offset vertically for clarity. TEM images for OS (c), OS-60hPS (d), OS-100hPS (e), OS-140hPS (f), OS-180 hPS (g), and OS-250hPS (h) are shown with 1 wt% uranyl acetate stain to improve contrast. The core diameter distributions from TEM (vacuum) were presented alongside the pure-EtOH solution SAXS fit values were the error bars correspond to the respective size distributions (b). The TEM background varied from dark to light depending on the amount of unbound staining agent present after drying. The dashed line in (b) is based on eqn (S8) (ESI†) where constant interfacial OS chain density leads to a linear swollen micelle size trajectory as a function of hPS loading. | ||
Dynamic chain exchange and scaling laws
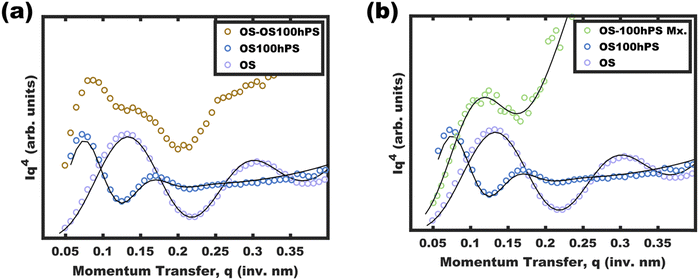
One may reasonably wonder whether these observations reflect a pseudo-equilibrium (supersaturated) or a purely kinetically trapped state. Indeed, the curious pseudolinear relationship of core diameter to hPS loading (Fig. 4b) is inconsistent with persistent micelles at the time of hPS swelling where a pseudo-cube root would be expected for this plot due to the natural scaling relationship between a volume and a linear dimension (core diameter). Whereas solvated chains follow varying scaling laws depending on solvent selectivity, rather the analysis presented here is applied to the hPS-swollen micelle measurements after transferring the micelles to the pure non-solvent (EtOH)36 where volume conservation is appropriate owing to the exclusion of solvent from the micelle cores. Furthermore, volume conservation is reasonable to apply regardless of the spatial distribution of the PS and hPS since both have essentially identical densities. First, the dynamic exchange of hPS is examined by combining unswollen OS micelles with hPS swollen micelles (OS-100hPS). Fig. 5a shows the solution SAXS pattern for unswollen OS micelles (39.8 nm), those swollen with 100 wt% hPS (67.6 nm), and their combination where features of both size distributions are apparent when dispersed in pure EtOH. Next, 30 vol% DCM was added to this mixture and after 1.5 h of stirring, a single size distribution was apparent (45.4 nm), indicating dynamic exchange of hPS and possibly also OS. Please note that the SAXS scattering profiles are presented as Iq4vs. q to highlight feature sizes since monomodal spherical form factors have undampened oscillations that are easy to see in this coordinate space.Having confirmed that hPS exchange is active for supersaturated swollen micelles (while in >30 vol% DCM mixtures), the dynamic exchange of OS chains was next examined by calculating the aggregation number (Nagg). Here, Nagg is the number of OS chains in a micelle and does not account for the amount of homopolymer chains present.
A simple equation was derived to calculate the Nagg from TEM data for homopolymer swollen micelles based on volume conservation (absence of solvent-core swelling, see ESI† for derivation and variable definitions)
 | (1) |
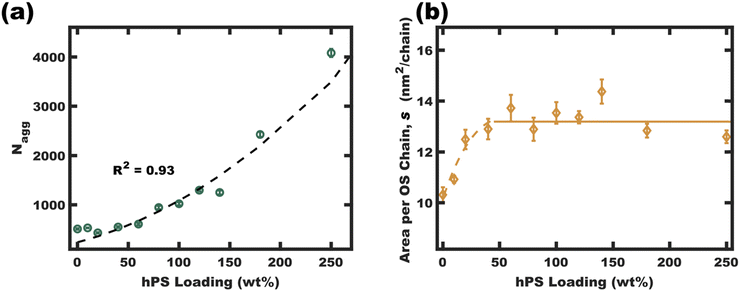 | ||
| Fig. 6 The homopolymer swollen micelle aggregation numbers (Nagg) were calculated from micelle diameters (TEM and SAXS fits in EtOH) using eqn (S5) (ESI†) (a). The interfacial area per OS chain was found to plateau at high hPS loadings, suggesting a critical interfacial OS chain density. This plateau density (average value for 50–250 wt% hPS, b solid line) led to an anticipated parabolic swelling trajectory for Nagg based upon eqn (S10) (ESI†) (a dashed line). These final values were calculated from average parameter values where the error bars correspond to the propagated uncertainty (size dispersity) for the respective measurements. | ||
The interfacial area of OS chains (s, eqn (S6), ESI†) was next examined. The interfacial area per chain (s) is presented as a function of hPS loading in Fig. 6b. This plot shows an initial increase in interfacial area per OS chain from ∼10.5 for OS micelles to a plateau average value of ∼13.2 nm2 per OS chain for most of the swelling series. This relatively constant area per chain implies a relatively constant total interfacial enthalpy in the s-plateau region. Excessively crowded OS chains (low s) would cause corona stretching whereas excessively sparse OS chains would reduce the corona screening of core-solvent interactions. This plateau may be decoupled from core chain stretching13 since the hPS can occupy the center of the micelle cores. The free-energy balance for the pseudo-equilibrium size would thus be largely a balance of constant interfacial enthalpy with respect to size-dependent entropic aspects of corona crowding. Here, corona chain stretching in 3D is determined by both the interfacial area per chain (s) and the micelle curvature (diameter). The interfacial area per chain determines the extent of corona crowding at the interface, however the interfacial curvature also determines the extent of corona crowding away from the interface. Here higher curvature interfaces expand the volume available to each chain away from the interface (Fig. S11, ESI†) and reduces the entropic cost of corona stretching (favoring smaller core sizes).43,44 Constraints of relatively constant interfacial enthalpy and specific polymer volume fractions thus imply a specific core size that minimizes free energy. It is suggested that this size-dependent free-energy leads to a uniform homopolymer distribution between micelles while also recognizing that these samples are supersaturated i.e. fundamentally non-equilibrium. Regardless, the relatively uniform core size preference is apparent with model-free TEM observations (∼10% standard deviation) which is consistent with uniform homopolymer distribution.
The apparent s-plateau suggests that the pseudo-equilibrium exchange is strongly influenced by s. This hypothetical preference for constant s-value furthermore implies specific quantitative expectations for each of the swelling trajectories presented thus far, including the parabolic trend of Nagg and the linear dependence of swollen micelle diameter upon hPS loading (Fig. 6a fitted with eqn (S8), Fig. 3b fitted with eqn (S10), ESI†). Though we26 and others25 have noted e.g., linear trends of core size with homopolymer loading, to the best of our knowledge, none have before noted this correlation with constant s-value. The trends in swollen micelle core diameters and aggregation number correlate well with a presumed constant s-value. A critical s-value also could explain the precipitation of homopolymer-unimer aggregates. The precipitates resulting from swelling micelles initially in 50/50 vol% EtOH/DCM were collected by centrifugation, dried under vacuum, and analyzed by 1H-NMR (Fig. S9, ESI†). Though the initial homogeneous solutions corresponded to 100 wt% hPS loading, these precipitates rather corresponded to 357 wt% hPS (w.r.t OS). This ξ value and the ∼10 nm core diameter of the homopolymer-unimer aggregates identified by Monte Carlo analysis of SAXS scattering patterns (Fig. 3d and h) corresponds to an area per OS chain of s = 21.1 nm2 per chain. Thus, the precipitation of these homopolymer-unimer aggregates is expected from the correspondingly high s-values when these aggregates were transferred to pure EtOH. Lastly, it was also apparent that the micelle size dispersity (Fig. 4b) increases with diameter, an effect that was previously noted and explained where increasing size leads to a weak size-dependence of interfacial area.45
Long-term stability of swollen glassy micelles
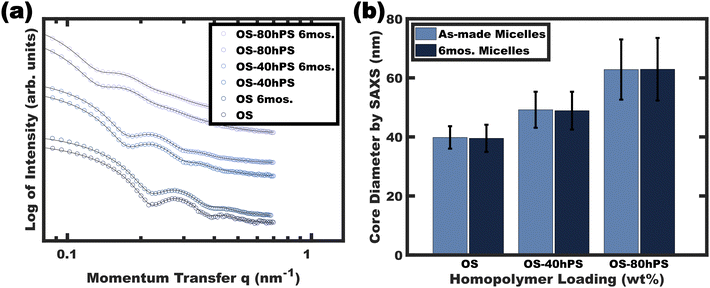
The stability of the resulting glassy swollen micelles was assessed over the course of several months after transferring to a pure EtOH solvent. As noted earlier, a prior report of homopolymer swollen persistent micelles had a limited lifespan of about a day before the non-glassy homopolymer would phase separate (again supersaturated). Fig. 7 presents the solution SAXS scattering profiles for various swollen micelles both “as-made” and after 6 months of storage. The micelle core size distributions were analyzed by again fitting the SAXS data where the resulting average micelle diameters were essentially identical to the corresponding as-made samples with less than 1% difference (Table 1). Thus, this path-dependent processing sequence is the first report to combine both wide ranging micelle sizes with long term stability.| Sample | Sit time (months) | “As-made” diameter by SAXSa (nm) | “After storage” diameter by SAXSa (nm) | % Difference |
|---|---|---|---|---|
| a As determined by form factor analysis (see experimental) on the micelle solutions in pure EtOH. | ||||
| OS | 6 | 39.8 ± 3.8 | 39.5 ± 4.6 | 0.75 |
| OS-40hPS | 6 | 49.2 ± 6.1 | 48.9 ± 6.4 | 0.61 |
| OS-80hPS | 6 | 62.8 ± 10.2 | 62.9 ± 10.6 | 0.07 |
Stability as micelle templates
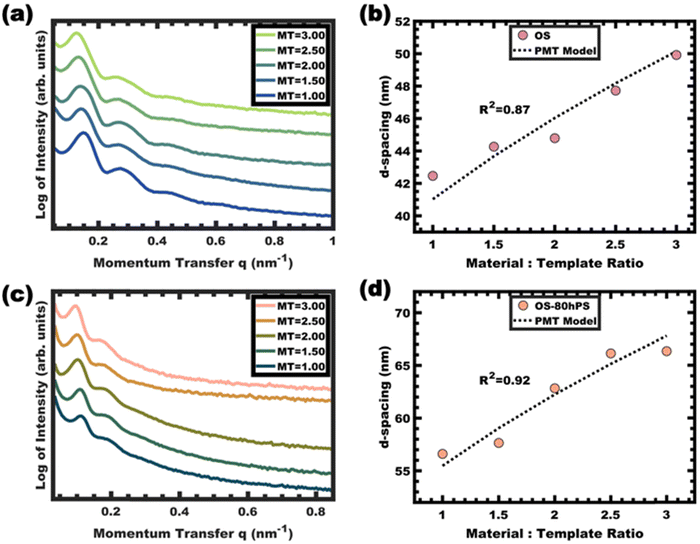
The kinetic entrapment of micelles is also verifiable by using a titration series that combines micelle templates with material precursors. Here, variation in the amount of material precursors shifts the solution composition and thus shifts the equilibrium micelle size. A methodology developed for analyzing persistent micelle templates (PMTs) has been widely used to detect onsets of chain exchange.26–31,36,38,46 A previously developed PMT SAXS model can either identify dynamic micelle behavior or identify consistency with persistent micelle behavior.28,29 This model specifically quantifies a quasi-cube root expectation for how the material-to-template ratio (amount of material added) alters the SAXS d-spacing when the micelle core size is held constant. In other words, inconsistency with the PMT model can identify dynamic chain exchange between micelles. This test was performed using phenol-formaldehyde carbon precursors as described previously.36 Glassy unswollen OS micelles were used as templates with varying material-to-template ratios. The shifts of the structure factor peaks were well-fitted by the PMT SAXS model with a goodness of fit R2 = 0.87 (Fig. 8a and b). Likewise, a series of samples were prepared from glassy and swollen micelles (OS-80hPS). Again the swollen micelles were also used as templates with varying material-to-template ratios and the SAXS measurements identified shifts of the structure factor that were well-fitted by the PMT SAXS model with a goodness-of-fit R2 = 0.92 (Fig. 8c and d). In both cases, the quantitative consistency of SAXS measurements on the templated sample series were consistent with kinetically trapped micelles. Since the templated phenol-formaldehyde carbon precursors react quite slowly, these results indicate deeply trapped micelles which was associated with their glassy cores.36Conclusions
This manuscript examined the necessary conditions to enable supersaturated homopolymer swelling of PEO-b-PS micelles. Solvent mixtures with lower selectivity and higher CMC values were found to result in homopolymer-unimer aggregates that eventually precipitated. In contrast, highly selective solvent mixtures with lower CMC values were found to enable supersaturated homopolymer swelling of micelles. This approach enabled micelle core size tunability from 39.8–127.9 nm with 250 wt% homopolymer loading which far exceeded prior equilibrium demonstrations. Furthermore the subsequent core vitrification enabled size persistence beyond 6 months. Control experiments with mixtures of unswollen and swollen micelles confirmed dynamic homopolymer exchange where subsequent calculations of aggregation number also confirmed the dynamic exchange of the block polymer. The curious trends with homopolymer loading, including a linear increase of micelle core size and parabolic increase of aggregation number, were both consistent with a pseudo-equilibrium that preserves constant interfacial area per OS chain. Such a pseudo-equilibrium is consistent with relaxed constraints for core block chain stretching where the swollen micelle thermodynamics appear largely governed by the area per OS chain which affects both the corona chain stretching and screening of core-solvent interactions.Conflicts of interest
There are no conflicts to declare.Acknowledgements
E. R. W. and M. S. acknowledge support by the NSF CAREER program, NSF Award No. DMR-1752615. C. X. R. acknowledges support by the USC Magellan Journey Grant. This work made use of the South Carolina SAXS Collaborative (SCSC).References
- K. Ulbrich, K. Holá, V. Šubr, A. Bakandritsos, J. Tuček and R. Zbořil, Chem. Rev., 2016, 116, 5338–5431 CrossRef CAS PubMed
.
- G. Chen, I. Roy, C. Yang and P. N. Prasad, Chem. Rev., 2016, 116, 2826–2885 CrossRef CAS PubMed
.
- Z. Ahmad, A. Shah, M. Siddiq and H. Kraatz, RSC Adv., 2014, 4, 17028–17038 RSC
.
- K. Kataoka, A. Harada and Y. Nagasaki, Adv. Drug Delivery Rev., 2001, 47, 113–131 CrossRef CAS PubMed
.
- K. Sandeep and V. Nekkanti, Acta Pharm. Sin. B, 2015, 5, 442–453 CrossRef PubMed
.
- H. Cabral, K. Miyata, K. Osada and K. Kataoka, Chem. Rev., 2018, 118, 6844–6892 CrossRef CAS PubMed
.
- L. Bronstein, E. Krämer, B. Berton, C. Burger, S. Förster and M. Antonietti, Chem. Mater., 1999, 11, 1402–1405 CrossRef CAS
.
- P. Khullar, V. Singh, A. Mahal, H. Kumar, G. Kaur and M. S. Bakshi, J. Phys. Chem. B, 2013, 117, 3028–3039 CrossRef CAS PubMed
.
- J. Gaitzsch, X. Huang and B. Voit, Chem. Rev., 2015, 116, 1063–1093 Search PubMed
.
- M. A. Würbser, P. S. Schwarz, J. Heckel, A. M. Bergmann, A. Walther and J. Boekhoven, ChemSystemsChem, 2021, 3, 2100015 CrossRef
.
- E. Bagshaw, T. J. Proust and T. J. Pinnavaia, Science, 1995, 269, 1242–1244 CrossRef PubMed
.
- P. T. Tanev and T. J. Pinnavaia, Science, 1995, 267, 865–867 CrossRef CAS PubMed
.
- A. Halperin and S. Alexander, Macromolecules, 1989, 22, 2403–2412 CrossRef CAS
.
- R. Lund, L. Willner, P. Lindner and D. Richter, Macromolecules, 2009, 42, 2686–2695 CrossRef CAS
.
- E. B. Zhulina, M. Adam, I. LaRue, S. S. Sheiko and M. Rubinstein, Macromolecules, 2005, 38, 5330–5351 CrossRef CAS
.
- J. Fan, C. Yu, J. Lei, Q. Zhang, T. Li, B. Tu, W. Zhou and D. Zhao, J. Am. Chem. Soc., 2005, 127, 10794–10795 CrossRef CAS PubMed
.
- T. Kimura, Y. Sugahara and K. Kuroda, Chem. Commun., 1998, 559–560 RSC
.
- A. Sayari, M. Kruk, M. Jaroniec and I. L. Moudrakovski, Adv. Mater., 1998, 10, 1376–1379 CrossRef CAS
.
- J. L. Blin, C. Otjacques, G. Herrier and B. Su, Langmuir, 2000, 16, 4229–4236 CrossRef CAS
.
- M. Kruk and L. Cao, Langmuir, 2007, 23, 7247–7254 CrossRef CAS PubMed
.
- M. Kruk, Acc. Chem. Res., 2012, 45, 1678–1687 CrossRef CAS PubMed
.
- M. Trivedi, F. Peng, X. Xia, P. I. Sepulveda-Medina and B. D. Vogt, Langmuir, 2019, 35, 14049–14059 CrossRef CAS PubMed
.
- J. M. O’Callaghan, H. McNamara, M. P. Copley, J. P. Hanrahan, M. A. Morris, D. C. Steytler, R. K. Heenan and J. D. Holmes, Langmuir, 2010, 26, 7725–7731 CrossRef PubMed
.
- A. Alvarez-Fernandez, M. J. Fornerod, B. Reid and S. Guldin, Langmuir, 2022, 38, 3297–3304 CrossRef CAS PubMed
.
- Y. Deng, J. Liu, C. Liu, D. Gu, Z. Sun, J. Wei, J. Zhang, L. Zhang, B. Tu and D. Zhao, Chem. Mater., 2008, 20, 7281–7286 CrossRef CAS
.
- A. Sarkar, A. Thyagarajan, A. Cole and M. Stefik, Soft Mater., 2019, 15, 5193–5203 RSC
.
- H. N. Lokupitiya, A. Jones, B. Reid, S. Guldin and M. Stefik, Chem. Mater., 2016, 28, 1653–1667 CrossRef CAS
.
- A. Sarkar and M. Stefik, J. Mater. Chem. A, 2017, 5, 11840–11853 RSC
.
- A. Sarkar, L. Evans and M. Stefik, Langmuir, 2018, 34, 5738–5749 CrossRef CAS PubMed
.
- K. A. Lantz, N. B. Clamp, W. van den Bergh, A. Sarkar and M. Stefik, Small, 2019, 15, 1900393–1900403 CrossRef PubMed
.
- E. R. Williams, W. van den Bergh and M. Stefik, Soft Matter, 2022, 18, 7917–7930 RSC
.
- D. B. G. Williams and M. Lawton, J. Org. Chem., 2010, 75, 8351–8354 CrossRef CAS PubMed
.
- K. Min, H. Gao and K. Matyjaszewski, J. Am. Chem. Soc., 2005, 127, 3825–3830 CrossRef CAS PubMed
.
- K. Matyjaszewski and J. Xia, Chem. Rev., 2001, 101, 2921–2990 CrossRef CAS PubMed
.
- Y. Meng, D. Gu, F. Zhang, Y. Shi, H. Yang, Z. Li, C. Yu, B. Tu and D. Zhao, Angew. Chem., Int. Ed., 2005, 44, 7053–7059 CrossRef CAS PubMed
.
- E. R. Williams, P. L. McMahon, J. E. Reynolds, J. L. Snider, V. Stavila, M. D. Allendorf and M. Stefik, Mater. Adv., 2021, 2, 5381–5395 RSC
.
- T. Larison and M. Stefik, Langmuir, 2021, 37, 9817–9825 CrossRef CAS PubMed
.
- W. van den Bergh, E. R. Williams, N. A. Vest, P. Chiang and M. Stefik, Langmuir, 2021, 37, 12874–12886 CrossRef CAS PubMed
.
- Z. Zhou and B. Chu, Macromolecules, 1988, 21, 2548–2554 CrossRef CAS
.
- T. P. Lodge, J. Bang, K. J. Hanley, J. Krocak, S. Dahlquist, B. Sujan and J. Ott, Langmuir, 2003, 19, 2103–2109 CrossRef CAS
.
- T. G. Fox and P. J. Flory, J. Appl. Phys., 1950, 21, 581–591 CrossRef CAS
.
- T. G. Fox and P. J. Flory, J. Polym. Sci., 1954, 14, 315–319 CrossRef CAS
.
- C. M. Wijmans and E. B. Zhulina, Macromol., 1993, 26, 7214–7224 CrossRef CAS
.
- G. Chen and E. Dormidontova, Macromol., 2022, 55, 5222–5232 CrossRef CAS
.
- L. Luo and A. Eisenberg, Langmuir, 2001, 17, 6804–6811 CrossRef CAS
.
- M. Stefik, J. Mater. Res., 2022, 37, 25–42 CrossRef CAS
.
Footnote |
| † Electronic supplementary information (ESI) available. See DOI: https://doi.org/10.1039/d3sm01754k |
| This journal is © The Royal Society of Chemistry 2024 |

