
 Open Access Article
 This Open Access Article is licensed under a
 Creative Commons Attribution 3.0 Unported Licence
One- and two-photon brightness of proteins interacting with gold. A closer look at gold–insulin conjugates†
Dipankar
Bain
 a,
Hao
Yuan
a,
Anna
Pniakowska
b,
Agata
Hajda
b,
Charlène
Bouanchaud
a,
Fabien
Chirot
a,
Clothilde
Comby-Zerbino
a,
Virginie
Gueguen-Chaignon
c,
Vlasta
Bonačić-Koutecký
d,
Joanna
Olesiak-Banska
b,
Željka
Sanader Maršić
*de and
Rodolphe
Antoine
*a
a,
Hao
Yuan
a,
Anna
Pniakowska
b,
Agata
Hajda
b,
Charlène
Bouanchaud
a,
Fabien
Chirot
a,
Clothilde
Comby-Zerbino
a,
Virginie
Gueguen-Chaignon
c,
Vlasta
Bonačić-Koutecký
d,
Joanna
Olesiak-Banska
b,
Željka
Sanader Maršić
*de and
Rodolphe
Antoine
*a
aInstitut lumière matière, UMR5306, Université Claude Bernard Lyon1-CNRS, Univ. Lyon 69622, Villeurbanne cedex, France. E-mail: rodolphe.antoine@univ-lyon1.fr
bInstitute of Advanced Materials, Wroclaw University of Science and Technology, Wybrzeże Wyspiańskiego 27, 50-370 Wroclaw, Poland
cUniversité Claude Bernard Lyon 1, CNRS UAR3444, Inserm US8, ENS de Lyon, SFR Biosciences, Lyon 69007, France
dCenter of Excellence for Science and Technology-Integration of Mediterranean Region (STIM) at Interdisciplinary Center for Advanced Sciences and Technology (ICAST), University of Split, Poljička cesta 35, 21000 Split, Croatia
eFaculty of Science, University of Split, Ruđera Boškovića 33, 21000 Split, Croatia. E-mail: zsm@pmfst.hr
First published on 16th July 2024
Abstract
Red luminophores displaying large Stokes shift and high-quantum yields are obtained when gold salts are reacted with proteins under strongly alkaline conditions. Although bovine serum albumin (BSA) has mainly been used as a protein template, other attempts to prepare red luminophores have been proposed using other proteins. Here, we report on the structural characterization and nonlinear optical properties of insulin–gold conjugates. Such conjugates display strong luminescence at ∼670 nm with quantum yields that reach 5.4%. They also display long luminescence lifetimes allowing efficient reactive oxygen species generation, with a quantum yield of 1O2 generation reaching 13%. In addition, they exhibit remarkable nonlinear optical properties and in particular a strong two-photon excited fluorescence (TPEF) cross section in the range of 800–1100 nm. By combining experimental studies and time-dependent density functional theory simulations (TD–DFT), we show the formation of insulin–Au(III) conjugates. The interaction of Au(III) ions with the aromatic rings of tyrosine induces charge transfer-like excitation in the visible range. Experimental investigations, together with molecular dynamics simulations of insulin and calculations of electronic properties in a model system, are performed to explore the origin of optical features and the structure–optical property relationship, leading the way to new concepts for nonlinear optics using protein–Au(III) conjugates.
Introduction
When gold salts are reacted with proteins at a basic pH, the reaction products exhibit large Stokes shift, red luminescence, and high quantum yields.1–8 In particular, many applications using mainly bovine serum albumin (BSA) as protein templates and gold have been reported as diagnostic and therapeutic platforms for biomedical applications.9,10Exemplified by BSA, two possible scenarios for this luminescence have been suggested: one scenario considers that BSA acts as a reacting and protecting “cage” in which gold ions are reduced by tyrosine residues under alkaline conditions and nucleate into a gold nanocluster, composed of dozens of gold atoms.11 The other scenario asserts that the red luminophore formation involves Au(III) coordination in a specific domain of serum albumin.12,13 These observations and protein structural analyses with various proteins (bovine serum albumin, ovalbumin, trypsin, and insulin) show that red luminophore formation involves Au(III) coordination with a common motif within these proteins.14
Insulin is a small protein, or more precisely a polypeptide hormone comprising only 51 amino acids. Its function primarily lies in the regulation of insulin-responsive tissues and it is related to many diseases. Insulin has no free cysteine and only 4 tyrosine residues, so it can display unique binding motifs with gold and thus be a good candidate for producing red luminophores. Attempts to characterize prepared insulin–gold samples by mass spectrometry have proved unsuccessful, emphasizing the difficulty of exploring the structure–optical property relationship taking place during the interaction of proteins with gold.5,15
In this paper, we synthesize water-soluble insulin–gold conjugates. The goal of the current preparation was to develop highly luminescent gold–insulin conjugates. Although insulin functionalized nanoclusters were reported earlier, their preparation was time consuming whereas the current synthesis process is fast and completed within 4 hours. Moreover, apart from the new preparations, the mass spectrometric characterization16 and quantitative analysis of two-photon fluorescence properties17 are new findings which have also been correlated with theoretical calculations. In particular, our quantitative analysis of two-photon properties will be very attractive for two-photon bioimaging applications.
Results and discussion
Synthesis and characterization of insulin–gold conjugate
Here, we synthesized highly luminescent insulin–gold conjugates using a one pot “green” synthesis method with a modification of the protocol reported previously.5 The reaction was carried out at physiological temperature (37 °C) at elevated pH (∼11.5), as described in detail in the Methods (see the ESI Fig. S1 and S2†). The pH of the insulin solution was in the range of pH ∼3.5–4.0. Insulin has low solubility in water, thus when we added insulin to the Au3+ solution, the latter transformed into yellowish white aggregates. Quantitative XPS measurements were compatible with one gold and one insulin stoichiometry in gold–insulin conjugates (see Table S1 and Fig. S3†). We also tried to use XPS to investigate the valence state of the gold atoms in gold–insulin conjugates. A doublet peak structure should be observed with fitted binding energies of ∼87.4 and ∼91.4 eV for Au(III) conjugates (respectively 4f7/2 and 4f5/2 doublet peaks). However, the 4f5/2 peak of Au(0) was also located at 87.6 eV.18 The facts that the content of gold (0.3%) is very low and there is overlap of 4f peaks between different oxidation states of gold led to a lack of clear evidence of Au(III) by XPS, while mass spectrometry measurements led to an unambiguous assignment (see below). As already mentioned in the Introduction, early attempts to measure the mass of the as prepared insulin–Au NCs were either unsuccessful5 or only one gold atom attached to insulin was detected in mass spectra.15 We continued the mass characterization of insulin–gold using high-resolution electrospray mass spectrometry (HR-ESI-MS). The full ESI-MS spectrum of the insulin–gold conjugates in ESI is shown in Fig. S4,† where charge states from 2+ to 4+ can be observed. For insulin, charge states n+ are given by extra protonations [Insu + nH]n+. The isotopic pattern of insulin (4+ charge state, [Insu + 4H]4+) is reproduced using the following formula: C257H383N65O77S6 (see insets in Fig. 1). When Au is complexed with insulin (4+ charge state), thanks to the isotopic distribution analysis, we observe that 3 hydrogen ions are removed from insulin. Then the isotopic pattern of insulin is reproduced using the following formula: C257H380N65O77S6Au (see insets in Fig. 1). The number of H atoms is reduced from 383 to 380 assigned to the 3 hydrogen ions removed from the insulin. At the pH value of 11.5 used for the synthesis, phenolic groups of tyrosine are deprotonated. One can thus assume that deprotonations on insulin occur on tyrosine residues.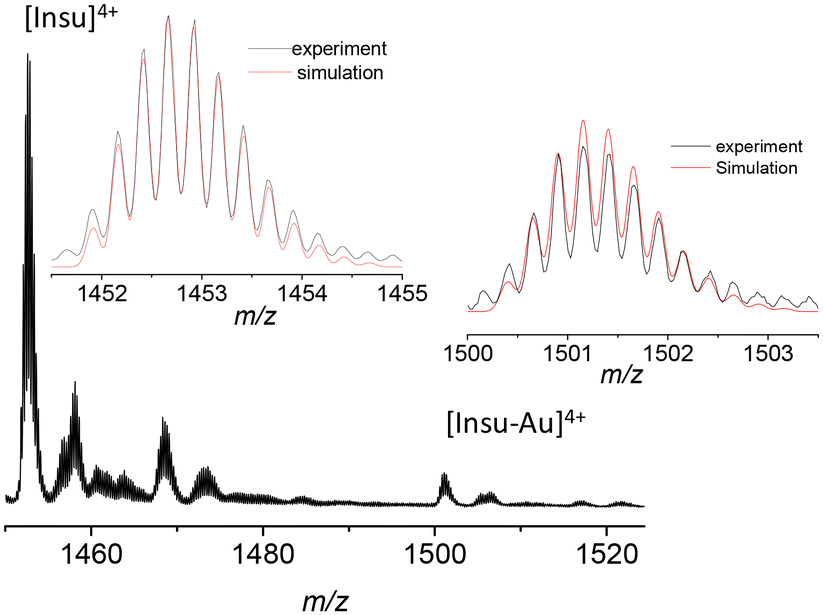 | ||
| Fig. 1 Zoom of the variable temperature-nano electrospray ionization (VT-nano-ESI) MS spectrum of insulin–gold conjugate, corresponding to the 4+ charge state (Insu for Insulin). Insets. Isotopic pattern (black: experimental, and red: simulation) of insulin (C257H383N65O77S6) on the left and of insulin with Au(III) (C257H380N65O77S6Au) on the right. The other minor peaks are mostly alkali adducts. | ||
The interaction between insulin and gold was also investigated using circular dichroism (CD) spectroscopy. Fig. S5† shows the CD spectra of pure insulin and insulin–Au conjugates. The pure insulin in neutral pH showed two negative absorption bands at ∼211 and ∼224 nm (in fair agreement with the reported CD spectrum of human insulin).19 When Au was added to insulin, only the first negative band at ∼209 nm remained, and a broad negative band emerged at ∼350 nm. The popular method for estimating protein secondary structure fractions from CD spectra (implemented in the software package CDSSTR)20 was tested on insulin and insulin–Au conjugates. The results presented in Fig. S6† indicate that the native structure of insulin is not much affected by the presence of gold (Table S2†). Only the local alpha-helix environment is affected (where 3 of the 4 tyrosine residues are in helix motifs, see Fig. 3a). It is noteworthy that crystallization tests were carried out, but no crystals were formed in the presence of gold.
Although the presence of one gold atom bound to insulin was demonstrated by HR-ESI-MS, we cannot rule out the formation of oligomers (as expected since insulin is known to easily form multimers). Indeed, in a previous study, we used a simple and reliable fluorescence-based technique to measure the hydrodynamic size of monolayer protected gold nanoclusters.8,21 This technique uses the relation between the time resolved fluorescence anisotropy decay and the hydrodynamic volume. The comparison of sizes obtained between bare proteins and gold containing proteins allowed us to address the volume changes induced by the formation of oligomers for insulin during gold incorporation.8 Interestingly, Dixon and Egusa further evidenced the formation of oligomers (approximately between dimers and tetramers) for insulin during gold incorporation, by performing native gel electrophoresis of protein–Au(III) conjugates.14 We performed native gel electrophoresis on our as-synthesized insulin–gold conjugates, also evidencing the tendency towards oligomerization during gold incorporation (see Fig. S7†). Oligomer formation was further observed by mass spectrometry (both MALDI22 and ESI-MS, see Fig. S8†). Interestingly, the VT-nano-ESI source was used to fix the sample temperature at 17 °C, thereby slowing down the aggregation.23 In parallel, we performed DLS analysis on insulin and insulin–gold conjugates, see Fig. S9.† As can be seen, dynamic light scattering shows that the mean sizes of insulin and insulin–Au conjugates are 3.8 nm and 7 nm, respectively. Thus, the presence of gold in the sample affects insulin oligomerization. To sum up, the as-synthesized insulin–gold conjugates are mainly composed of insulin–Au(III) complex resulting in oligomers (ranging from monomers to trimers).
Optical properties of the insulin–gold conjugate
Insulin–gold conjugates exhibit a long photoluminescence lifetime, suggesting that they can be capable of singlet oxygen generation,24–28 as demonstrated for other protein template gold systems.26,27 As a typical mechanism of singlet oxygen generation, after photoexcitation to an excited singlet state, the photosensitizer undergoes intersystem crossing to its triplet state, followed by energy transfer to ground-state (triplet) dioxygen (O2). Generally, excited triplet states are relatively long-lived compared with excited singlet states because of the spin-forbidden nature of the T1 → S0 transition. Here, the generation of singlet oxygen was triggered by the excitation of the conjugates with a cw laser emitting at 473 nm with different exposure times. With 1,3-diphenylisobenzofuran (DPBF, an absorption probe for detection of 1O2), 1O2 generation can be monitored by a change in the absorption of DPBF at 412 nm. The absorption spectra and the change in the absorption of DPBF monitored over time are presented in Fig. S13a).† The rate of 1O2 generation was obtained by the initial DPBF concentration change over time (Δ[DPBF]/Δt, at a shorter time where the slope has a linear behavior) divided by the concentration of the conjugates. To demonstrate the efficiency of insulin–Au for 1O2 production, we compared 1O2 production by insulin–Au to that of the conventional dye photosensitizer, new methylene blue (NMB). Under 473 nm irradiation, a high 1O2 production efficiency was observed for insulin–Au (1O2 generation rate of 1.5 ± 0.3 compared with a value for NMB of 2.3). The quantum yield of singlet oxygen generation allows normalization by the absorbance at 473 nm of the cw laser. Using a comparative method (as described in Methods and Fig. S13†), we were able to evaluate the 1O2 generation quantum yield of insulin–Au conjugates at 13 ± 5%. However, we cannot exclude that the generation of oxidizing species (H2O2, radicals) upon irradiation may also occur. To better address this point, we used a DCF dye25 for probing the oxidizing agents produced following photoexcitation. We confirm that insulin–Au conjugates are prone to producing such oxidizing agents in addition to 1O2 species. Fig. S13(c)† displays the fluorescence spectra of DCF dye without and with 10 min of laser irradiation. The strong increase in fluorescence intensity is a signature of the generation of type I species.
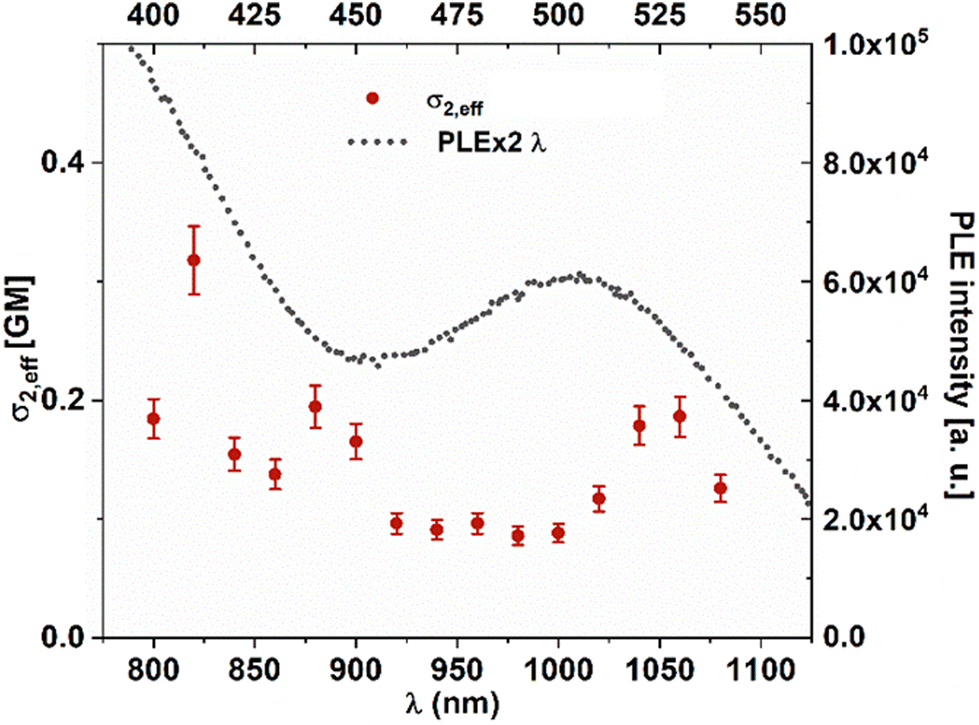 | ||
| Fig. 2 Two-photon brightness (σ2,eff) spectra of insulin–gold conjugate (red dots, left and bottom axes) correlated with the photoluminescence excitation spectrum of insulin–gold (black dotted line, right and upper axes). Brightness, defined as the product of absorption cross-section and fluorescence quantum yield. | ||
Structure–optical property relationship. Insights from calculations
This detailed structural characterization, completed with circular dichroism measurements, leads us to suggest that deprotonations on insulin occur on tyrosine residues (that are naturally deprotonated at the pH value 11.5 used for synthesis). The interaction of Au(III) ions with the aromatic rings of tyrosine may induce charge transfer-like excitation in the visible range, as we demonstrated for tryptophan bound to gold cations.32 Clearly, at high pH, other chemical groups can be deprotonated (e.g. carboxylic group, thiols). We demonstrated in our previous works on peptides interacting with gold that complexes of gold with carboxylic residues or thiol residues lead to absorption bands in the near-UV range and not in the visible range.33,34 Only deprotonated tyrosine residues interacting with gold can induce absorption in the visible range. This argumentation can thus indirectly support deprotonations of tyrosine in the insulin–gold conjugates.To benchmark the calculations, we first explored the optical properties of neutral tyrosine and doubly deprotonated tyrosine. TD-DFT absorption spectra and the lowest energy structures of tyrosine are presented in Fig. S14† and compared with the experimental spectra of tyrosine recorded at neutral and highly basic pH values. In comparison with neutral tyrosine, the overall spectrum of the deprotonated tyrosine is redshifted. A qualitative agreement between experimental and theoretical spectra is present. TD-DFT computations revealed that the nature of the well-known π–π* transition was preserved and that the bathochromism of the absorption spectrum could be explained by the energy shift of both the π and the π* orbitals under the influence of the nearby negatively charged group. A similar behavior had already been reported for tryptophan anions.35 Then, as model systems, we explored the effect of different oxidation states of gold atoms (Au(0), Au(I) and Au(III)) when added to doubly deprotonated tyrosine. The complexation of deprotonated tyrosine with gold led to the emergence of excitation in the visible range with a strong charge-transfer character (see Fig. S15†).
Insulin contains 4 tyrosines which can participate in the coordination of Au(III); their position in the structure is shown in Fig. 3(a). Tyrosine Y26 is located at the end of chain B and it is not part of the secondary structure elements of insulin. This allows for more flexibility and permits other tyrosines (Y16, Y19) to be approached in the structure and coordination of the Au(III) atom, as demonstrated by molecular dynamics simulations (see Fig. 3a). Additionally, the absorption spectrum of 4 tyrosines with Au(III) (see Fig. S17†) presents very similar features to those of 3 tyrosines with Au(III). This underlines the role of the 3 tyrosines which coordinate Au(III). Indeed, the addition of Au(III) to doubly deprotonated tyrosine leads to the dissociation of tyrosine. However, Au(III) is strongly stabilized by the complexation with three tyrosines (see Fig. 3a). The corresponding TD-DFT absorption and analysis of the main excitation responsible for the characteristic absorption features confirm the presence of excitation in the visible range with a strong charge-transfer character, as displayed in Fig. 3(b). Low-lying states in the visible range are key to obtaining large two-photon absorption cross sections, which would make them ideal labels for multiphoton excited luminescence (Fig. S16†).
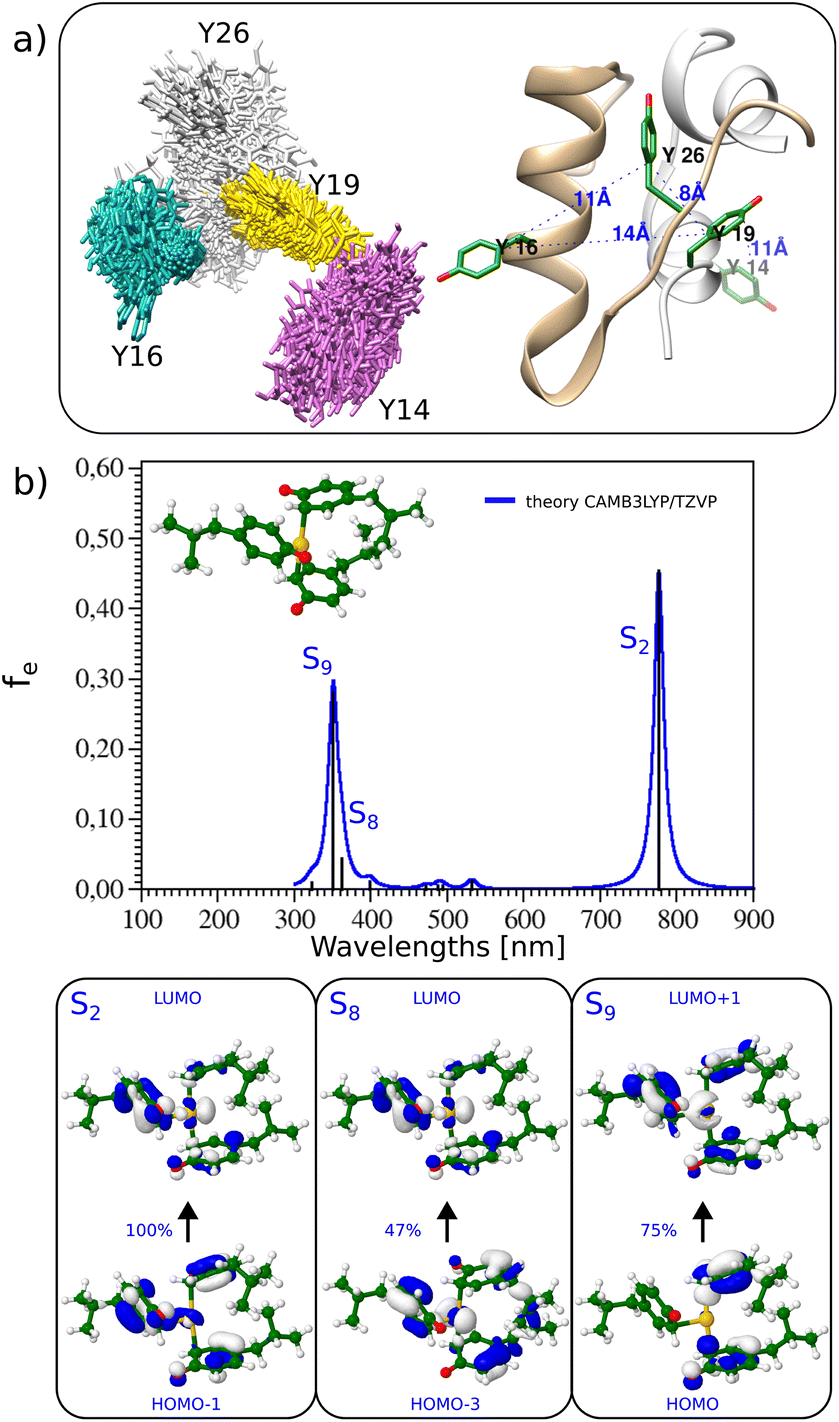 | ||
| Fig. 3 (a) (Left) Overlap of the snapshots from the molecular dynamics of insulin to check for possible tyrosine positions. The Y26 located near the end of the B chain was found to be the most flexible (silver stick representation). (Right) The position of the tyrosine residues in insulin's crystal structure (pdb: 3i40, human insulin). Chains A and B are colored gray and beige, respectively. Tyrosine residues are shown in stick representation, and colored green. Blue colored numbers indicate the distance between tyrosine residues. (b) (Top panel) TD-DFT absorption spectra and lowest energy structure of 3 tyrosines with Au(III) (both carboxylic and amino groups exchanged with methyl groups while phenolic groups are deprotonated). (Bottom panel) Leading excitation responsible for the characteristic features of absorption. | ||
Conclusions
We synthesized highly luminescent red-emitting insulin–gold conjugates using a one pot “green” synthesis method. The current synthesis process is fast and can be completed within 4 hours. The as-synthesized insulin–gold conjugates were characterized by mass spectrometry and mainly composed of insulin–Au(III) conjugates resulting in oligomers. The main effect of oligomerization is a rigidification effect leading to the enhancement of the luminescence properties, in both the linear and nonlinear optical regimes. They present long luminescence lifetimes enable efficient reactive oxygen species generation that may create oxidative stress, pointing to potential antimicrobial applications.25,36 Regarding other bio-applications, it was demonstrated by Liu et al.5 that the blood glucose-lowering activities of humulin R and insulin–Au nanoclusters showed no significant differences, which implies that the as prepared insulin–Au nanoclusters retained bioactivity in reducing blood glucose. We postulate that similar blood glucose-lowering activities would be reported with the present insulin–Au(III) conjugates, since the native structure of insulin is not greatly affected by the presence of a single Au(III) in the conjugate. Detailed structural characterization allows us to suggest that deprotonations on insulin occur on tyrosine residues. The interaction of Au(III) ions with the aromatic rings of tyrosine induces charge transfer-like excitation37 in the visible range. Deprotonated phenolic groups in tyrosine residues serve as anchors for stabilizing Au(III) ions. Model calculations can establish new concepts for nonlinear optics using protein–Au(III) conjugates. In particular, engineering mutations in proteins with tyrosines will allow more selective control of the number and the position of Au(III) ions in proteins, thereby opening up new routes for the rational control of their photophysical properties. Finally, we point out the unique character of insulin having no free cysteine and only 4 tyrosine residues, thus it serves as an ideal template for coordinating Au(III). Other proteins have high numbers of tyrosine (and other aromatic acid groups) and free cysteines where the reduction of gold (Au(III) → Au(I) → Au(0)) enters into competition and where nanoclusters can be produced and anchored.Author contributions
R. A. conceived the initial idea and coordinated the work. D. B., H. Y. synthesized and prepared the nanoclusters. C. B., C. C. Z. and F. C. recorded and analyzed mass spectra. H. Y. conducted ROS experiments with nanoclusters. A. H. A. P. and D. B. conducted circular dichroism and nonlinear optical experiments, supervised by J. O. B., Z. S. M., and V. B. K. performed and analyzed the theoretical results. V. G. C. carried out crystallization tests and DLS measurements. R. A., D. B., and H. Y. wrote the paper. All authors provided critical feedback and helped to shape the final manuscript.Data availability
The data supporting the findings of this study are available within the article and its ESI.† Additional data that support the findings of this study are available from the corresponding author upon reasonable request. This includes computational codes and raw data files generated during the study.Conflicts of interest
There are no conflicts to declare.Acknowledgements
D. B. is grateful for post-doc fellowship donated by Agence Nationale de la Recherche (project MANBAMM, ANR-21-CE29-0020). H. Y. is grateful for PhD fellowships donated by the China Scholarship Council (CSC). C. B. is grateful for a PhD fellowship donated by the Agence Nationale de la Recherche (project nanoGOLD, ANR-22-CE29-0022). R. A. and H. Y. acknowledge Shanghai Science and Technology Innovation Program (22520712500) for support. R. A. and D. B. acknowledge Agence Nationale de la Recherche (project MANBAMM, ANR-21-CE29-0020) for support. R. A. and C. C. Z. acknowledge Agence Nationale de la Recherche (project MOONSTONE, ANR-22-CE42-0031) for support R. A., C. B. and F. C. acknowledge Agence Nationale de la Recherche (project nanoGOLD, ANR-22-CE29-0022) for support. R. A., D. B., H. Y., A. H., A. P., and J. O. B. acknowledge PHC POLONIUM (Project: 49252PM, “Gold nanoclusters in chiral nanoassemblies – nonlinear optical properties”) for support. VBK acknowledges the STIM-REI project, contract KK.01.1.1.01.0003. The authors would like to thank Carol Grossiord from Science et Surface (https://www.science-et-surface.fr) for XPS spectra. We acknowledge the contribution of SFR Biosciences (Université Claude Bernard Lyon 1, CNRS UAR3444, Inserm US8, ENS de Lyon) Protein Science Facility.References
- N. Goswami, K. Zheng and J. Xie, Nanoscale, 2014, 6, 13328–13347 RSC.
- R. Antoine, D. Maysinger, L. Sancey and V. Bonačić-Koutecký, Commun. Chem., 2022, 5, 47 CrossRef CAS PubMed.
- N. Alkudaisi, B. A. Russell, B. Jachimska, D. J. S. Birch and Y. Chen, J. Mater. Chem. B, 2019, 7, 1167–1175 RSC.
- F. Wen, Y. Dong, L. Feng, S. Wang, S. Zhang and X. Zhang, Anal. Chem., 2011, 83, 1193–1196 CrossRef CAS PubMed.
- C.-L. Liu, H.-T. Wu, Y.-H. Hsiao, C.-W. Lai, C.-W. Shih, Y.-K. Peng, K.-C. Tang, H.-W. Chang, Y.-C. Chien, J.-K. Hsiao, J.-T. Cheng and P.-T. Chou, Angew. Chem., Int. Ed., 2011, 50, 7056–7060 CrossRef CAS PubMed.
- X. Xia, Y. Long and J. Wang, Anal. Chim. Acta, 2013, 772, 81–86 CrossRef CAS PubMed.
- H. Shi, M. Y. Ou, J. P. Cao and G. F. Chen, RSC Adv., 2015, 5, 86740–86745 RSC.
- A. Soleilhac, F. Bertorelle and R. Antoine, Spectrochim. Acta, Part A, 2018, 193, 283–288 CrossRef CAS PubMed.
- I. Zare, D. M. Chevrier, A. Cifuentes-Rius, N. Moradi, Y. Xianyu, S. Ghosh, L. Trapiella-Alfonso, Y. Tian, A. Shourangiz-Haghighi, S. Mukherjee, K. Fan and M. R. Hamblin, Mater. Today, 2023, 66, 159–193 CrossRef CAS.
- V. Bonačić-Koutecký, X. Le Guével and R. Antoine, ChemBioChem, 2023, 24, e202200524 CrossRef PubMed.
- J. Xie, Y. Zheng and J. Y. Ying, J. Am. Chem. Soc., 2009, 131, 888–889 CrossRef CAS PubMed.
- J. M. Dixon, J. Tomida and S. Egusa, J. Phys. Chem. Lett., 2020, 11, 3345–3349 CrossRef CAS PubMed.
- J. M. Dixon and S. Egusa, J. Am. Chem. Soc., 2018, 140, 2265–2271 CrossRef CAS PubMed.
- J. M. Dixon and S. Egusa, J. Phys. Chem. Lett., 2021, 12, 2865–2870 CrossRef CAS PubMed.
- M. Shamsipur, E. Babaee, M.-B. Gholivand, F. Molaabasi, F. Mousavi, A. Barati, B. Hajipour Verdom, B. Shojaedin-Givi and H. Naderi-Manesh, ACS Appl. Nano Mater., 2023, 6, 5939–5951 CrossRef CAS.
- C. Comby-Zerbino, X. Dagany, F. Chirot, P. Dugourd and R. Antoine, Mater. Adv., 2021, 2, 4896–4913 RSC.
- F. Bertorelle, C. Moulin, A. Soleilhac, C. Comby-Zerbino, P. Dugourd, I. Russier-Antoine, P.-F. Brevet and R. Antoine, ChemPhysChem, 2018, 19, 165–168 CrossRef CAS PubMed.
- S. Müllegger, W. Schöfberger, M. Rashidi, T. Lengauer, F. Klappenberger, K. Diller, K. Kara, J. V. Barth, E. Rauls, W. G. Schmidt and R. Koch, ACS Nano, 2011, 5, 6480–6486 CrossRef PubMed.
- S. G. Melberg and W. C. Johnson Jr., Proteins: Struct., Funct., Bioinf., 1990, 8, 280–286 CrossRef CAS PubMed.
- L. Whitmore and B. A. Wallace, Nucleic Acids Res., 2004, 32, W668–W673 CrossRef CAS PubMed.
- A. Soleilhac, F. Bertorelle, C. Comby-Zerbino, F. Chirot, N. Calin, P. Dugourd and R. Antoine, J. Phys. Chem. C, 2017, 121, 27733–27740 CrossRef CAS.
- H. Yuan, D. Lima, C. Comby-Zerbino, C. Bouanchaud, F. Chirot, D. Bain, S. Zhang and R. Antoine, Int. J. Mass Spectrom., 2024, 503, 117276 CrossRef CAS.
- W. Mohammad, K. D. Wegner, C. Comby-Zerbino, V. Trouillet, M. P. Ogayar, J.-L. Coll, R. Marin, D. J. Garcia, U. Resch-Genger, R. Antoine and X. Le Guével, J. Mater. Chem. C, 2023, 11, 14714–14724 RSC.
- H. Fakhouri, M. P. Bakulić, I. Zhang, H. Yuan, D. Bain, F. Rondepierre, P.-F. Brevet, Ž. S. Maršić, R. Antoine, V. Bonačić-Koutecký and D. Maysinger, Commun. Chem., 2023, 6, 97 CrossRef CAS PubMed.
- H. Yuan, M. Theresa, D. Bain, H. Fakhouri, K. Sreekanth, A. Ravi, S. Thomas, N. Kalarikkal, R. Antoine and E. K. Radhakrishnan, Inorg. Chem. Commun., 2024, 159, 111799 CrossRef CAS.
- V. Poderys, G. Jarockyte, S. Bagdonas, V. Karabanovas and R. Rotomskis, J. Photochem. Photobiol., B, 2020, 204, 111802 CrossRef CAS PubMed.
- M. Yamamoto, I. Osaka, K. Yamashita, H. Hasegawa, R. Arakawa and H. Kawasaki, J. Lumin., 2016, 180, 315–320 CrossRef CAS.
- H. Kawasaki, S. Kumar, G. Li, C. Zeng, D. R. Kauffman, J. Yoshimoto, Y. Iwasaki and R. Jin, Chem. Mater., 2014, 26, 2777–2788 CrossRef CAS.
- Z. Hu and L. Jensen, Chem. Sci., 2017, 8, 4595–4601 RSC.
- I. Russier-Antoine, F. Bertorelle, N. Calin, Ž. Sanader, M. Krstić, C. Comby-Zerbino, P. Dugourd, P.-F. Brevet, V. Bonačić-Koutecký and R. Antoine, Nanoscale, 2017, 9, 1221–1228 RSC.
- Ž. Sanader, M. Krstić, I. Russier-Antoine, F. Bertorelle, P. Dugourd, P.-F. Brevet, R. Antoine and V. Bonačić-Koutecký, Phys. Chem. Chem. Phys., 2016, 18, 12404–12408 RSC.
- R. Antoine, F. Bertorelle, M. Broyer, I. Compagnon, P. Dugourd, A. Kulesza, R. Mitrić and V. Bonačić-Koutecký, Angew. Chem., Int. Ed., 2009, 48, 7829–7832 CrossRef CAS PubMed.
- B. Bellina, I. Compagnon, F. Bertorelle, M. Broyer, R. Antoine, P. Dugourd, L. Gell, A. Kulesza, R. Mitric and V. Bonacic-Koutecky, J. Phys. Chem. C, 2011, 115, 24549–24554 CrossRef CAS.
- I. Russier-Antoine, F. Bertorelle, A. Kulesza, A. Soleilhac, A. Bensalah-Ledoux, S. Guy, P. Dugourd, P.-F. Brevet and R. Antoine, Prog. Nat. Sci.: Mater. Int., 2016, 26, 455–460 CrossRef CAS.
- I. Compagnon, A.-R. Allouche, F. Bertorelle, R. Antoine and P. Dugourd, Phys. Chem. Chem. Phys., 2010, 12, 3399–3403 RSC.
- S. Chakraborty, P. Sagarika, S. Rai, C. Sahi and S. Mukherjee, ACS Appl. Mater. Interfaces, 2021, 13, 36938–36947 CrossRef CAS PubMed.
- R. Antoine, T. Tabarin, M. Broyer, P. Dugourd, R. Mitrić and V. Bonačić-Koutecký, ChemPhysChem, 2006, 7, 524–528 CrossRef CAS PubMed.
Footnote |
| † Electronic supplementary information (ESI) available: Experimental. Synthesis and purification. XPS spectra. ESI- and MALDI-MS spectra. DLS and CD spectra and analysis. PAGE gels. Optical spectra and ROS measurements. TD-DFT results. See DOI: https://doi.org/10.1039/d4nr01697a |
| This journal is © The Royal Society of Chemistry 2024 |