 Open Access Article
Creative Commons Attribution 3.0 Unported Licence
Unveiling BiVO4 photoelectrocatalytic potential for CO2 reduction at ambient temperature†
Ricardo
Marques e Silva
 ab,
Eduardo Henrique
Dias
ac,
Florymar
Escalona-Durán
ad,
Gelson Tiago dos Santos
Tavares da Silva
 e,
Wajdi
Alnoush
b,
Jessica Ariane
de Oliveira
a,
Drew
Higgins
b and
Caue
Ribeiro
 *a
*a
aNanotechnology National Laboratory for Agriculture (LNNA), Embrapa Instrumentation, São Carlos, São Paulo, Brazil. E-mail: caue.ribeiro@embrapa.br
bDepartment of Chemical Engineering, McMaster University, Hamilton, Ontario L8S 4L7, Canada
cInstitute of Chemistry (IQSC), University of São Paulo, São Carlos, São Paulo, Brazil
dDepartment of Fuel and Hydrogen Cells (CECCO), Nuclear and Energy Research Institute (IPEN), São Paulo, São Paulo, Brazil
eInterdisciplinary Laboratory of Electrochemistry and Ceramics, Department of Chemistry, Federal University of São Carlos, São Carlos, São Paulo, Brazil
First published on 16th April 2024
Abstract
Here, we explore monoclinic BiVO4 as a cathode in a photoelectrochemical (PEC) system for CO2 reduction (CO2R). The catalyst was prepared using a simple oxidant peroxide method with crystallization under hydrothermal conditions, and subsequently sprayed on the FTO substrate. CO2R was carried out in an inflow and sealed electrochemical system for 6 h. The best performance was found to be under photoelectrocatalysis powered by a light-emitting diode (LED) as an illumination source when compared to photocatalysis (using different halogen UV and LED illumination), electrocatalysis, and photoelectrocatalysis powered by a halogen UV illumination source, with total production values of 22 and 5.5 μmol cm−2 for methanol and acetic acid, respectively. This achievement occurs because, even though BiVO4 as a photocatalyst does not have sufficient potential to drive CO2R, an external potential can be applied to drive the reaction. Moreover, the photogenerated electron–hole pairs are guided by the external potential, improving the charge separation and promoting the rapid electron transfer to reduce CO2 on the photoelectrocathode at a lower overpotential when compared to electrocatalysis. LED illumination produced higher amounts of products than UV illumination because UV light affects the catalyst surface altering the number of catalytic sites available for the reaction and reducing their performance.
1. Introduction
The utilization of fossil fuels causes the generation of greenhouse gases, especially carbon dioxide (CO2), motivating the development of novel technologies to convert them into value-added chemicals.1 In this context, photoelectrochemical (PEC) conversion arises as a promising technology for carbon dioxide reduction (CO2R).2,3 Although photocatalysis by itself suffers from limited utilization efficiency of solar energy and low separation of photogenerated carriers, it can support electrocatalysis by decreasing the amount of electrode potential that must be applied to promote the reaction. Indeed, more negative potentials lead to the occurrence of competing electrochemical reactions, reducing the overall efficiency of the system.4 A typical PEC system for CO2R consists of a semiconductor photoelectrode as the main component, which is usually dual-functional; it facilitates both the absorption of light and the electrochemical CO2R. This technology leverages the abundant photon energy from sunlight, an infinite natural resource. It combines this energy with an applied electrochemical potential to serve as a driving force, effectively regulating the electronic flow within the system. This integrated approach eliminates the necessity for high temperatures and voltages, capitalizing on the strengths of both photon and electron technologies. By improving the efficiency of charge transfer and reducing unwanted side reactions, this technology enables active and selective reduction of CO2 to fuels and valuable chemicals, where selectivity is fine-tuned by controlling the primary reaction stages.4–6To this end, efficient catalysts are essential to improve the CO2R performance. The ideal catalyst should be cost-effective, having an optimum band gap and high efficiency in the range of visible light, allowing it to efficiently absorb visible light and generate electron–hole pairs.7 Bismuth vanadate (BiVO4) is a candidate that meets these requirements, specifically due to its band gap of 2.4 eV. Additionally, BiVO4 is thermodynamically stable in its monoclinic phase, presents good chemical stability, and is composed of relatively inexpensive elements.8 However, there is a lack of studies on pristine BiVO4 used as a cathode photoelectrocatalyst for CO2R.
Here, a monoclinic BiVO4 was synthesized by a simple oxidant peroxide method with crystallization under hydrothermal conditions. Electrodes were then prepared by spray coating BiVO4 on a fluorine-doped tin oxide-coated glass (FTO) substrate. The electrodes (BiVO4/FTO) were used as cathodes under either UV or LED irradiation in a photocatalytic approach, with results compared to electrocatalytic and photoelectrocatalytic setups. Photoelectrocatalysis using LED illumination as an excitation source was found to provide the best performance, exhibiting total production values of 22 and 5.5 μmol cm−2 for methanol and acetic acid, respectively. LED illumination produced higher amounts of methanol and acetic acid than the UV illumination as an excitation source although the UV illumination carries more energy per photon than the LED. It is worth noting that most studies on BiVO4 have focused on its use as a photoanode, with relatively fewer studies investigating its potential as a cathode material; exploring its potential as a cathode presents the advantage of forming a heterojunction on the catalyst surface, induced by the external negative potential applied. Thus, this study emphasizes the use of BiVO4 as a cathode photoelectrocatalyst for CO2R and led to important findings for future applications regarding advanced sustainable technologies for CO2 mitigation.
2. Experimental
2.1. Materials
The chemicals, bismuth(III) nitrate pentahydrate (BiNO3)3·5H2O, ammonium metavanadate (NH4VO3), sodium bicarbonate (NaHCO3), hydrogen peroxide (H2O2, 30% concentration), and anhydrous alcohol, were of analytical grade and were used as received from Sigma Aldrich. For the preparation of all solutions, type I ultrapure water (Millipore Milli-Q system, with a resistivity of 18.2 MΩ cm at 25 °C), was utilized. Nitrogen (N2) and carbon dioxide (CO2) gases, both with a purity of 99.99%, were purchased from White Martins Inc. (Brazil). For the proper electrode deposition, a 5 wt% alcohol-based dispersion (Nafion™ D521, Fuel Cell Store, USA) was used as a binding material. Fluorine-doped tin oxide coated glass (FTO – 2.2 mm) having a surface resistivity of approximately 7 Ω sq−1 was purchased from Sigma Aldrich.2.2. Synthesis and electrode preparation
The catalysts were synthesized by adding 0.345 g of Bi(NO3)3·5H2O, 0.08 g of NH4VO3, 100 mL of H2O, and 110 μl of H2O2 to the Teflon lining, which was inserted into the stainless steel vessel and stirred at room temperature (25 °C) for 30 min. The vessel was then sealed and heated hydrothermally at 160 °C for 720 min with a heating rate of 3 °C min−1, as reported in ref. 9. After the synthesis was complete, the yellow solid powder was washed and centrifuged with anhydrous alcohol three times and dried overnight at 50 °C. Prior to catalyst deposition, the FTO substrate was cleaned in the following sequence: first with type I ultrapure water and Extran® soap under sonication for 5 min, then with anhydrous alcohol under sonication for 5 min, followed by acetone under sonication for 5 min, and further cleaned with type I ultrapure water under sonication for 5 min to remove impurities. Finally, the cleaned substrate was dried using N2 flux. Electrodes were prepared based on our previous work10,11 by spray-coating the catalyst to form a thin film on the FTO substrate (dimensions 2.5 × 2 cm for an area of 5 cm2). For every deposition, a slurry of catalyst was created by blending 25 mg of the catalyst with 25 mL of isopropanol and 0.25 mL of Nafion™. This mixture was ground using a mortar and pestle for 20 min. Following this, the slurry was dispersed in an additional 100 mL of isopropanol and sonicated for 30 min. The resulting suspensions were then sprayed to achieve a loading of 3.0 ± 2 mg cm−2 on FTO that was placed on a heating plate set to 60 °C to expedite the evaporation of the solvent.2.3. Characterization
The crystal phase of the prepared BiVO4 powders was determined using X-ray diffraction (XRD, Shimadzu XRD-6000 diffractometer model) with a Cu Kα radiation source (λ = 1.5418 Å) operating at 30 kV and 30 mA. Data were collected at diffraction angles between 10° and 80° at a scan rate of 2° per minute. The identification of the phase was based on JCPDS cards, and the primary crystallite size was calculated using Scherrer eqn (1).12 | (1) |
2.4. Flow cell configuration
The CO2R experimental setup was designed using a custom-made filter-press PEC reactor with an inflow and a sealed system – the continuous-flow system was used to overcome mass transfer limitations caused by low solubility and slow diffusion of CO2 in water. This lab-scale setup includes jacketed glass tanks for anolyte and catholyte, each with a capacity of 100 mL, connected to a thermostatic bath. It also features peristaltic pumps for fluid recirculation through the photoelectric reactor. Depending on the desired illumination source, a 100 W halogen lamp for UV-Vis light (UV) or a 100 W light-emitting diode (LED) lamp for visible light can be used (more details on the light spectrum in Fig. S1, ESI†). The setup also consists of a two-chamber PEC flow cell, separated by a cation exchange membrane (Nafion 117), and Ag/AgCl 3.0 M KCl as a reference electrode. All fluid connections were positioned on the side plate of the reactor. Each experiment was conducted employing different types of excitations on the electrodes. Photon reactions were performed solely by employing UV or LED irradiation exclusively at the cathode (i.e., the anode was always in the dark). Electrochemical reactions were performed only by employing an applied potential. Photoelectron reactions were performed with light irradiation and applied potential simultaneously. It is important to mention that the experimental preparation process remained equivalent for all reactions, except for the different excitation sources mentioned above. The cathodic and anodic chambers contain 3.2 mL each, while the reservoirs held a reaction volume of 100 mL of 0.5 M NaHCO3 electrolyte with a pH of 8. Before the experiments, the catholyte was purged with a constant flow of N2 at a flow rate of 30 mL min−1 for 20 min, followed by saturation with CO2 at a flow rate of 30 mL min−1 for 30 min. Cyclic voltammetry was performed under the aforementioned conditions, applying a potential window from 0.1 to −1.5 V vs. Ag/AgCl at a sweep rate of 20 mV s−1 with LED illumination, as an irradiation source. Thus, a −1.0 V vs. Ag/AgCl was set as the potential to favor CO2R, avoiding the hydrogen evolution reaction (Fig. S2, ESI†). For electrochemically driven reactions, chronoamperometric measurements were taken at −1.0 V vs. Ag/AgCl, controlled using an Autolab potentiostat (Multi Autolab/M204). Photon-driven reactions were carried out using either a UV or LED light source, while photoelectrochemical reactions were measured both chronoamperometrically at −1.0 V vs. Ag/AgCl and a UV or LED source simultaneously. All experiments were performed with recirculation through the reservoir and the PEC reactor was maintained at a flow rate of 14 mL min−1.3. Results and discussion
The structure and morphology of the as-synthesized BiVO4 (Fig. 1) were imaged using electron microscopy. Fig. 1(A) represents the SEM micrographs which displayed nanometer and micrometer size particles in a range from 0.02 to 2 μm with sphere-like and worm-like shapes in large aggregates, possessing a low surface area of 1.5913 m2 g−1 (Fig. S3, ESI†). The particle size and shape are controllable by changing the H2O2 concentration used during synthesis as this affects the nucleation step and growth process, as previously studied by Lopes et al., 2016.9 This is important since the efficient charge separation in the PEC system achieves its effectiveness through the use of small particles – unlike photocatalysis – which leads to a reduced hole diffusion length and better interparticle and particle/substrate contacts. Fig. 1(B) shows a TEM image of the BiVO4 particles, revealing agglomerates formed from a large number of well-faceted particles with an interplanar distance of 4.1 Å in relation to the plane (112) to the monoclinic phase, as shown in Fig. 1(D). Furthermore, the high-resolution TEM image shows clear lattice spacing, indicating good crystallinity of the BiVO4 nanoparticles. Fig. 1(C) shows the TEM-EDX analysis that identifies the presence of uniformly distributed Bi, O, and V particles.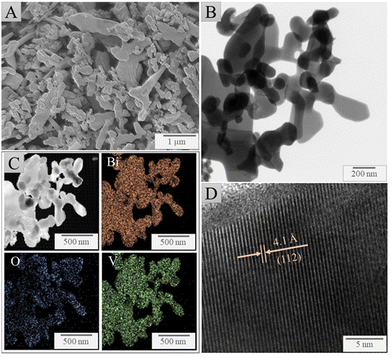 | ||
| Fig. 1 Electron micrographs of the as-synthesized BiVO4, (A) SEM image, (B) TEM image, (C) TEM-EDX, (D) HRTEM image. | ||
The electronic properties of the prepared BiVO4 sample are shown in Fig. 2. The band gap edge showed the typical absorption shape found for BiVO4 single particles.14 The band gap of the crystalline semiconductor was calculated from the Tauc equation (2) as follows:
| αhv = A(hv − Eg)1/n | (2) |
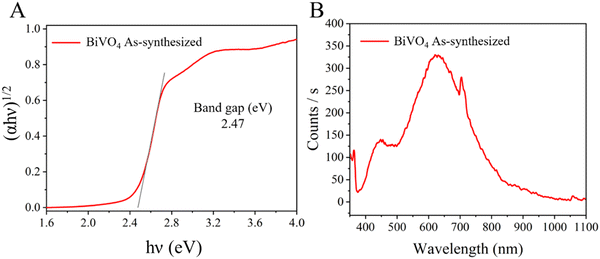 | ||
| Fig. 2 (A) Tauc plot (indirect band gap value) and (B) photoluminescence (PL) spectrum of the as-synthesized BiVO4. | ||
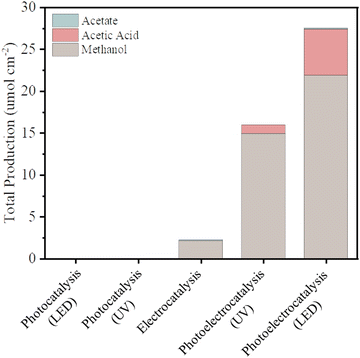
The current density versus applied potential curves for the electrocatalytic and PEC reactions (Fig. S2, ESI†) exhibited a noticeable difference in the current response, indicating better separation of the photogenerated charges by the PEC reaction system. The total production of liquid chemicals from CO2R of as-synthesized BiVO4 for all different excitation sources – that is, for photocatalysis (using different UV and LED illumination sources), electrocatalysis (using chronoamperometric measurements at −1.0 V vs. Ag/AgCl), and photoelectrocatalysis (using both photos, using UV or LED illumination, and chronoamperometric measurements at −1.0 V vs. Ag/AgCl as a source – were measured via1H-NMR, as shown in Fig. 3).
Photocatalysis on its own was not effective in promoting CO2R because although the photocatalyst (BiVO4) has a favorable band gap in the visible range (2.4 eV–516 nm), its electronic and surface structure is not conducive to driving the CO2R reaction; in particular, its conductive band is thermodynamically unfavorable to produce CO2˙− intermediates, and the inherent high density of surface recombination further hinders the CO2R.17 Regarding the production of liquid chemicals from CO2R by electrocatalysis, the liquid production exhibited low amounts of methanol (2.1 μmol cm−2), acetate (0.14 μmol cm−2), and other byproducts but in low amounts, which are below the confidence level. It is proposed that the product selectivity is associated with Bi–BiVO4 heterojunctions, which can be formed by Bi-metallic on the BiVO4 surface when a negative potential of −1.0 V vs. Ag/AgCl is applied.18–20 This hypothesis is based on the potential-pH equilibrium diagram for Bi, which shows that, in any cathodic region below Hydrogen evolution potential, metallic Bi is stably formed. On the other hand, in the same potential range, it is expected that V2O3 is still stable, as shown in Fig. 4.
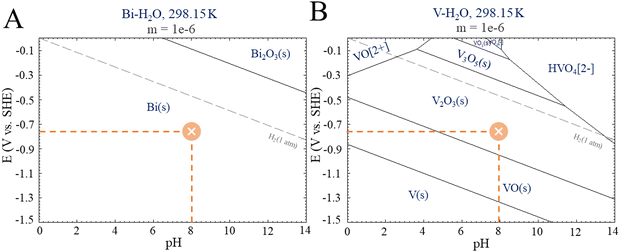 | ||
| Fig. 4 E-pH diagrams from Pourbaix for (A) Bismuth and (B) Vanadium. Adapted from the Centre for Research in Computational Thermochemistry (CRCT).22 | ||
Indeed, both the Bi–BiVO4 heterojunction and the external potential applied would contribute to addressing the recombination rate issue by the internal electric field and fine-tuning of redox potentials, respectively.21 The low production of liquid products can be justified by the energy barrier between the valence and conduction bands, which are characteristic of a semiconductor. This could be boosted by increasing the applied external potential; in a more negative direction in this instance. However, this approach can lead to the formation of undesired products, such as hydrogen.
Photoelectrocatalysis demonstrated superior performance compared to standalone photocatalysis and electrocatalysis since it combines aspects of both methods. In this context, instead of increasing the external potential in a more negative direction, which could lead to the issues mentioned, a light source was integrated into the system. This integration promotes the generation of electron–hole pairs on the catalyst; through light absorption, which in turn are guided by the external potential. This enhancement in charge separation efficiency facilitates rapid electron transfer, resulting in a more efficient reduction of CO2 keeping the same potential used in the electrocatalysis method.4,19 Comparing the two illumination sources in photoelectrocatalysis, the results under LED illumination were better than the results powered by UV illumination – exhibiting total production of methanol (22 μmol cm−2), acetic acid (5.5 μmol cm−2), and other byproducts such as acetate (0.13 μmol cm−2) but in low amounts, which are below the confidence level (for reference, see Fig. S4, ESI†). This result is noteworthy since UV irradiation carries more energy per photon than LED irradiation, allowing it to deliver a greater amount of energy to the catalyst and, hence, an increase in its electronic excitation.23 On the other hand, UV light can affect the catalyst surface due to photo-induced reactions, with emphasis on the surface properties including defects, roughness, and oxygen vacancies. These features contribute to the number of catalytic sites available for the reaction to occur, as well as the reactivity of the surface. In the specific case of BiVO4, UV light exposure has been shown to decrease the surface roughness and increase the smoothness of the surface, which can also have a negative effect on the catalytic potential of the catalyst when used alongside a reaction. When the surface becomes smoother, the number of catalytic sites available for the reaction decreases, which can lead to a reduction in catalytic activity.24
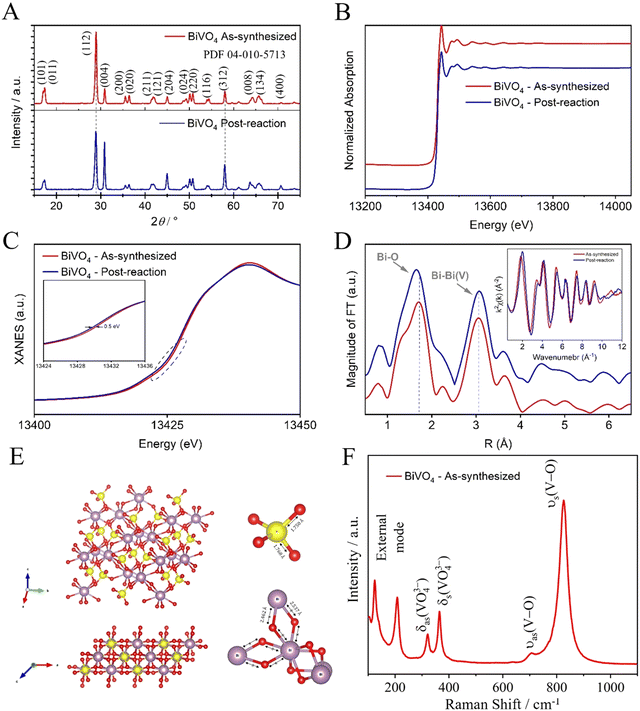
To understand the catalyst stability, a structural analysis was performed on both the as-synthesized catalyst and the post-reaction (post-CO2R) using a photoelectrocatalyst under LED illumination as an excitation source. The crystalline phase and composition of the as-synthesized BiVO4 were investigated by XRD patterns, as shown in Fig. 5(A). The diffraction peaks showed a crystalline phase with an estimated average crystallite size of 19.23 and 17.27 nm for as-synthesized BiVO4 and post-reaction, respectively. These average crystallite sizes were determined using the Scherrer eqn (1), indexed to the single-phase monoclinic form of BiVO4, which belongs to the space group I2/a with a lattice constant of a = 5.196 Å, b = 11.704 Å, and c = 5.094 Å according to the joint committee on powder diffraction standards (JCPDS) card no. 04-010-5713. No diffraction peaks from other phases or impurities are observed, indicating high purity and hence a successful synthesis. The position of diffraction peaks of as-synthesized BiVO4 and post-reaction were substantially the same, except for the relative intensity post-reaction peak (112) which decreased, thus indicating that the reaction occurred preferably in that crystalline plane, leading to the dissolution and recrystallization. Possibly, this reduction is related to the formation of Bi-metallic sites on the surface of BiVO4 (Bi–BiVO4).25 XAS of the as-synthesized BiVO4 and the post-reaction (post-CO2R) by photoelectrocatalyst under LED illumination as an excitation source were collected at the Bi-L3 edge. As shown in Fig. 5(B), there are no apparent differences in the spectra suggesting the stability of Bi species in the catalyst by not undergoing chemical transformation. Fig. 5(C) of further analysis of the X-Ray Near Edge Spectra (XANES) reveals a slight left shift (∼0.5 eV) in the spectra for the sample post-reaction, likely caused by a local electronic structure effect. Fourier-Transformed Extended X-ray Absorption Fine Structure (FT-EXAFS) shows two main peaks at ∼1.7 and 3.0 that are attributed to Bi–O in the first shell and the nearest neighbour Bi–Bi, respectively, as illustrated in Fig. 5(D). A combined effect of localized shortening in the Bi–O bonds and structural expansion of nearest Bi–Bi from bridged BiO8 (dodecahedral) is observed in the structure post-reaction. Raman spectroscopy was performed to investigate the short-range order and complement the XRD characterization of the as-synthesized BiVO4, as shown in Fig. 5(F). The Raman bands at around 827, 706, 366, 320, 206, and 124 cm−1 are characteristic of the monoclinic BiVO4 phase.26 The most intense Raman band near 827 cm−1 is assigned to the symmetric V–O stretching mode in the crystal structure for the tetrahedral VO4 groups.27 The more intense this band, the greater the degree of disorder for average vanadate species. The weak band at 706 cm−1 is assigned to the anti-symmetric V–O stretch. The bands near 366 and 320 cm−1 are assigned to the symmetric and anti-symmetric deformation modes of the VO43− tetrahedral group and the V–O bond, respectively. Finally, the bands near 206 and 124 cm−1 are assigned to the external modes (i.e., rotation/translation).26,28
It is worth mentioning that some studies have shown a reduction of BiVO4 to bismuthene29 and its use as an efficient CO2R.30,31 Although our experimental conditions could lead to bismuthene formation, the characterization employed did not reveal that transformation. In this sense, despite the bismuthene role should be considered, it is not the only path for CO2R using BiVO4 as a photoelectrocatalyst. On the other hand, the Bi-metallic formation seems to be essential for CO2R, as elucidated by the Pourbaix diagrams for Bi.
BiVO4 has demonstrated promising potential as a photoelectrocatalyst as a cathode for CO2 reduction, meeting several criteria such as the ability to efficiently absorb a wide range of solar spectra, conductive band energy close to driving the CO2R – which was suppressed by the external potential – least carrier losses at the interface, and chemical stability. BiVO4 is also a favorable candidate for CO2R because its synthetic route led to an easy and cost-effective process of scalability, while the required elements are abundant on Earth. Some strategies can be considered in order to increase BiVO4 performance for CO2R such as its growing as nano-sized particles in the monoclinic phase on the FTO substrate; once there is a resistive force created between the catalyst and the FTO substrate in the PEC system, which reduces the efficiency of the reaction.19 Growth orientation,16,32 dopants and/or co-catalysts,5,33 and heterostructures34 also can be effective in increasing liquid chemical production.
4. Conclusions
In summary, this study reveals the potential use of BiVO4 as a cathode for photoelectrochemical CO2R. Assorted reactions were performed by altering the excitation source, by photocatalysis (under different UV and LED illumination), electrocatalysis, and photoelectrocatalysis (using both electrons and photons under UV or LED illumination) sources. Best performances were found to be under photoelectrocatalysis powered by an LED illumination as an excitation source when compared to photocatalysis, electrocatalysis, and photoelectrocatalysis powered by halogen (UV) excitation methods. Photoelectrocatalysis powered by an LED illumination exhibited a total production value of 22 and 5.5 μmol cm−2 for methanol and acetic acid, respectively. This is due to the rapid transfer of multiple electrons and protons and the carrier separation possibly promoted by the formation of Bi-metallic sites on the surface of BiVO4 (Bi–BiVO4) and by the externally applied potential, avoiding surface recombination and physical separation. Although BiVO4 as a photocatalyst does not have enough redox potential to drive the CO2R, the redox potential was adjusted by applying an external potential (at a lower overpotential when compared to electrocatalysis; reducing energy consumption). LED illumination produces higher amounts of products than UV illumination because UV light can interfere with the catalyst surface, affecting the number of catalytic sites available for the reaction. XRD patterns showed the successful synthesis of BiVO4 and the possible formation of Bi-metallic sites on the surface of BiVO4 during CO2R – formed when a negative potential of −1.0 V vs. Ag/AgCl is applied, based on E-pH diagrams from Pourbaix. X-ray Absorption Spectroscopy (XAS) spectra of BiVO4 as-synthesized and post-CO2R by photoelectrocatalyst under LED illumination excitation showed no apparent differences, suggesting the stability of the Bi species in the bulk catalyst, although on the surfaces these transformations can take place as previously discussed. Thus, this study serves to point out the use of BiVO4 as a cathode for photoelectrochemical CO2R as well as a critical stepping stone for further studies to improve its performance for energy conversion and assist in advancing sustainable technologies for CO2 mitigation. Further investigations are required to explore the intricacies of catalyst surfaces.Conflicts of interest
There are no conflicts to declare.Acknowledgements
The authors thank Prof. Dr Fernanda de Lourdes Souza and Luis Aparecido de Godoy for their contribution to the discussions of this paper and for their support in the design and construction of the photoelectrochemical reactor, respectively. We thank the Structural Characterization Laboratory (LCE) at the Federal University of São Carlos (UFSCar) for the electron microscopy analyses, the McMaster Analytical X-Ray Diffraction Facility (MAX) for the X-ray diffraction measurements, and the Canadian Light Source (CLS) and the Hard X-ray Microanalysis (HXMA) beamline, where X-ray absorption spectroscopy analysis was carried out. The authors gratefully acknowledge the financial support given by FAPESP (2020/09628-6, 2021/13065-0, 2018/01258-5, 2019/10689-2, 2022/10255-5, 2019/21496-0, 2022/05149-1 2019/21496-0, and 2022/05149-1) and CAPES (Finance Code 001).References
- H. Dang, B. Guan, J. Chen, Z. Ma, Y. Chen, J. Zhang, Z. Guo, L. Chen, J. Hu, C. Yi, S. Yao and Z. Huang, Energy Fuels, 2024, 38(6), 4836–4880 CrossRef CAS.
- P. Chen, Y. Zhang, Y. Zhou and F. Dong, Nano Mater. Sci., 2021, 3, 344–367 CrossRef CAS.
- M. Bellardita, V. Loddo, F. Parrino and L. Palmisano, ChemPhotoChem, 2021, 5, 767–791 CrossRef CAS.
- P. Chen, Y. Zhang, Y. Zhou and F. Dong, Nano Mater. Sci., 2021, 3, 344–367 CrossRef CAS.
- L. X. Liu, J. Fu, L. P. Jiang, J. R. Zhang, W. Zhu and Y. Lin, ACS Appl. Mater. Interfaces, 2019, 11, 26024–26031 CrossRef CAS PubMed.
- J. de Almeida, S. H. Câmara, R. Bertazzoli, K. Rajeshwar, R. A. G. da Silva and C. de Arruda Rodrigues, Chem. Eng. J., 2023, 477, 147117 CrossRef CAS.
- J. Quiñonero, T. Lana-Villarreal and R. Gómez, Appl. Catal., B, 2016, 194, 141–149 CrossRef.
- S. S. M. Bhat and H. W. Jang, ChemSusChem, 2017, 10, 3001–3018 CrossRef CAS PubMed.
- O. F. Lopes, K. T. G. Carvalho, A. E. Nogueira, W. Avansi and C. Ribeiro, Appl. Catal., B, 2016, 188, 87–97 CrossRef CAS.
- R. M. de Silva, F. de Lourdes Souza, E. Dias, G. T. dos, S. T. da Silva, F. E. Durán, A. Rego, D. Higgins and C. Ribeiro, J. Alloys Compd., 2023, 968, 172090 CrossRef.
- J. A. Oliveira, R. R. M. Silva, G. T. S. T. da Silva, J. A. Torres, A. Vali, C. Ribeiro, K. Rajeshwar and L. A. M. Ruotolo, Mater. Res. Bull., 2022, 149, 111716 CrossRef CAS.
- B. D. Cullity and J. W. Weymouth, Am. J. Phys., 1957, 25, 394–395 CrossRef.
- D. L. Wood and J. Tauc, Phys. Rev. B: Solid State, 1972, 5, 3144–3151 CrossRef.
- O. F. Lopes, K. T. G. Carvalho, W. Avansi, D. M. B. Milori and C. Ribeiro, RSC Adv., 2018, 8, 10889–10897 RSC.
- H. L. Tan, R. Amal and Y. H. Ng, J. Mater. Chem. A, 2017, 5, 16498–16521 RSC.
- X. Zhu, F. Zhang, M. Wang, X. Gao, Y. Luo, J. Xue, Y. Zhang, J. Ding, S. Sun, J. Bao and C. Gao, Appl. Catal., A, 2016, 521, 42–49 CrossRef CAS.
- N. Zhang, R. Long, C. Gao and Y. Xiong, Sci. China Mater., 2018, 61, 771–805 CrossRef CAS.
- D. Kang, Y. Park, J. C. Hill and K. S. Choi, J. Phys. Chem. Lett., 2014, 5, 2994–2999 CrossRef CAS PubMed.
- F. Li, W. Zhao and D. Y. C. Leung, Appl. Catal., B, 2019, 258, 117954 CrossRef CAS.
- Y. Hermans, S. Murcia-López, A. Klein and W. Jaegermann, ACS Energy Lett., 2019, 4, 2522–2528 CrossRef CAS.
- J. F. de Brito, P. G. Corradini, M. V. B. Zanoni, F. Marken and L. H. Mascaro, J. Alloys Compd., 2021, 851, 156912 CrossRef.
- C. W. Bale and Eve Bélisle, one-metal Eh vs. pH Pourbaix diagram.
- J. Ma, C. Wang and H. He, Appl. Catal., B, 2016, 184, 28–34 CrossRef CAS.
- T. Li, J. He, B. Peña and C. P. Berlinguette, Angew. Chem., 2016, 128, 1801–1804 CrossRef.
- H. Song, J. Sun, T. Shen, L. Deng and X. Wang, Catalysts, 2021, 11(4), 489 CrossRef CAS.
- M. R. da, S. Pelissari, N. F. Azevedo Neto, L. P. Camargo and L. H. Dall’Antonia, Electrocatalysis, 2021, 12, 211–224 CrossRef.
- A. Galembeck and O. L. Alves, J. Mater. Sci., 2002, 37, 1923–1927 CrossRef CAS.
- S. Nikam and S. Joshi, RSC Adv., 2016, 6, 107463 RSC.
- W. Ma, J. Bu, Z. Liu, C. Yan, Y. Yao, N. Chang, H. Zhang, T. Wang and J. Zhang, Adv. Funct. Mater., 2021, 31(4), 2006704 CrossRef CAS.
- F. Yang, A. O. Elnabawy, R. Schimmenti, P. Song, J. Wang, Z. Peng, S. Yao, R. Deng, S. Song, Y. Lin, M. Mavrikakis and W. Xu, Nat. Commun., 2020, 11, 1088 CrossRef CAS PubMed.
- C. Cao, D. D. Ma, J. F. Gu, X. Xie, G. Zeng, X. Li, S. G. Han, Q. L. Zhu, X. T. Wu and Q. Xu, Angew. Chem., Int. Ed., 2020, 59, 15014–15020 CrossRef CAS PubMed.
- G. Xi and J. Ye, Chem. Commun., 2010, 46, 1893–1895 RSC.
- R. Yalavarthi, R. Zbořil, P. Schmuki, A. Naldoni and Š. Kment, J. Power Sources, 2021, 483, 229080 CrossRef CAS.
- N. Khan, F. Stelo, G. H. C. Santos, L. M. Rossi, R. V. Gonçalves and H. Wender, Appl. Surf. Sci., 2022, 11, 100289 CrossRef.
Footnote |
| † Electronic supplementary information (ESI) available. See DOI: https://doi.org/10.1039/d4ma00232f |
| This journal is © The Royal Society of Chemistry 2024 |

