
A new milestone for ultra-low 236U/238U isotope ratio measurements by ICP-MS/MS†
Hugo
Jaegler
 *a and
Alkiviadis
Gourgiotis
b
*a and
Alkiviadis
Gourgiotis
b
aInstitut de Radioprotection et de Sûreté Nucléaire (IRSN), PSE-ENV/SAME/LERCA, F-78110, Le Vésinet, France. E-mail: hugo.jaegler@irsn.fr
bInstitut de Radioprotection et de Sûreté Nucléaire (IRSN), PSE-ENV/SEDRE/LELI, F-92260, Fontenay-aux-Roses, France
First published on 11th August 2023
Abstract
Uranium isotope composition in environmental samples allows to trace its origin. Therefore, the analytical community has been working for several years to reduce the detection limit of the 236U/238U isotopic ratio using mass spectrometry, and in particular the ICP-MS/MS technology. The latest generation of ICP-MS/MS, recently commercialized, has improved performance, including better ion transmissions and an extended dynamic range of mass detection. These improvements, the coupling with an efficient desolvating module and the addition of oxygen in the collision/reaction cell permitted to remove the interferences of 236U+ ion measurements (abundance sensitivity of the major isotopes and polyatomic interferences, notably 235UH+ ions). For the first time a precise determination of the 236U/238U isotopic ratio up to 10−11 was demonstrated, validated by the analysis of certified reference materials and environmental samples previously measured by AMS. This new limit is a new milestone in the determination of ultra-low 236U/238U isotope ratios and opens the way to various geochemical applications.
Introduction
Uranium isotope measurements are of increasing interest for environmental sciences, nuclear safeguards and nuclear forensics.1,2 Due to the small natural variations and to an important anthropogenic U dilution by the natural U in the environment, the use of 235U/238U isotope ratios is sometimes irrelevant. Recently, several studies have focused on the minor isotopes of uranium in the environment.3–5 In fact, a minor isotope like 236U is of prime interest for the determination of the origin of uranium thanks to the variability of its isotope ratios depending on their origin.6The 236U concentration in the environment (not contaminated by nuclear activities) is a few tens of fg per g![[thin space (1/6-em)]](https://www.rsc.org/images/entities/char_2009.gif) 7 and their 236U/238U isotope ratios are typically about 10−14–10−13.6 In U ore, high uranium concentration and neutron flux increase the 236U formation rate and the isotope ratio varies between 10−12 and 10−10. Anthropogenic 236U, formed in enriched uranium, was spread in the environment. Global fallout from nuclear weapon tests released uranium thus leading to characteristic 236U/238U isotope ratios of 10−9–10−6 and >10−6 for sediment and soils impacted by nuclear accidents or releases from nuclear reprocessing plants.
7 and their 236U/238U isotope ratios are typically about 10−14–10−13.6 In U ore, high uranium concentration and neutron flux increase the 236U formation rate and the isotope ratio varies between 10−12 and 10−10. Anthropogenic 236U, formed in enriched uranium, was spread in the environment. Global fallout from nuclear weapon tests released uranium thus leading to characteristic 236U/238U isotope ratios of 10−9–10−6 and >10−6 for sediment and soils impacted by nuclear accidents or releases from nuclear reprocessing plants.
However, the detection of 236U in environmental samples is quite challenging due to its low abundance and requires therefore instruments with high sensitivity and high resolution. The most efficient technique is the Accelerator Mass Spectrometry (AMS), in which ions are accelerated before the separation of isotopes. Its high resolution allows the detection of very low concentrations of 236U ions and therefore very low 236U/238U isotope ratios of about 10−14.8 The second most efficient method is the Thermal Ionisation Mass Spectrometry (TIMS), with a detection limit of about 10−10.6,9 Inductively Coupled Plasma Mass Spectrometry (ICP-MS) techniques were until recently less performant for the determination of 236U/238U isotope ratios.10–15 Some spectral interferences limit the determination of very low isotope ratios, which are mainly the uranium hydride species (235U1H+), and the abundance sensitivity of most abundant isotopes 235U and 238U. Recent works have focused on the determination of very low isotope ratios by ICP-MS/MS7,16–18 by improving the hydride formation, the peak tailing etc. In a recent work, the lowest isotope ratios measured using the ICP-MS/MS technology in UO+ mode was about 1 × 10⁻¹⁰.
The present study was motivated by the possibility to experiment with the new model of ICP-MS/MS, the Agilent 8900. The objective of this work is to determine the performances of this new generation of ICP-MS/MS in terms of hydride formation rate and the lowest 236U/238U isotope ratio achievable in UO2+ mode. To this end, measurements of certified references materials and environmental samples were performed.
Experimental
Reagents
High purity nitric acid (VWR Chemicals, Normapur 68%), hydrochloric acid (Merck, Emsure 37%), hydrofluoric acid (MERCK, Normapur) and perchloric acid (Prolabo, Suprapur) were used in this work (sample digestion, uranium separation from sample matrix, etc.). Acid dilutions were performed with deionized water (18.2 MΩ cm Milli Q system, Millipore). Sample solutions, instrumental blanks and washing procedures were performed with 2% HNO3. Moreover, for an efficient instrument washing, 0.05 mol L−1 (M) HEDPA and a solution with HF/HNO3/HCl were used to decrease the uranium background before sample measurements.Care was taken to avoid the cross-contamination of samples. In addition to high purity reagents, samples were prepared in laminar flow cabinet (ISO 3–ISO 4) to minimise laboratory background. Procedural blanks (n = 12) were prepared in the same conditions as samples and analysed by AMS. No contamination was highlighted. Moreover, blank solutions (n = 32) were regularly measured between samples to ensure the non-contamination of the instrument (see Calculation procedures section below).
Standards and samples for method validation
As previously,7 several samples characterised by decreasing 236U/238U isotope ratios were measured for method validation. First, a standard from the Joint Research Centre (Geel, Belgium) IRMM-075/6 was analysed. The uranium concentration in the measured solution was 5 μg g−1, and its certified 236U/238U isotope ratio is (1.09 ± 0.01) × 10−9. The second standard is an in-house AMS standard of uranyl nitrate processed before 1918, called KkU, provided by the University of Physics in Vienna.19 Its isotopic ratio is well-known (6.98 ± 0.32) × 10−11. Finally, two environmental samples, called MBN and MTG, were analysed. These samples are uranium ores found in the vicinity of former uranium mines in France. They were previously characterised by AMS at VERA Laboratory (Vienna, Austria) and the 236U/238U isotope ratios were respectively (1.04 ± 0.18) × 10−10 for MBN and (1.13 ± 0.17) × 10−11 for MTG. Uranium concentrations in these samples were approximately 100 μg g−1 for MBN and 1300 μg g−1 for MTG. Finally, mass fractionation was corrected using a certified standard from the Joint Research Centre (Geel, Belgium) IRMM-184. The uranium concentrations in the measured solutions were respectively about 0.04 μg g−1, 5 μg g−1, 15 μg g−1, 14 μg g−1 and 12 μg g−1 for IRMM-184, IRMM-075/6, KkU, MBN and MTG respectively.Sample preparation
Environmental samples were collected in wetlands downstream from former U-mines in France. All samples contain high U concentrations (∼3000–4000 μg g−1) and were prepared using the method described in a previous publication.7 In brief, about 100 mg of samples were dissolved in Savillex® PFA Teflon® vials using concentrated HNO3 and concentrated HF. Samples were heated to 90 °C overnight with closed lids before adding concentrated HClO4. Samples were heated to 90 °C with open lids for 3 h to evaporate the nitric and hydrofluoric acids. Temperature was increased to 160 °C to evaporate the perchloric acid. Samples were then purified with UTEVA resin (100–150 μm). Samples were loaded on the column in 3 M HNO3 media and matrix elements were discarded using 6 mL 3 M HNO3. Th was then eluted using 6 mL 3 M HCl, and finally U was eluted using 6 mL 0.1 M HCl. U fractions were evaporated to dryness and recovered with 0.05 M HNO3 for ICP-MS measurement.Instrumentation
To achieve a very low hydride formation rate, a desolvating instrument was used before the introduction of the sample in the ICP-MS. In this work, we used APEX Ω from Elemental Scientific (Nebraska, USA). It allows us to decrease the hydride formation rate in the plasma and to increase the uranium sensitivity. Desolvating instrument gas (nebuliser gas, N2 gas and Ar gas) and ICP-MS parameters were daily optimized using a 1 ng g−1 uranium solution (Table 1). Argon and nitrogen gas quality is “premier”. Nitrous oxide (N2O) or dioxygen (O2) were used in the CRC. Gas qualities were “technique” for N2O and “ultrapure” for O2. All gases are from AirProducts (Aubervilliers, France).| Parameter | Value |
|---|---|
| Desolvating system | APEX Ω |
| Apex Ω spray chamber temperature | 140 °C |
| Apex Ω Peltier cooler temperature | 3 °C |
| Apex Ω desolvator temperature | 155 °C |
| Nebulizer | PFA micro-concentric (ESI) |
| Nebulizer gas | 100 μL min−1 |
| N2 gas (desolvating system) | 2.37 L min−1 |
| Ar gas (desolvating system) | 3.35 L min−1 |
| Torch | One-piece (quartz) |
| Sample gas | 0.88 L min−1 |
| Sample uptake | ∼300 μL min−1 |
| RF power | 1500 W |
| Sampling depth | 6 mm |
| Cell gas (O2) flow rate | 0.435 mL min−1 |
| Extract 1 and 2 | −11.2, −186 V |
| Deflect | 10.6 V |
| Q1 and Q2 mass gain | 132, 136 |
| Q1 and Q2 mass offset | 126, 124 |
| Q1 and Q2 axis offset | −0.15, −0.08 |
| Octopole bias | −1.0 V |
| Energy discrimination | −10.0 V |
| Peak shape | 1 point |
| Integration time of 234,235,236U16O2+, 238U1H16O2+ | 1, 0.1, 8, 2 s |
| Number of sweeps per replicate | 100 |
| Number of replicates per sample | 10 |
| Sensitivity on 238UO2+ | 4.3 × 10⁶ cps ppb−1 |
Calculation procedures
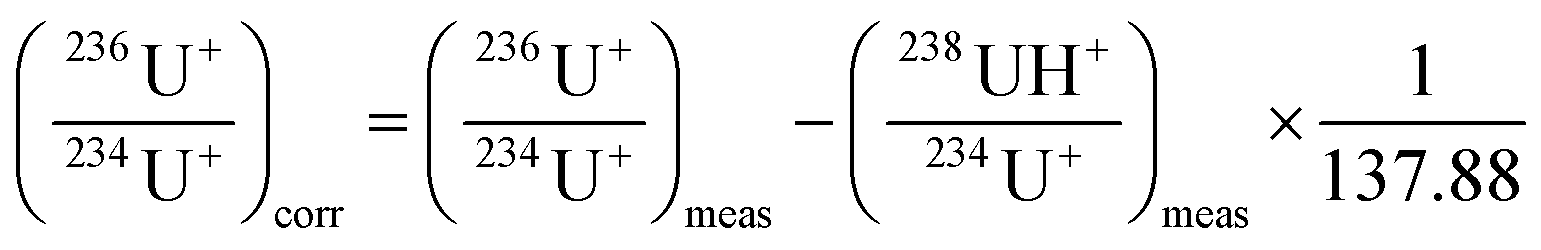
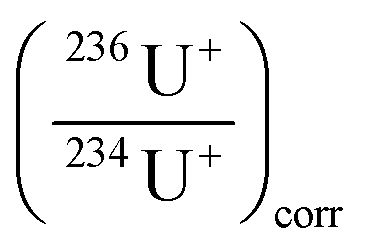
Precautions were taken regarding the 236U/238U isotope ratio calculation procedure. Indeed, 236U and 238U signals cannot be directly used for the determination of ratios because they are not measured using the same detection mode (pulse counting or analogue). To ensure that isotopes are measured in pulse counting mode (and to avoid detector overrange due to an extremely high 238U ions flux), the 236U/238U isotope ratio was deduced from the 236U/234U isotope ratio, as explained in our previous work.7 All isotopes were measured in mass-shift mode, reacting with oxygen in the CRC. However, for an easy reading, all isotopes will be noted 23XU+, instead of 23XU16O2+ and isotope ratios will be expressed as 23XU+/23XU+ and 23XUH+/23XU+ instead of 23XU16O2+/23XU16O2+ and 23XU16O2H+/23XU16O2+.For the determination of 236U+/234U+, all signals (10 replicates for each isotope) were corrected for the blank signal. For the blank correction, several (n = 32) 0.05 M HNO3 samples were regularly measured during the analysis sequence. The 236U+ signals in these blank solutions were a mean of 0.7 ± 0.5 cps (k = 2). The same level of 236U signal was found in the procedural blanks, which demonstrates the non-contamination from the lab or the reagents.
Then, the isotope ratios were corrected for outliers and for hydride formation rate and mass fractionation. After the blank correction, the 236U+/234U+ and 238UH+/234U+ isotope ratios were simply calculated. Outliers were rejected with a 2-sigma test. Then, the 236U+/234U+ isotope ratios were corrected for the hydride formation interferences using eqn (1). More details can be found in ESI.†
 | (1) |
 correspond to the isotope ratio corrected for the hydride formation rate,
 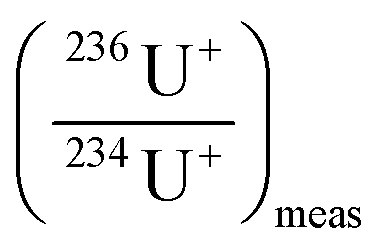 correspond to the measured isotope ratio, and
  is the hydride formation rate measured in the sample. Note that 137.88 is the natural 238U/235U isotope ratio value recommended by the IGC subcommision on geochronology. Mass fractionation was considered for 236U+/234U+ and 238UH+/234U+ isotope ratios using the 235U/238U ratio measured in the certified standard IRMM-184 in standard bracketing mode. Finally, 236U/238U isotope ratios were deduced using the corrected 236U/234U and the 234U/238U isotope ratios measured in diluted solutions of the samples.
All signal corrections were performed before the mass fractionation correction which was applied to each replicate of measurement. Uncertainties with an extended coverage factor of 2 were determined using eqn (2).
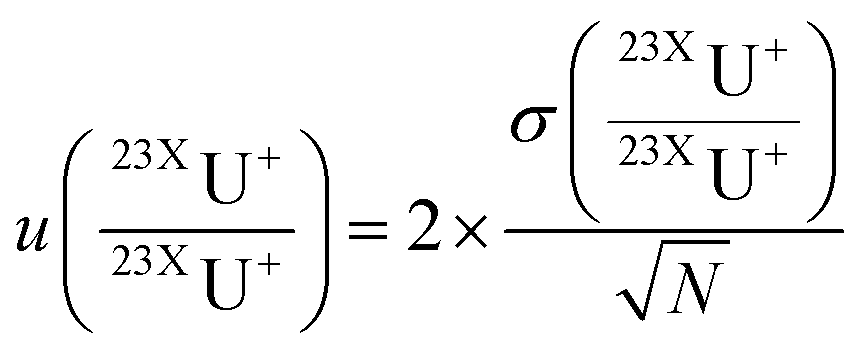 | (2) |
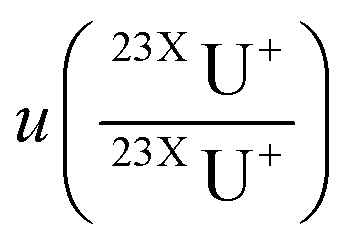 is the uncertainty of measured isotope ratio,
 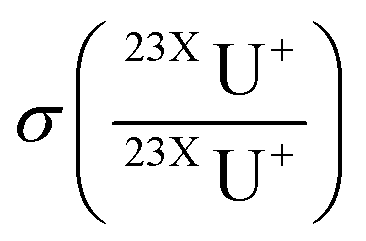 is the standard deviation of the replicates (N) of the measured isotope ratios. For the mass fraction correction and the following corrections, uncertainties are propagated during each step.
Means of the N replicates are also presented in the result section; uncertainties of these mean values are based on the propagation of the uncertainties of the N replicates.
The method validation was quantified by the determination of trueness and repeatability for each sample. The trueness (%) of certified values was determined using eqn (3).
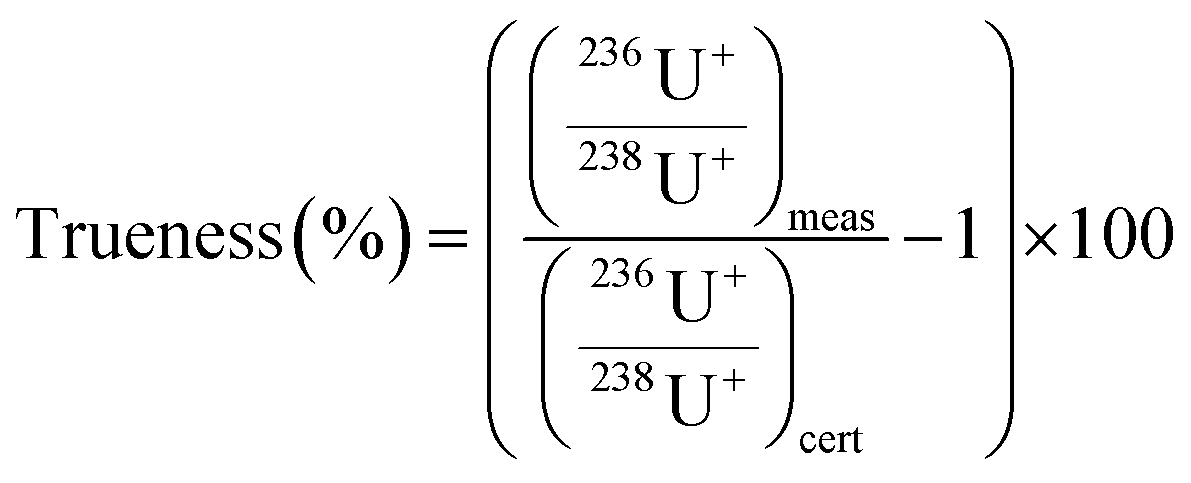 | (3) |
 is the measured isotope ratio and
  is the certified isotope ratio.
Repeatabilities (%) were determined with an extended coverage factor of 2, following eqn (4).
 | (4) |
 is the standard deviation of n repetitions of measurement and
  is the mean of these n repetitions.
Result and discussion
Uranium sensitivity with Agilent ICP-MS/MS
The new generation of Agilent ICP-MS/MS, the 8900, has new capabilities which greatly improve the performances of the ICP-MS/MS technology, compared with the first generation of Agilent 8800. The main differences are better interface cones, lenses and vacuum pump to enhance sensitivity. The major improvement is the widening of the dynamic range of mass filters, which allows now the measurement of isotopes up to a mass to charge ratio of 280. In our study this is a great improvement, as U ions could now be measured as UO2+ rather than UO+. As previously mentioned, all uranium isotopes were measured in mass shift mode: for example, for the 238U determination, Q1 is fixed at m/z = 238, uranium isotopes are oxidised in the CRC with reaction gas, then Q2 is fixed at m/z = 238 + 32 = 270.Sensitivities obtained with UO+ and UO2+ were compared (Fig. 1). O2 was injected in the CRC with an increasing flow rate. Sensitivities at m/z = 254 and 270 were observed. As in our previous study, a maximum of sensitivity is observed for a O2 flow rate of 0.04 mL min−1 (8%). However, the maximum sensitivity is now about 1 × 10⁶ cps ppb−1, which is an improvement by a factor of 2 compared with the 8800 ICP-MS/MS.7,20 Regarding the UO2+ signal, the maximum of sensitivity is found for 0.435 mL min−1 (29%) at a level of 3.5 × 10⁶ cps ppb−1. This improvement of the sensitivity using UO2+ is required to decrease the limit of detection of the 236U+ ions.
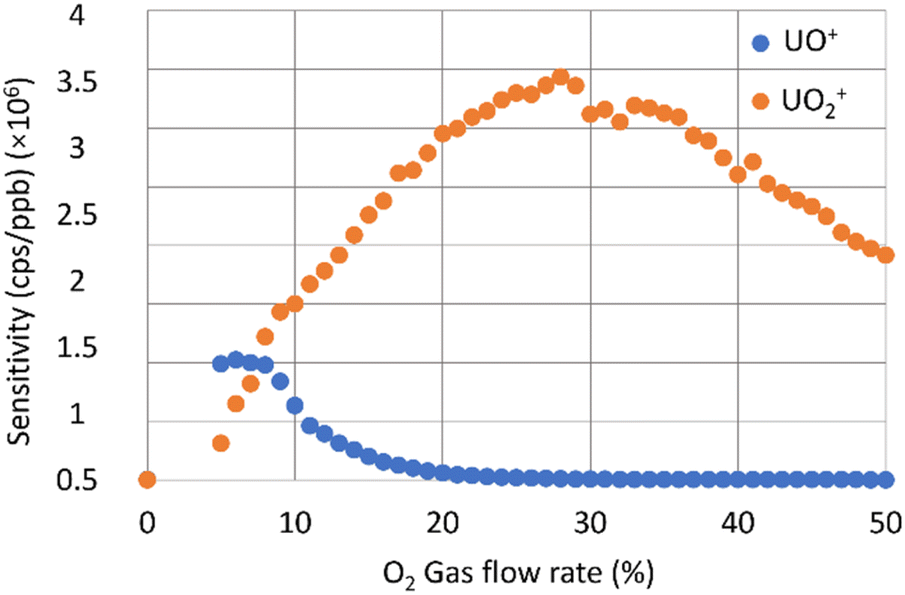 | ||
| Fig. 1 Uranium oxide sensitivities using oxygen in the CRC, measured as UO+ (blue) or UO2+ (orange). | ||
Reaction gas optimisation
In our previous work,7 efforts were made on the reduction of the hydride formation rate, which is the main interference during 236U measurements using an Agilent 8800 ICP-MS/MS. For this purpose, several reaction gases in CRC, desolvating module and molarity of the nitric acid of the measured solution were tested. The optimal combination consisted in the use of N2O in CRC, APEX Ω and 0.05 M HNO3 and allowed us to obtain a sensitivity of 5 × 10⁵ cps ppb−1 and a hydride formation rate of 6.40 × 10⁻⁹.In this work, we compared the performance of Agilent 8800 and Agilent 8900 in terms of sensitivity and hydride formation rate (Fig. 2). As previously mentioned, we observed an increase in sensitivity from 5 × 10⁵ cps ppb−1 with Agilent 8800 to a value of 4 × 10⁶ cps ppb−1 with Agilent 8900. This increase in sensitivity is mainly due to the improvement of the ion beam transport between the extraction lenses and the detector and to measuring uranium in the UO2+ form (a more abundant species than UO+).
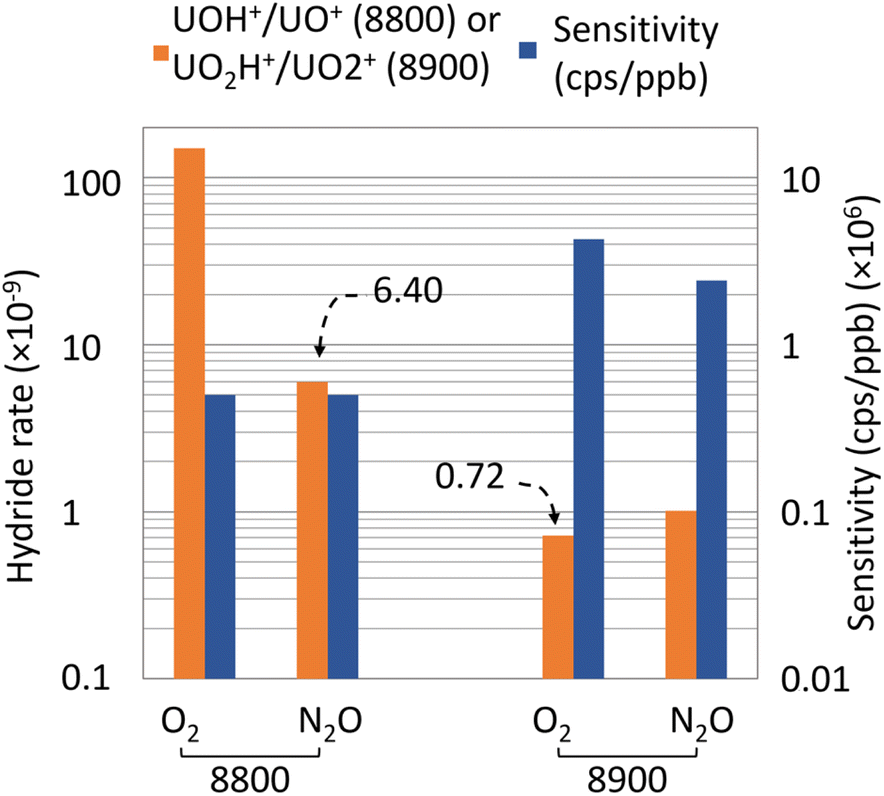 | ||
| Fig. 2 Comparison of the hydride formation rate and sensitivity with Agilent 8800 ICP-MS/MS (left) from Jaegler et al. (2020) and Agilent 8900 ICP-MS/MS (right) using O2 or N2O as a reaction gas in the CRC. | ||
Moreover, results show a decrease of the uranium hydride formation rate UH+/U+ to a value of 0.72 × 10⁻⁹ with the Agilent 8900 and O2 as a reaction gas, which is an order of magnitude below the value published in our previous work (6.40 × 10⁻⁹).7 This extremely low interference rate brings new limits of detection and the capacities to determine ultra-low 236U/238U isotope ratios. To this end, it is possible to quantify the theoretically lowest measurable 236U/238U isotope ratio, using eqn (5). Details on this equation can be found in ESI.†
 | (5) |
Nitrous oxide was also tested with the Agilent 8900 ICP-MS/MS. In our previous work, using N2O in the CRC allows us to greatly decrease the hydride formation rate. Surprisingly, in this work, our results show a decrease of the sensitivity from 4.3 × 10⁶ cps ppb−1 with O2 to 2.4 × 10⁶ cps ppb−1 using N2O, and also a decline of the hydride formation rate to 1.01 × 10⁻⁹. This result is consistent with recent published research using N2O in Agilent 8900 ICP-MS/MS.21 Authors put forward the bigger size of the N2O molecule and the loss of analyte by collision. Accordingly, we used O2 as a reaction gas and the APEX Ω desolvating module to quantify the 236U/238U isotope ratios in a certified reference solution and environmental samples.
Validation of the method with certified reference materials
The developed method was validated through the measurement of a certified reference solution, IRMM 075/6 (Fig. 3), and an in-house AMS standard of uranyl nitrate, KkU (Fig. 4).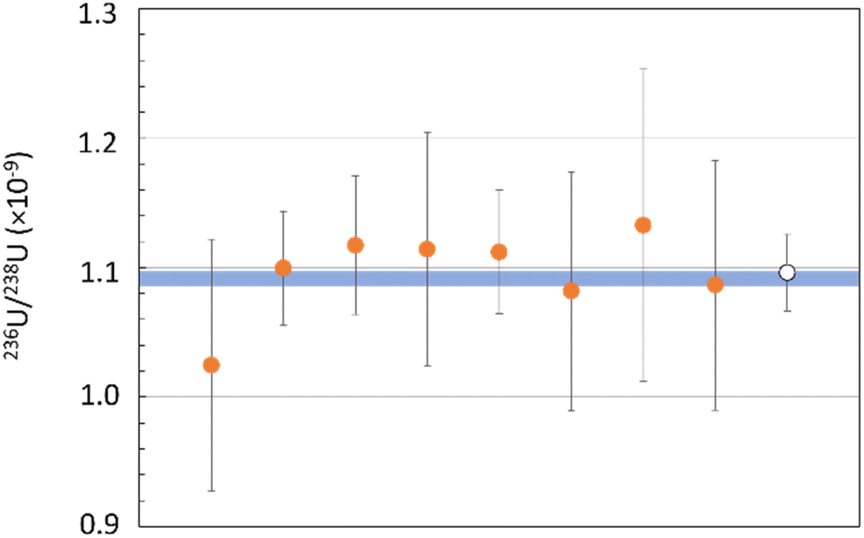 | ||
| Fig. 3 Measurement of 236U/238U isotope ratios in IRMM 075/6 certified reference material. The open dot corresponds to the mean of the measurements (red dots). The blue rectangle highlights the certified value uncertainties. Uncertainties are extended with a coverage factor of 2. | ||
 | ||
| Fig. 4 Measurement of 236U/238U isotope ratios in KkU reference material. The open dot corresponds to the mean of the measurements (red dots). The blue rectangle highlights the certified value uncertainties. Uncertainties are extended with a coverage factor of 2. | ||
The IRMM standard is certified for a236U/238U isotope ratio of 1.0885 (63) × 10−9. This is the lowest certified material commercially available for uranium ratios. The mean of 8 replicates shows a value of 1.098 (30) × 10−9 (k = 2) (Fig. 3). The relative uncertainty is 2.7%. It is worth mentioning that this value is lower by a factor of 2 compared with previous results on the same certified reference material (4.6%).7 The trueness equals 0.9%, and the repeatability is 5.9% (k = 2).
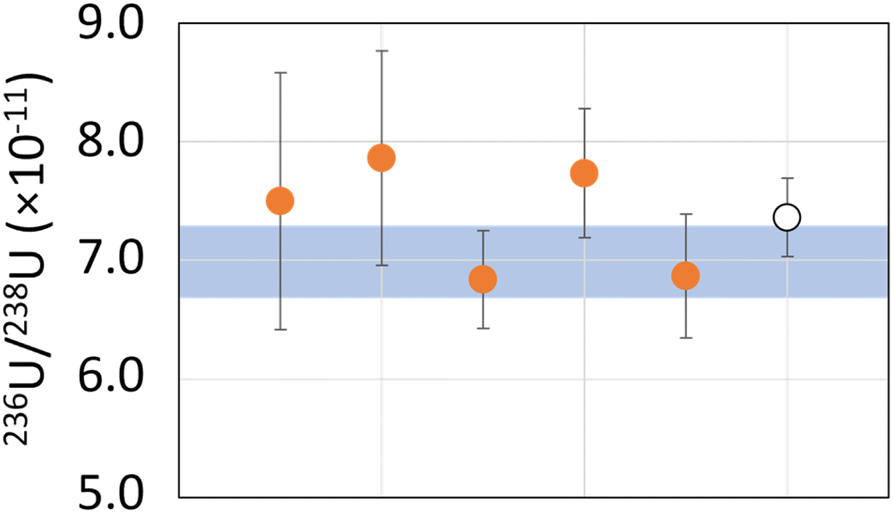
Regarding the AMS standard, KkU sample, with a usual reference value of 6.98 (32) × 10−11, results on 5 measurement repetitions show a value of 7.36 (33) × 10−11 (k = 2). The relative uncertainty is 4.5%, the trueness is 5.5% and the repeatability is 13% (k = 2).
These results on reference material IRMM 075/6 and KkU are in good agreement with the certified values, demonstrated by the trueness lower than 1% and 6% respectively. Relative uncertainties better than 5% and repeatabilities better than 15% (using a coverage factor of 2) validated the measurement method to uranium ratios down to 10−11. This is the first time that 236U/238U isotope ratios at this level were determined using an ICP-MS/MS. To confirm the capabilities of our method, environmental samples were also analysed.
Validation of the method with environmental samples
The environmental samples are two fraction of uranium ores, MBN and MTG, whose 236U/238U isotope ratios were previously determined by AMS. The ICP-MS/MS results were compared to the AMS results to validate the developed method.236U/238U isotope ratio measurements by AMS on MBN sample showed a value of 1.04 (18) × 10−10 (k = 2). The mean value of ICP-MS/MS measurements over 20 repetitions is 9.08 (18) × 10−11 (Fig. 5). The relative uncertainty equals 2.0% (k = 2), the trueness is −13%, whereas the repeatability is 19% (k = 2).
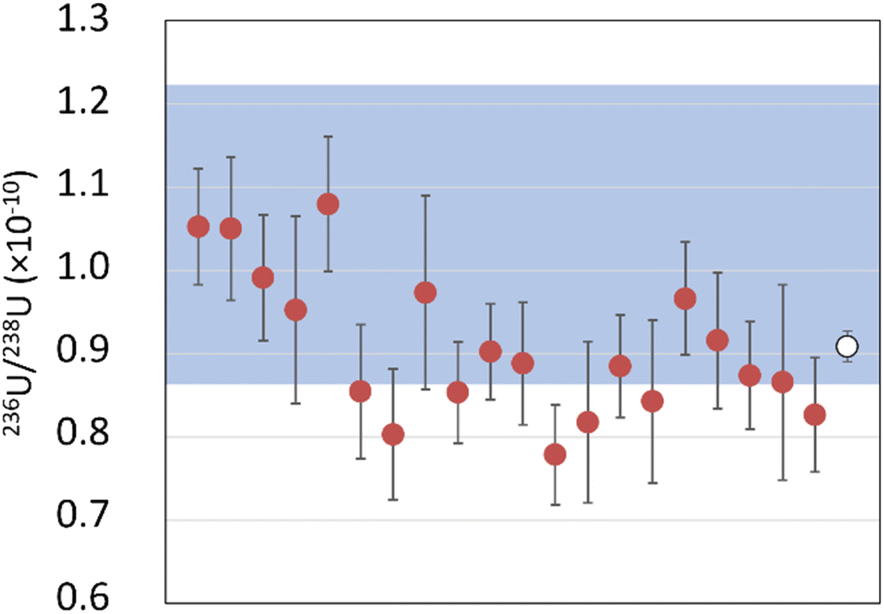 | ||
| Fig. 5 Measurements of 236U/238U isotope ratios in MBN sample. The open dot corresponds to the mean of the measurements (red dots). The blue rectangle highlights the certified value uncertainties. Uncertainties are extended with a coverage factor of 2. | ||
The uranium ratio in the MTG sample determined by AMS was 1.13 (17) × 10−11 (k = 2) (Fig. 6). ICP-MS/MS measurements over 4 repetitions show a mean value of 1.33 (23) × 10−11 (k = 2), a trueness of 18% and a repeatability of 40% (k = 2).
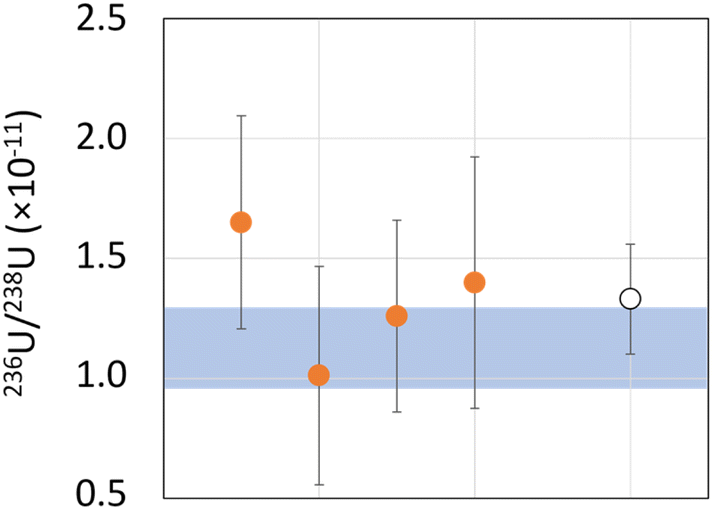 | ||
| Fig. 6 Measurements of 236U/238U isotope ratios in MTG sample. The open dot corresponds to the mean of the measurements (red dots). The blue rectangle highlights the certified value uncertainties. Uncertainties are extended with a coverage factor of 2. | ||
AMS and ICP-MS/MS measurements are in good agreement even for ultra-low 236U/238U isotope ratios at level 10−11 with trueness values below 20% for both samples. These results confirmed the capabilities of the developed method to reach a new milestone in the determination of ultra-low levels of 236U/238U isotope ratios in environmental samples.
Conclusions
The capabilities of a new generation of ICP-MS/MS were tested to reach a new limit of detection for the 236U/238U isotope ratio of 10−11. This is one order of magnitude lower than the previously published limit of detection of 10−10.7 Earlier on, this level was a clear boundary in the capabilities of the method, as interferences were too significant to reach an accurate determination of the 236U/238U isotope ratio below 10−10. With the new performance of the last generation of ICP-MS/MS and their capabilities to remove or reduce the measurement interferences, an accurate detection down to 10−11 is now possible.This new limit is now very close to the theoretical lowest achievable 236U/238U isotope ratio (5 × 10⁻¹²). However, there are still some drawbacks that are difficult to subvert: high sample volumes for samples with natural U concentration (∼10 g of sample, considering 3 μg g−1 for the Earth crust22) and instrumental memory effects requiring long washout time to ensure that uranium contamination is completely removed. With great care of the blank level, accurate detection of 236U/238U isotope ratios below 10−11 could be achievable. This method can be performed for example to discriminate uranium ore and natural uranium in environmental samples.
Author contributions
HJ, AG performed the ICP-MS/MS investigations. All authors have given approval to the final version of the manuscript.Conflicts of interest
There are no conflicts to declare.Acknowledgements
Authors are grateful to Peter Steier, Robin Golser (VERA Laboratory, Vienna, Austria) for the AMS measurements and for providing us with a sample of the KkU reference material. We also express our acknowledgements to Nicolas Cariou and Béatrice Boulet for method discussions.Notes and references
- J. S. Santos, L. S. G. Teixeira, W. N. L. dos Santos, V. A. Lemos, J. M. Godoy and S. L. C. Ferreira, Uranium determination using atomic spectrometric techniques: an overview, Anal. Chim. Acta, 2010, 674, 143–156 CrossRef CAS PubMed.
- A. D. Pollington, W. S. Kinman, S. K. Hanson and R. E. Steiner, Polyatomic interferences on high precision uranium isotope ratio measurements by MC-ICP-MS: applications to environmental sampling for nuclear safeguards, J. Radioanal. Nucl. Chem., 2016, 307(3), 2109–2115 CrossRef CAS.
- T. Ohno, N. Sato, J. Shikimori, Y. Ijichi, Y. Fukami and Y. Igarashi, Temporal change of 236U/238U and 235U/238U isotopic ratios in atmospheric deposition in Tokyo and Akita from 1963 to 1979, Sci. Total Environ., 2022, 810, 151292 CrossRef CAS PubMed.
- H. T. Lin, H. W. Chiang, T. L. Yu, M. Christl, J. Liu and K. DeLong, et al., 236U/238U Analysis of Femtograms of 236U by MC-ICPMS, Anal. Chem., 2021, 93(24), 8442–8449 CrossRef CAS PubMed.
- Y. Shao, G. Yang, D. Xu, M. Yamada, H. Tazoe and M. Luo, et al., First report on global fallout 236U and uranium atom ratios in soils from Hunan Province, China, J. Environ. Radioact., 2019, 197, 1–8 CrossRef CAS PubMed.
- W. Bu, J. Zheng, M. E. Ketterer, S. Hu, S. Uchida and X. Wang, Development and application of mass spectrometric techniques for ultra-trace determination of 236U in environmental samples – a review, Anal. Chim. Acta, 2017, 995, 1–20 CrossRef CAS PubMed.
- H. Jaegler, A. Gourgiotis, P. Steier, R. Golser, O. Diez and C. Cazala, Pushing limits of ICP-MS/MS for the determination of ultra-low 236U/238U isotope ratios, Anal. Chem., 2020, 7869–7876 CrossRef CAS PubMed.
- P. Steier, K. Hain, U. Klötzli, J. Lachner, A. Priller and S. Winkler, et al., The actinide beamline at VERA, Nucl. Instrum. Methods Phys. Res., Sect. B, 2019, 458, 82–89 CrossRef CAS.
- S. Richter, A. Alonso, W. De Bolle, R. Wellum and P. D. P. Taylor, Isotopic fingerprints for natural uranium ore samples, Int. J. Mass Spectrom., 1999, 193(1), 9–14 CrossRef CAS.
- T. Suzuki, T. Yamamura, C. Abe, K. Konashi and Y. Shikamori, Actinide molecular ion formation in collision/reaction cell of triple quadrupole ICP-MS/MS and its application to quantitative actinide analysis, J. Radioanal. Nucl. Chem., 2018, 318(1), 221–225 CrossRef CAS.
- S. Xing, M. Luo, Y. Wu, D. Liu and X. Dai, Rapid determination of uranium isotopes in calcium fluoride sludge by tandem quadrupole ICP-MS/MS, J. Anal. At. Spectrom., 2019, 34(10), 2027–2034 RSC.
- P. E. Warwick, B. C. Russell, I. W. Croudace and Ž. Zacharauskas, Evaluation of inductively coupled plasma tandem mass spectrometry for radionuclide assay in nuclear waste characterisation, J. Anal. At. Spectrom., 2019, 34(9), 1810–1821 RSC.
- W. Wang, R. D. Evans and H. E. Evans, A rapid, automated system for the separation, preconcentration and measurement of 90Sr, and U, Am and Pu isotopes, Talanta, 2021, 233, 122507 CrossRef CAS PubMed.
- Y. Zhu, A. Tomoko, K. Nakano and Y. Shikamori, Trends and Advances in Inductively Coupled Plasma Tandem Quadruple Mass Spectrometry (ICP-QMS/QMS) With Reaction, At. Spectrosc., 2021, 42, 299–309 CrossRef CAS.
- S. F. Boulyga, U. Klötzli and T. Prohaska, Improved abundance sensitivity in MC-ICP-MS for determination of 236U/238U isotope ratios in the 10−7 to 10−8 range, J. Anal. At. Spectrom., 2006, 21(12), 1427–1430 RSC.
- S. Diez-Fernández, H. Jaegler, C. Bresson, F. Chartier, O. Evrard and A. Hubert, et al., A new method for determining 236U/238U isotope ratios in environmental samples by means OF ICP-MS/MS, Talanta, 2020, 206, 120221 CrossRef PubMed.
- Y. Wang, X. Hou, W. Zhang, L. Zhang and Y. Fan, Determination of ultra-low 236U in environment samples using ICP-MS/MS measurement and chemical separation, Talanta, 2021, 224, 121882 CrossRef CAS PubMed.
- K. Harouaka, E. W. Hoppe and I. J. Arnquist, A novel method for measuring ultra-trace levels of U and Th in Au, Pt, Ir, and W matrices using ICP-QQQ-MS employing an O2 reaction gas, J. Anal. At. Spectrom., 2020, 35(12), 2859–2866 RSC.
- P. Steier, M. Bichler, L. Keith Fifield, R. Golser, W. Kutschera and A. Priller, et al., Natural and anthropogenic 236U in environmental samples, Nucl. Instrum. Methods Phys. Res., Sect. B, 2008, 266(10), 2246–2250 CrossRef CAS.
- Agilent Technologies, Agilent 8900 Triple Quadrupole ICP-MS: Leave Interferences Behind with MS/MS, 2020 Search PubMed.
- C. Carrier, A. Habibi, M. Agarande, C. Augeray, D. Bourles and D. Maro, et al., Mass-shift mode to quantify low level 129I in environmental samples by ICP-MS/MS, J. Anal. At. Spectrom., 2022, 37(6), 1309–1317 RSC.
- S. R. Taylor and S. M. McLennan, The geochemical evolution of the continental crust, Rev. Geophys., 1995, 33(2), 241 CrossRef.
Footnote |
| † Electronic supplementary information (ESI) available. See DOI: https://doi.org/10.1039/d3ja00175j |
| This journal is © The Royal Society of Chemistry 2023 |