 Open Access Article
Indium-modified copper nanocubes for syngas production by aqueous CO2 electroreduction†
Alessandro
Niorettini
a,
Raffaello
Mazzaro
*bc,
Fabiola
Liscio
 c,
Alessandro
Kovtun
 d,
Luca
Pasquini
 bc,
Stefano
Caramori
 a and
Serena
Berardi
 *a
*a
aDepartment of Chemical, Pharmaceutical and Agricultural Sciences, University of Ferrara, Via Luigi Borsari 46, 44121 Ferrara, Italy. E-mail: serena.berardi@unife.it; Tel: +39-0532-455368
bDepartment of Physics and Astronomy, University of Bologna, Via Berti Pichat 6/2, Bologna, Italy
cCNR-IMM, Via Piero Gobetti 101, Bologna, Italy
dCNR-ISOF, Via Piero Gobetti 101, Bologna, Italy
First published on 21st June 2022
Abstract
Electroreduction of carbon dioxide represents an appealing strategy to rethink a waste product as a valuable feedstock for the formation of value-added compounds. Among the metal electrodes able to catalyze such processes, copper plays a central role due to its rich chemistry. Strategies aimed at tuning Cu selectivity comprise nanostructuring and alloying/post-functionalization with heterometals. In this contribution, we report on straightforward electrochemical methods for the formation of nanostructured Cu–In interfaces. The latter were fully characterized and then used as cathodes for CO2 electroreduction in aqueous environment, leading to the selective production of syngas, whose composition varies upon changing the applied bias and indium content. In particular, gaseous mixtures compatible with the synthesis of methanol or aldehydes (i.e. respectively with 1![[thin space (1/6-em)]](https://www.rsc.org/images/entities/char_2009.gif) :
:![[thin space (1/6-em)]](https://www.rsc.org/images/entities/char_2009.gif) 2 and 1
2 and 1![[thin space (1/6-em)]](https://www.rsc.org/images/entities/char_2009.gif) :
:![[thin space (1/6-em)]](https://www.rsc.org/images/entities/char_2009.gif) 1 CO/H2 ratios) are produced at low (i.e. −0.62 V vs. RHE) applied bias with >3.5 mA cm−2 current densities (in absolute value). Even if the proposed cathodes undergo structural modifications upon prolonged exposure to CO2 reduction conditions, their catalytic activity can be restored by introducing an additional In(III) precursor to the electrolytic solution.
1 CO/H2 ratios) are produced at low (i.e. −0.62 V vs. RHE) applied bias with >3.5 mA cm−2 current densities (in absolute value). Even if the proposed cathodes undergo structural modifications upon prolonged exposure to CO2 reduction conditions, their catalytic activity can be restored by introducing an additional In(III) precursor to the electrolytic solution.
1. Introduction
The level of CO2 in the atmosphere is constantly growing mainly due to anthropogenic activities. The resulting greenhouse effect causes global warming, leading to the intensification of natural phenomena, such as hurricanes, floods and wildfires. Thus, it is pivotal to find solutions to mitigate the CO2 net emissions urgently. Three strategies are currently under study, i.e. decarbonization, carbon sequestration and carbon recycling. The first strategy aims at the (eventual) complete elimination of CO2 emissions due to human activities, 25% of which is caused by electricity generation.1 Thus, decarbonization implies the use of alternative energy vectors (e.g. hydrogen fuel) and the production of electricity via the exploitation of renewable sources (through photovoltaics, wind turbines, etc.). However, it is still difficult to envisage a complete substitution of the current fossil fuel-based technologies involving several key industrial processes (such as the production of plastic, cement, ammonia, etc.) and transportation. On the other hand, the second strategy aims at preventing CO2 release into the atmosphere. In this sense, carbon capture and storage (CCS) processes are implemented in order to separate the CO2 produced in a plant and store it underground. Considering all, the third approach, i.e. carbon recycling, is the more promising (provided the use of electricity produced via renewable technologies) as CO2 is converted to value-added products. It is worth noting that every recycling reaction is a reduction, with carbon being in its highest oxidation state in CO2. The source of protons and electrons would be water in the most ideal case. Examples of CO2 hydrogenation reactions, in which H2 acts as the reductant, have also been proposed.2 Alternatively, carbon dioxide reduction (from now on, CO2R) can be performed by exploiting either (bio)catalysis3 or electrochemistry.1,4 With regard to the latter approach, it is interesting to note that several reduction products can be formed, depending on the catalyst and the reaction conditions (e.g. electrochemical set-up, electrolyte, etc.). When metallic catalysts are used, straightforward categorization is possible, taking into account the major reaction product.5 In particular, (i) metals such as Au and Ag display the preferential formation of carbon monoxide; (ii) p-block elements (Sn, In, Pb, etc.) almost selectively convert CO2 to formate ions; (iii) Fe, Ti, Ni, and Co are inefficient CO2R catalysts as they are mainly promoting hydrogen production from the competitive water reduction reaction; and (iv) Cu leads to products with a higher degree of reduction, as well as to multicarbon products. The unique role played by copper in this kind of chemistry is related to its peculiar values of the binding energy of key CO2 reduction intermediates. In particular, Cu is the only metal that has a negative adsorption energy for *CO and a positive adsorption energy for *H (the asterisks indicate a site on the electrodic surface).5 Extensive work was made to unveil the mechanistic aspects beyond this chemistry, being able to yield up to 16 different reduced products from the electrolysis of an aqueous buffered solution in the presence of bare copper foil.6 At the same time, several studies were aimed at nanostructuring a Cu foil substrate (or at depositing preformed copper nanoparticles on inert substrates) in order to provide a catalytic surface with possible different reactivity and/or better selectivity.One of the most investigated nanostructuring strategies is the controlled formation of Cu oxides, which then undergo re-reduction under CO2R conditions. Several methods have been reported for the oxidation of Cu foil surfaces. For example, Kanan and coworkers reported a thermal treatment yielding rod-like nanostructures, with improved CO and formate selectivity at lower overpotentials with respect to a polycrystalline Cu foil.7 The Roldan Cuenya group instead used an oxygen plasma treatment, resulting in the formation of nanocubic structures with high selectivity for ethylene, namely 62% maximum faradaic efficiency (FE) at −0.9 V vs. the reversible hydrogen electrode, RHE (unless otherwise stated, all the potential values in this paper are reported vs. RHE).8 A similar cubic morphology was obtained by Nilsson and coworkers via successive oxidative–reductive cycles in the presence of templating chloride ions,9 showing the same preferential formation of ethylene, starting from −0.6 V. The Roldan Cuenya group reported also on the optimization of plasma-induced treatment, leading to the fine tuning of the morphology, ion content and defect density of Cu nanocubes and resulting in the production of significant amounts of ethanol (22% FE at −1 V) together with ethylene (45% FE under these conditions).10
Even if the formation of hydrocarbons and alcohols via CO2R represents the holy grail of this kind of chemistry, other reduction products have a potential industrial interest. Among them, carbon monoxide is an important building block in organic and organometallic synthesis, especially when produced in conjunction with hydrogen (the latter originating from the competitive water reduction reaction). Indeed, gaseous mixtures of CO and H2 in appropriate ratios constitute the synthesis gas (syngas), which is employed in industrially relevant processes, such as the Fischer–Tropsch process. This reaction enables the production of liquid fuels (diesel and gasoline), olefins, methanol and methane, depending on the CO/H2 ratio, as well as on the catalyst nature and reaction conditions.11–13 As already mentioned, CO2 is generally reduced to CO in the presence of noble metals, such as Au and Ag. However, Spurgeon and coworkers reported the selective formation of tunable ratios of syngas also using a Cu foil, providing a specific electrochemical pre-treatment.14 In particular, they reported a pulsed-bias electrochemical reduction in the millisecond time regime, which results in morphological changes of the foil surface and, in turn, in a different stabilization of key intermediates, leading to the observed catalytic selectivity.
Alternative strategies aimed at tuning the CO2R selectivity of bare Cu entail the formation of alloys. Indeed, several examples of mixing Cu with many other metals have been reported, resulting in either bulk or surface alloys, guest metal modified surfaces, or bimetallic core–shell structures.1,15
Inspired by these works, in this contribution we will report on straightforward electrochemical treatments aimed at nanostructuring Cu foils and further functionalizing them with indium, in order to yield both improved selectivity for syngas and high performance in terms of current density. The latter is an important, yet often overlooked, aspect in view of the possible commercialization of CO2R devices. Indeed, commercial electrolyzers generally operate at 200 mA cm−2, with >70% efficiency,16 while the typically reported performances of CO2R electrocatalysts are <3 mA cm−2.
Literature examples of Cu–In nanostructured catalysts for CO2R are still limited. For example, Takanabe and coworkers reported the electrochemical reduction of CuInO2, resulting in the formation of Cu11In9 and Cu7In3 alloys, with high efficiency in CO and formate production (respectively 70% and 20% FE at −0.8 V).17 The Züttel group reported on a Cu–In interface obtained when a thin layer of In was formed by dipping on top of Cu(OH)2 nanowires.18 When the In content is 20% vs. Cu, best performances in terms of CO evolution are observed, i.e. 93% FE at −0.6 V. Zangari and coworkers instead reported on the co-electrodeposition of mixed Cu–In phases with different compositional and dendritic morphologies.19 The electrodes with 40 at% In showed high formate production (49% FE), together with syngas in the optimal ratio H2/CO = 2.6, while the maximum amount of formate (62% FE) was obtained with 80 at% In cathodes. An array of Cu–In electrocatalyst coatings with good control of metal stoichiometries was prepared by the Berlinguette group via near-infrared driven decomposition of mixed-metal precursor solutions. Excellent selectivity for CO (ca. 90% FE) was maintained by CuxIn1−x alloys, with x being in the range 0.5–0.8.20
Herein we report on the use of nanostructured indium-modified copper cathodes for the selective formation of syngas via CO2 electroreduction in aqueous medium. The syngas composition can be tuned by varying the indium content and/or the applied potential. In particular, under −0.62 V applied bias, we obtained 1![[thin space (1/6-em)]](https://www.rsc.org/images/entities/char_2009.gif) :
:![[thin space (1/6-em)]](https://www.rsc.org/images/entities/char_2009.gif) 2 and 1
2 and 1![[thin space (1/6-em)]](https://www.rsc.org/images/entities/char_2009.gif) :
:![[thin space (1/6-em)]](https://www.rsc.org/images/entities/char_2009.gif) 1 CO/H2 mixtures, which can be exploited for the synthesis of methanol and hydroformylation reactions, respectively. Even if the medium-term operation under CO2R conditions results in some structural modifications of our cathodes, their performances can be fully restored upon the addition of an In(III) precursor to the electrolytic solution.
1 CO/H2 mixtures, which can be exploited for the synthesis of methanol and hydroformylation reactions, respectively. Even if the medium-term operation under CO2R conditions results in some structural modifications of our cathodes, their performances can be fully restored upon the addition of an In(III) precursor to the electrolytic solution.
2. Experimental
2.1. Materials
Copper foil (0.127 mm thick, 99.9% metal basis), titanium foil (0.25 mm thick, 99.5% metal basis), a Nafion® N-117 membrane (0.180 mm thick), KHCO3 (99.7–100.5%), and K2SO4 (99%) were purchased from Alfa Aesar. Indium foil (0.1 mm thick, 99.995%) was purchased from MaTeck. CO2 (>99.9%) was purchased from the SOL group. CO (99.0+%), indium(III) nitrate hydrate (99.999%), dimethylformamide (≥99.8%), and deuterium oxide (99.9 atom. % D) were purchased from Sigma-Aldrich. Citric acid (anhydrous, >99.5%), KCl (99.5%) and H3PO4 (85%) were respectively purchased from Fluka, Carlo Erba and VWR Chemicals. Unless otherwise stated, all chemicals were used without further purification. All electrolytic solutions were prepared using reagent grade water (Millipore, 18 MΩ resistivity).2.2. Preparation of the cathodes
Before use, Cu foils were electropolished in 85% H3PO4, holding +4 V voltage vs. a titanium counter electrode for 300 s. After this treatment, some foils were subjected to pulsed anodization, aimed at nanostructuring the surface. Briefly, the electropolished Cu foil was placed horizontally in a single compartment, three-electrode cell and then immersed in a 0.1 M K2SO4/0.04 M KCl aqueous electrolyte. The soldered ohmic contact was fully protected with epoxy resin. An Amel 552 potentiostat coupled with an Amel 568 in-line function generator was used to apply a square wave (SW) anodization, switching between +1 V and 0 V (vs. a double-jacketed SCE) with a frequency of 103 Hz for a total time of 300 s. The resulting electrode was later reduced in a 0.5 M aqueous KHCO3 solution via 20 successive linear voltammetry scans, sweeping the applied potential in the range of −0.2/−1.5 V vs. SCE at a scan rate of 20 mV s−1. This procedure allows for the reduction of the oxidized Cu layer resulting from the anodization, leading to the formation of the actual catalytic interface called OD-Cu (for oxide-derived Cu) throughout the text.Indium was electrodeposited on OD-Cu electrodes in a two-electrode cell configuration, using an indium wire as the counter electrode, following a slightly modified literature procedure.21 The deposition was carried out in the galvanostatic mode, while stirring a solution containing 0.04 M indium(III) nitrate and 0.5 M citric acid. The process was carried out until charge densities of 18, 36 and 54 C cm−2 were transferred, respectively, yielding OD-Cu_In18, OD-Cu_In36 and OD-Cu_In54 cathodes.
2.3. Morphological and structural characterization
Morphological characterization was performed using a Zeiss Leo 1530 Field Emission Scanning Electron Microscope (FE-SEM), operated at 5 kV. Nanoscale structural and compositional analyses were carried out by using a Philips TECNAI F20 ST high resolution transmission electron microscope (HR-TEM) operating at 200 kV. The instrument is equipped with an energy dispersive micro-analysis (EDS) and scanning transmission high angle annular dark field (STEM-HAADF) detector. For TEM observations, the cathode surface was scratched and the powder sonicated in isopropanol for 5 minutes, before being dropcast onto holey carbon-coated Au grids. The samples were dried at room temperature before observation.X-Ray Diffraction (XRD) patterns were recorded using a Rigaku SmartLab diffractometer equipped with a Cu-rotating anode and Soller slits to obtain a parallel beam with a divergence of 0.1°. Measurements were performed in specular and Grazing Incidence (GI) geometries to probe films at different penetration depths, from a few nanometers to microns. Due to the high film roughness, the incident angle in GI-XRD scans was varied from 0.5° to 3° in order to detect Bragg peaks from the film surface. Therefore, the exact values of the penetration length could not be estimated.
X-ray photoelectron spectra (XPS) were recorded using Mg Kα excitation and analysed using a hemispherical analyser (Phoibos 100, Specs). The survey and high-resolution spectra were acquired with energy resolutions of 1.4 eV and 0.9 eV, respectively, on freshly sputtered silver (Ag 3d). A spectrometer was calibrated to the Au 4f7/2 peak at 84.0 eV. Conductive carbon tape was used to fix and electrically ground the sample. No electrostatic charging effects were observed. The spectra were fit using the CasaXPS software after Shirley's background subtraction.
2.4. Electrochemical characterization
| V (vs. RHE) = V (vs. SCE) + 0.24 + 0.059·pH. |
The cathodic compartment of the cell was connected to a headspace, from which gaseous samples were automatically collected. Their detection and quantification were performed using an Agilent 490 micro GC (Agilent Technologies) equipped with a 5 Å molecular sieve column (10 m) and a thermal conductivity detector, with Ar as the carrier gas. Quantification of formate was performed via1H-NMR spectroscopy (Agilent, 300 MHz), using DMF as the external standard and a customized water suppression sequence. For each product, the faradaic efficiency (FE) was calculated as:
3. Results and discussion
3.1. Structural and morphological characterization of the samples
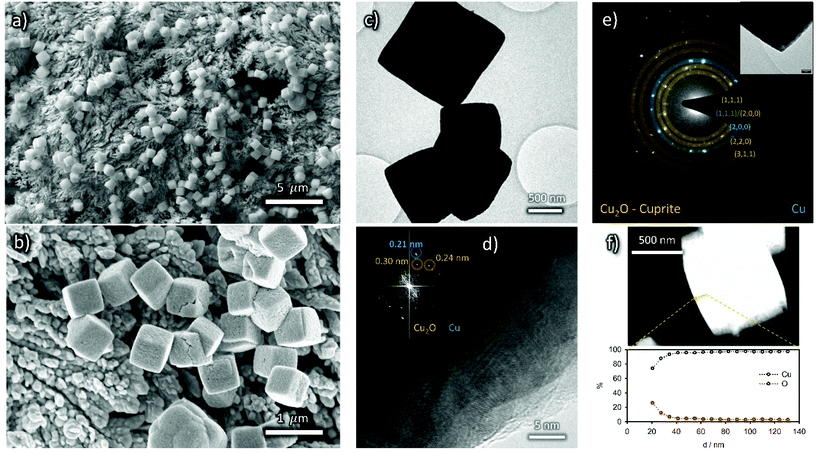
The synthesis of Cu nanostructures was realized by applying a fast (103 Hz) square wave anodization method to an electropolished Cu foil in the presence of chloride ions. The latter are known to act as templates for the formation of cubic Cu structures with a (100) facet orientation.25,26 It was reported that for nanostructuring protocols involving oxidative steps (e.g. either thermal,7 electrochemical9,14 or plasma-induced8,10), a Cu2O phase is firstly produced, which then undergoes reduction during the first steps of CO2R. The Roldan Cuenya group recently documented this process under in operando conditions, using liquid cell transmission electron microscopy.27 They also evidenced that some dynamical changes in the cubic morphology can occur, resulting in the formation of Cu dendritic structures.27Fig. 1 resumes the morphological and structural characterization of the nanostructured Cu cathodes after pulsed anodization modification. Fig. 1(a and b) report the SEM images of an OD-Cu sample, showing that this nanostructuring approach results in the deposition of randomly oriented nanocubes with an average size of <1 μm, even if some larger nanocubes are also observed. In the background of the SEM images, dendritic structures were also noticed, as previously discussed.
The crystal phase of the nanocubes was investigated by X-ray diffraction. Fig. 2a shows a comparison of the XRD patterns collected on bare OD-Cu in specular and grazing incidence geometries, which probe a thickness of a few μm and a few nm, respectively. The specular scan shows Bragg peaks of metallic face-centered cubic Cu with a partial preferred orientation along the 200 direction and Bragg reflections of the Cuprite (Cu2O) crystal structure. At grazing incidence, the (111)Cu/(200)Cu intensity peak ratio reflects the polycrystalline nature of the surface. The results indicate that the 200 texturing originates from the underlying Cu foil, while the Cu and Cu2O nanostructures grown on the top of it are randomly oriented, or, at least, polycrystalline.
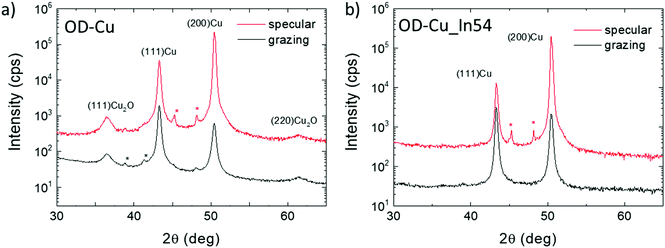 | ||
| Fig. 2 Specular- and GI-XRD scans on bare OD-Cu (a) and OD-Cu_In54 (b). Stars indicate peaks coming from spurious wavelengths. | ||
HR-TEM characterization of the OD-Cu nanocubes also confirms that metallic Cu and cuprite phases are concurrent in the sample (Fig. 1c–e), probably due to the formation of a native oxide layer upon atmosphere exposition. EDS analysis of the sample further proves the presence of an oxide layer on the nanocubes (Fig. 1f), while the complete structural characterization of their core is prevented by their thickness, fully electron-opaque.
The enhancement of the electrochemical surface area (ECSA) resulting from surface nanostructuring was measured via cyclic voltammetry experiments (see Fig. S1†). By determining the capacitive current with respect to the bare Cu foil, taken as the standard, we were able to estimate the roughness factor (RF) of the OD-Cu cathodes, which resulted to be ca. 50 (see Table S1†).
Fig. 3 shows the SEM images of In-modified cathodes, displaying a finer texturing and enhanced roughness of the nanocube surface that suggests the presence of an additional coating layer. However, the background areas behind the nanocubes appear smoother than in OD-Cu cathodes without indium, particularly for longer deposition times.
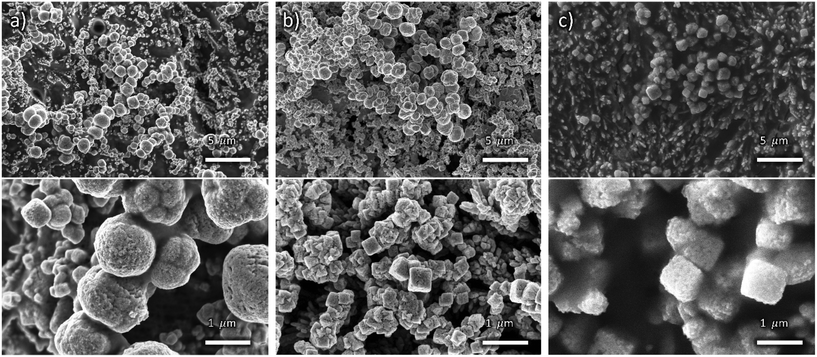 | ||
| Fig. 3 Low (top) and high (bottom) magnification FE-SEM images of OD-Cu_In18 (a), OD-Cu_In36 (b) and OD-Cu_In54 (c). | ||
This results in a lower ECSA with respect to the OD-Cu cathodes, as evidenced in Fig. S1e–j and Table S1.† Indeed, the OD-Cu_In18, OD-Cu_In36 and OD-Cu_In54 electrodes respectively displayed a roughness factor of 22, 27 and 39.
With regard to XRD characterization (Fig. 2b), the specular XRD pattern of OD-Cu_In54 shows Bragg peaks of metallic Cu with the preferential 200 orientation. As already noted for In-free cathodes, the GI-XRD measurements highlight a lower degree of preferential orientation of Cu crystallites, confirming that the produced nanostructures are not epitaxial with respect to the original Cu foil. The Bragg reflections of Cu2O were not detected in the In-modified cathode, indicating that the indium containing coating protects the underlying Cu from oxidation. No other Bragg reflections were detected, suggesting that the In-containing phases diffract very weakly, probably because of poor crystallinity.
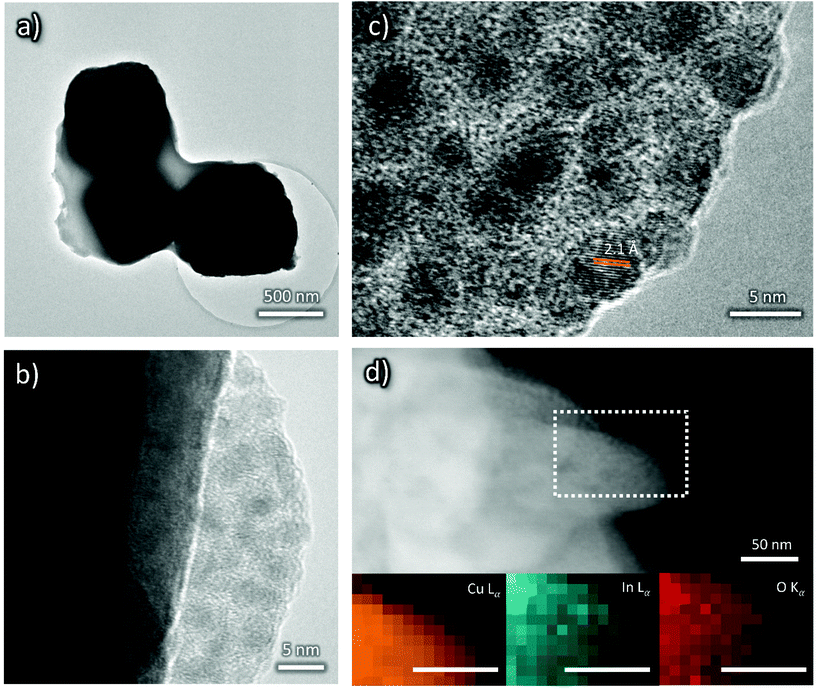
The morphology of the nanocubes may be still recognized in the low magnification TEM micrographs (Fig. 4a) but the HR-TEM image reveals the presence of a beam-sensitive amorphous layer around the nanocubes with embedded crystalline nanoparticles (<5 nm diameter, Fig. 4b and c). The d-spacing is compatible with both In2O3 and In(OH)3; an assignment will be done later in the text, based on XPS analysis. Consistently, EDS mapping displays that the described coating layer is rich in In and O (Fig. 4d).
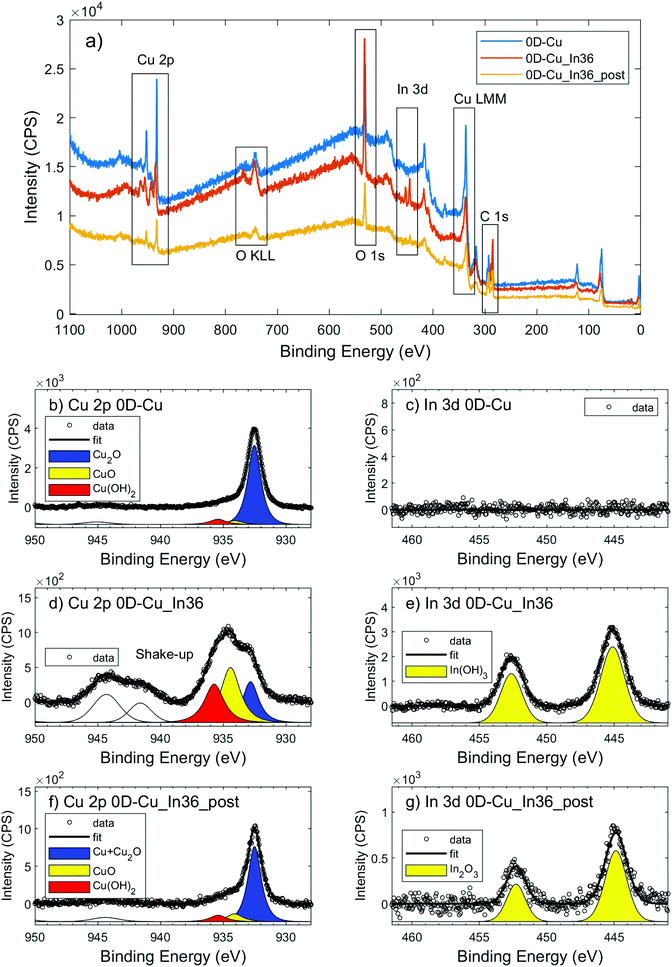
In order to gain more insights into the cathodes’ surface composition, their characterization via XPS was also performed. XPS Cu 2p, O 1s, C 1s and K 2p core level transitions were found in the XPS survey signal of OD-Cu (Fig. 5a). From the high resolution spectra of Cu 2p (Fig. 5b) and the corresponding Auger transition of Cu LMM (Fig. 5a), the chemical state of Cu in OD-Cu was identified; the values of the Cu 2p3/2 binding energy (932.5 ± 0.1 eV) and the Auger modified parameter (AP = 1849.1 ± 0.2) were in agreement with Cu(I) in oxidized form (Cu2O);28 nevertheless, the presence of Cu(II) components was below 10%, as deduced from the Cu 2p fit in Fig. 5b. The presence of Cu2O was further supported by the presence of an O–Cu signal in O 1s at 530.6 eV (Fig. S2a†).29,30 From the high resolution C 1s signal, apart from aliphatic/adventitious carbon at 285.3 eV, the presence of a carboxyl group or carbonate ions associated with the peak at 289 eV can be observed (Fig. S2b†). In the same C 1s region, the K 2p signal was found. Both these features are due to adsorbed ions, residual from the OD-Cu synthesis.
After In deposition, the signal of In 3d5/2 at 445.2 eV has revealed the presence of In(III) in OD-Cu_In36 (Fig. 5e).31 One may conclude that the most probable chemical state could be In2O3, but considering that In2O3 usually presents a slightly lower chemical shift (3d5/2 444.7 eV), this association is not obvious. A recent paper by Detweiler32 reports a systematic study of In oxidation under dry and wet conditions, finding a reliable energy separation between In2O3 (444.7 eV) and In(OH)3 (445.1 eV), compatible with our results. Thus, it is reasonable to claim that the chemical state of In in OD-Cu_In36 is In(OH)3. The increase in the O 1s signal supported both the formation of In2O3 or In(OH)3, notwithstanding, the signal of O–In is in the same region of O–Cu, being 530.3 eV and 530.7 eV, respectively, but no significant increase was found; while the hydroxyl In-OH signal at 532 eV has contributed to the main peak of O 1s (Fig. S2c†), together with oxygen in the carbonate.33
After the galvanostatic deposition of indium, the K 2p signal disappeared and the Cu chemical state changed (Fig. 5d) from Cu(I) to Cu(II), as confirmed by the binding energy of Cu 2p3/2 (934.4 ± 0.1 eV) and AP (1850.2 ± 0.2 eV). From the Cu 2p fit in Fig. 5d, at least 3 components were found: Cu2O, CuO and Cu(OH)2. The accurate ratio of Cu(II) was hard to find. Cu(II) is not stable under X-ray irradiation and the evolution of the Cu 2p signal in OD-Cu_In36 (Fig. S3a†) revealed the photoreduction phenomenon that usually occurs under similar conditions.34,35 Thus, Cu(II) was certainly the most abundant prior to the irradiation, while the presence of Cu(I) is mainly ascribed to X-ray irradiation. The O 1s signal of Cu(OH)2 was found in the 532 eV region, the same region of indium hydroxide (see Fig. S2c†).
In summary, XRD showed that the deposition of an In layer prevented the formation of a relatively thick (e.g., detectable by XRD) Cu2O layer. However, XPS shows that the Cu oxidation state in the near surface layers changes from the prevalently Cu(I) of Cu2O to the dominant Cu(II) of CuO and Cu(OH)2 as a consequence of In deposition. Indium itself occurs as oxidized In(III) in In(OH)3.
3.2. CO2R activity
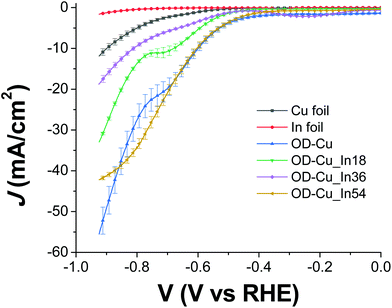
The cathodes were tested under electrochemical CO2R conditions in a two-compartment, three-electrode electrochemical cell in 0.5 M KHCO3 saturated with CO2. Fig. 6 shows the current density normalized for the geometrical area (J) vs. the applied bias (V) curves for all the samples. As expected, the output current generated with the nanostructured OD-Cu electrode is higher (ca. 5-fold) than that registered with the Cu foil, reaching up to −53 mA cm−2 at −0.92 V.The different performances of these two interfaces are also evident from the quantitative analysis of the CO2R products, reported in Fig. S4a and b† in terms of faradaic efficiency (FE) in the range −0.62 V/−0.92 V. It is worth noting that the reductive working potential indicated is applied for 4 cycles of 300 s each, spaced by short (40 s) reconditioning steps at the open circuit potential (see e.g. Fig. S5a† for the curves obtained for an OD-Cu_In36 cathode). This procedure was introduced in order to remove adsorbed poisoning species, likely graphitic carbon deposits36 and/or the produced CO itself.37–39 Anyway, the reconditioning steps only impact the total electrolysis time by less than 10%. At the same time, pulsed CO2 electroreduction conditions were reported to cause transient changes in local pH and CO2 concentrations,40 as well as in the electric field near the catalyst surface.14 This behavior can significantly impact the binding energies of the adsorbed reaction intermediates, which in turn affect the product distribution. Indeed, with regard to the activity of the Cu foil, we observe FE values that differ from those generally reported.1,6 In particular, CO evolution starts at −0.62 V, peaks at −0.72 V (max FE = 6%), and then decreases, while an appreciable production of formate and methane begins at −0.82 V (see Fig. S4a†). Anyway, the total CO2R products account for ca. 10% of the total current, with H2 being the main product (FE >46%). On the other hand, the OD-Cu cathodes display higher selectivity for CO, reaching up to 18% FE at −0.82 V, while formate starts to be produced at −0.62 V with a maximum FE of 8% (see Fig. S4b†). At −0.82 V applied bias, these cathodes also produce methane (with max FE = 3.5%) and ethylene (max FE = 5% at −0.92 V). Even if the total FE due to CO2R is higher (ca. 25%) with respect to that of the Cu foil, the main product is still H2.
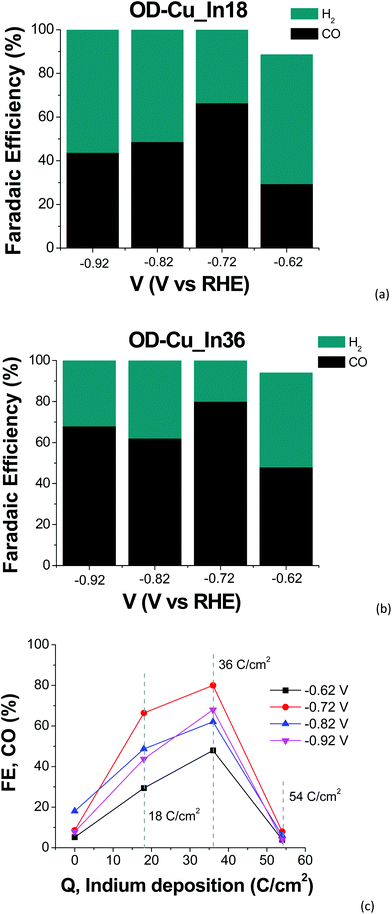
Indium deposition greatly affects the performances of the mixed-metal cathodes. With regard to the current output (see Fig. 6), the Cu–In cathodes display decreased values at −0.92 V with respect to OD-Cu, which can be ascribed (at least partly) to reduced RF. Furthermore, we do not observe a linear dependence of the current density on the In content, with the order being OD-Cu_In36 < OD-Cu_In18 < OD-Cu_In54. Anyway, the selectivity of these composite interfaces towards syngas production significantly increases with respect to OD-Cu. Indeed, as evidenced in Fig. 7a and b, for OD-Cu_In18 and OD-Cu_In36, no other product than syngas is present in the explored bias range. Appreciable syngas evolution starts at −0.62 V, a relatively low overpotential for the production of the two gases. Under these conditions, the H2/CO ratio is ≈2![[thin space (1/6-em)]](https://www.rsc.org/images/entities/char_2009.gif) :
:![[thin space (1/6-em)]](https://www.rsc.org/images/entities/char_2009.gif) 1 for OD-Cu_In18 with ca. −5 mA cm−2 current density (see Fig. S5b†) and ≈1
1 for OD-Cu_In18 with ca. −5 mA cm−2 current density (see Fig. S5b†) and ≈1![[thin space (1/6-em)]](https://www.rsc.org/images/entities/char_2009.gif) :
:![[thin space (1/6-em)]](https://www.rsc.org/images/entities/char_2009.gif) 1 with ca. −3.5 mA cm−2 for OD-Cu_In36 (Fig. S5a†). These syngas compositions are respectively compatible with the production of methanol41 and with hydroformylation reactions.42 A gaseous mixture with a H2/CO ratio of ≈1
1 with ca. −3.5 mA cm−2 for OD-Cu_In36 (Fig. S5a†). These syngas compositions are respectively compatible with the production of methanol41 and with hydroformylation reactions.42 A gaseous mixture with a H2/CO ratio of ≈1![[thin space (1/6-em)]](https://www.rsc.org/images/entities/char_2009.gif) :
:![[thin space (1/6-em)]](https://www.rsc.org/images/entities/char_2009.gif) 1 was also obtained for OD-Cu_In18 at −0.82 V, sustaining significant current densities in the range −15/−18 mA cm−2 (Fig. S5b†).
1 was also obtained for OD-Cu_In18 at −0.82 V, sustaining significant current densities in the range −15/−18 mA cm−2 (Fig. S5b†).
As far as the production of sole CO versus the applied bias is concerned, a typical volcano trend is observed, with the efficiency peaking at −0.72 V for both cathodes, and OD-Cu_In36 yielding a maximum FE of 80%. We also observed the dependence of the FE for CO production on the amount of deposited indium, with OD-Cu_In36 again being the optimized electrode that outperforms the other cathodes in all the explored potential range (see Fig. 6c). A qualitative comparison between the performances of our OD-Cu_In36 cathode and other Cu–In based interfaces reported in the literature is also provided in Table S3.†
At the same time, when the indium content increases, H2 evolution becomes the dominant reaction (see Fig. S4c†), with the FE for CO production being <10% for OD-Cu_In54. A similar trend for CO and H2 production was also observed by Züttel and coworkers for the surface modification of Cu(OH)2 nanowires with metallic In nanoparticles.18 Density functional theory studies revealed that the optimized bimetallic interfaces (i.e. those with the highest number of Cu–In interfacial sites, generated by a medium coverage of In on the Cu surface) significantly decrease the free energy barrier for the formation of *COOH (the key intermediate for CO formation) and the strength of the adsorbed *H (thus limiting H2 production). Also in our case, when the deposited indium exceeds the optimal amount obtained for the OD-Cu_In36 cathode, the interfacial reactivity changes, closely resembling the catalytic outcomes obtained when using a bare In foil (see Fig. S4d†). Indeed, under our conditions, both the latter and the OD-Cu_In54 electrode produce only H2 and CO in the low applied bias range, but at higher negative bias values formate ions are also produced (up to 19% FE at −0.92 V for OD-Cu_In54, see Fig. S4c†). These results further point out that pulsed electrolysis strongly affects the reactivity of the catalytic metal and the absorption/desorption of key intermediates as CO2R by indium generally yields HCOO− as the main product.1
The observed enhanced selectivity for CO2 reduction to CO can be due also to a synergistic effect between Cu and In(OH)3, as recently pointed out by Larrazábal et al.43 Indeed, when the In(OH)3 layer was etched from an OD-Cu_In36 cathode by means of an acid treatment reported in the literature,43 the CO2R performances of the cathode were strongly reduced. As evidenced in Fig. S5c,† when comparing the FE for CO production by a pristine OD-Cu_In36 cathode with those of the exact same electrode after 2 successive etching treatments, under the latter conditions we formed ca. 2/3 and 1/3 of the initial CO amount.
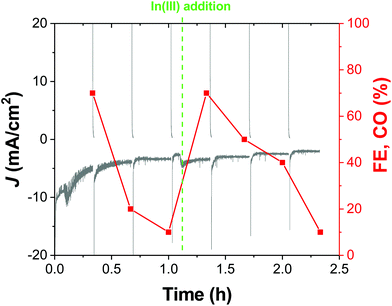
While the chronoamperometric experiments for product detection and accumulation gave us the first hint of the good stability of our cathodes in a 20 min timescale, a representative OD-CuIn36 cathode was also tested under longer-term CO2R conditions. Indeed, Fig. 8 shows the >2 hour-long electrolysis at −0.72 V, displaying that after the first 0.25 h, the current density sets at a quite stable value of ca. −3.5 mA cm−2. However, when sampling the reaction, we observed a decrease in the initial CO amount (accounting for a 70% FE, the sole other product being H2) down to ca. 10% FE after 1 h. With the performances in terms of current density essentially unvaried in this time frame, some structural modifications in the catalyst should occur, favoring H2 evolution. In order to shed light on this behavior, we performed microscopic and spectroscopic characterization of the cathodes after the operation.
In particular, XPS analysis evidenced that after 1 hour of electrochemical CO2R the OD-Cu_In36 cathode (called OD-Cu_In36_post) presents the same elements of the pristine one (except for the appearance of K), but in the overall reduced chemical state: Cu is reduced from Cu(II) to Cu(I) + Cu(0) and In changes from the hydroxide to the oxide chemical state. Combining information from the main signal of Cu 2p3/2 (932.5 ± 0.1 eV) and the double signal present in the Auger Cu LMM signal (AP 1851.1 ± 0.2 eV for Cu(0) and AP 1849.1 ± 0.2 eV for Cu(I)), we can support that the surface after the electrochemical test is mostly a mix of metallic Cu and Cu2O, pointing out that the XPS was performed ex situ, thus Cu2O may also arise from the atmospheric passivation of metallic Cu. On the other hand, indium decreases at relative concentrations, from 1.8 to 0.8%, and presents a shift (see Fig. S3c†) in the binding energy from 445.2 eV to 444.9 eV compatible with the chemical change from the hydroxide to the oxide state, as discussed above. Finally, the O 1s signal presents an increase of pure oxide (Cu2O and In2O3) components in the 530.8–530.5 eV region with respect to hydroxides and C–O at 532 eV.
Grazing-incidence XRD supports these results, evidencing the appearance of the cuprite phase after CO2R, as also confirmed by an increase in the oxygen content in EDS analysis (see Fig. S6†). A lower indium content is also observed, probably due to a partial dissolution of the deposited In-based nanostructures, consistent with the drop in the FE for CO production observed over prolonged exposure to the electrolysis conditions. In agreement with that, the SEM and TEM micrographs do not exhibit a homogeneous distribution of the In-based coating, in contrast to what was observed before the electrolysis experiment (Fig. S7†).
However, the catalytic activity can be fully restored by performing an additional indium deposition step in situ. Indeed, as evidenced in Fig. 8, after the addition of In(NO3)3 to the electrolytic solution, the CO production was fully restored, in favor of the restoration of the active In-based layer.
4. Conclusions
Nanostructured Cu cathodes with a predominant nanocubic morphology were prepared via straightforward and readily available electrochemical procedures. Their characterization revealed the presence of both metallic Cu and Cuprite (Cu2O). Further functionalization of these cathodes through In deposition led to the formation of heterointerfaces with enhanced activity towards the selective reduction of the greenhouse gas CO2 to a valuable product, i.e. syngas. In particular, in aqueous solution and under low applied bias (i.e. −0.62 V), the OD-Cu_In18 and OD-Cu_In36 cathodes produced gaseous mixtures with ≈2![[thin space (1/6-em)]](https://www.rsc.org/images/entities/char_2009.gif) :
:![[thin space (1/6-em)]](https://www.rsc.org/images/entities/char_2009.gif) 1 and ≈1
1 and ≈1![[thin space (1/6-em)]](https://www.rsc.org/images/entities/char_2009.gif) :
:![[thin space (1/6-em)]](https://www.rsc.org/images/entities/char_2009.gif) 1 H2/CO compositions, which can be exploited respectively for the synthesis of methanol and aldehydes, with current densities >3.5 mA cm−2 in absolute value. Even if the medium-term stability of the cathodes under CO2R conditions suffers from the partial leaching of the In-based active phase, their catalytic activity towards syngas formation can be restored upon further addition of the In(III) precursor to the electrolytic solution.
1 H2/CO compositions, which can be exploited respectively for the synthesis of methanol and aldehydes, with current densities >3.5 mA cm−2 in absolute value. Even if the medium-term stability of the cathodes under CO2R conditions suffers from the partial leaching of the In-based active phase, their catalytic activity towards syngas formation can be restored upon further addition of the In(III) precursor to the electrolytic solution.
Future work will be directed towards the implementation of the proposed copper nanostructuring/indium functionalization electrochemical techniques to three dimensional substrates, such as Cu foams. The resulting cathodes would provide a porous environment with a highly exposed interfacial area, thus leading to higher currents. Furthermore, their use as gas diffusing electrodes can also be envisaged, in order to perform the reduction of CO2 in the gas phase.
Conflicts of interest
The authors declare no conflict of interest.Acknowledgements
This project received funding from the European Union's Horizon 2020 Research and Innovation Programme, under the Grant Agreement No. 101006839 (H2020 Research Innovation Actions 2020–2024 “CONDOR”).References
- S. Nitopi, E. Bertheussen, S. B. Scott, X. Liu, A. K. Engstfeld, S. Horch, B. Seger, I. E. Stephens, K. Chan, C. Hahn, J. K. Nørskov, T. F. Jaramillo and I. Chorkendorff, Chem. Rev., 2019, 119, 7610–7672 CrossRef CAS PubMed
.
- R.-P. Ye, J. Ding, W. Gong, M. D. Argyle, Q. Zhong, Y. Wang, C. K. Russell, Z. Xu, A. G. Russell and Q. Li, Nat. Commun., 2019, 10, 1–15 CrossRef PubMed
.
- A. M. Appel, J. E. Bercaw, A. B. Bocarsly, H. Dobbek, D. L. DuBois, M. Dupuis, J. G. Ferry, E. Fujita, R. Hille, P. J. Kenis, C. A. Kerfeld, R. H. Morris, C. H. F. Peden, A. R. Portis, S. W. Ragsdale, T. B. Rauchfuss, J. N. H. Reek, L. C. Seefeldt, R. K. Thauer and G. L. Waldrop, Chem. Rev., 2013, 113, 6621–6658 CrossRef CAS PubMed
.
- C. Yang, Y. Wang, L. Qian, A. M. Al-Enizi, L. Zhang and G. Zheng, ACS Appl. Energy Mater., 2021, 4, 1034–1044 CrossRef CAS
.
- A. Bagger, W. Ju, A. S. Varela, P. Strasser and J. Rossmeisl, ChemPhysChem, 2017, 18, 3266–3273 CrossRef CAS PubMed
.
- K. P. Kuhl, E. R. Cave, D. N. Abram and T. F. Jaramillo, Energy Environ. Sci., 2012, 5, 7050–7059 RSC
.
- C. W. Li and M. W. Kanan, J. Am. Chem. Soc., 2012, 134, 7231–7234 CrossRef CAS PubMed
.
- H. Mistry, A. S. Varela, C. S. Bonifacio, I. Zegkinoglou, I. Sinev, Y.-W. Choi, K. Kisslinger, E. A. Stach, J. C. Yang, P. Strasser and B. Roldan Cuenya, Nat. Commun., 2016, 7, 1–9 Search PubMed
.
- F. S. Roberts, K. P. Kuhl and A. Nilsson, Angew. Chem., 2015, 127, 5268–5271 CrossRef
.
- D. Gao, I. Zegkinoglou, N. J. Divins, F. Scholten, I. Sinev, P. Grosse and B. Roldan Cuenya, ACS Nano, 2017, 11, 4825–4831 CrossRef CAS PubMed
.
- M. E. Dry, Appl. Catal., A, 1996, 138, 319–344 CrossRef CAS
.
- M. E. Dry, Catal. Today, 2002, 71, 227–241 CrossRef CAS
.
- M. E. Dry, J. Chem. Technol. Biotechnol., 2002, 77, 43–50 CrossRef CAS
.
- B. Kumar, J. P. Brian, V. Atla, S. Kumari, K. A. Bertram, R. T. White and J. M. Spurgeon, ACS Catal., 2016, 6, 4739–4745 CrossRef CAS
.
- J. He, N. J. Johnson, A. Huang and C. P. Berlinguette, ChemSusChem, 2018, 11, 48–57 CrossRef CAS PubMed
.
- M. Carmo, D. L. Fritz, J. Mergel and D. Stolten, Int. J. Hydrogen Energy, 2013, 38, 4901–4934 CrossRef CAS
.
- A. Jedidi, S. Rasul, D. Masih, L. Cavallo and K. Takanabe, J. Mater. Chem. A, 2015, 3, 19085–19092 RSC
.
- W. Luo, W. Xie, R. Mutschler, E. Oveisi, G. L. De Gregorio, R. Buonsanti and A. Züttel, ACS Catal., 2018, 8, 6571–6581 CrossRef CAS
.
- Z. B. Hoffman, T. S. Gray, K. B. Moraveck, T. B. Gunnoe and G. Zangari, ACS Catal., 2017, 7, 5381–5390 CrossRef CAS
.
- J. He, K. E. Dettelbach, D. A. Salvatore, T. Li and C. P. Berlinguette, Angew. Chem., 2017, 129, 6164–6168 CrossRef
.
- S. Rasul, D. H. Anjum, A. Jedidi, Y. Minenkov, L. Cavallo and K. Takanabe, Angew. Chem., 2015, 127, 2174–2178 CrossRef
.
-
C. G. Vayenas, R. E. White and M. E. Gamboa-Aldeco, Modern Aspects of Electrochemistry 42, Springer Science & Business Media, 2008 Search PubMed
.
- H. Kim, H. S. Park, Y. J. Hwang and B. K. Min, J. Phys. Chem. C, 2017, 121, 22637–22643 CrossRef CAS
.
- E. Irtem, T. Andreu, A. Parra, M. Hernández-Alonso, S. García-Rodríguez, J. Riesco-García, G. Penelas-Pérez and J. Morante, J. Mater. Chem. A, 2016, 4, 13582–13588 RSC
.
- M. J. Siegfried and K.-S. Choi, J. Am. Chem. Soc., 2006, 128, 10356–10357 CrossRef CAS PubMed
.
- M. J. Siegfried and K. S. Choi, Adv. Mater., 2004, 16, 1743–1746 CrossRef CAS
.
- R. M. Arán-Ais, R. Rizo, P. Grosse, G. Algara-Siller, K. Dembélé, M. Plodinec, T. Lunkenbein, S. W. Chee and B. Roldan Cuenya, Nat. Commun., 2020, 11, 1–8 CrossRef PubMed
.
- C. Wagner, Faraday Discuss. Chem. Soc., 1975, 60, 291–300 RSC
.
- E. Bojestig, Y. Cao and L. Nyborg, Surf. Interface Anal., 2020, 52, 1104–1110 CrossRef CAS
.
- I. Platzman, R. Brener, H. Haick and R. Tannenbaum, J. Phys. Chem. C, 2008, 112, 1101–1108 CrossRef CAS
.
- C. Yan, M. Zharnikov, A. Gölzhäuser and M. Grunze, Langmuir, 2000, 16, 6208–6215 CrossRef CAS
.
- Z. M. Detweiler, S. M. Wulfsberg, M. G. Frith, A. B. Bocarsly and S. L. Bernasek, Surf. Sci., 2016, 648, 188–195 CrossRef CAS
.
- D. R. Baer and J. Moulder, Surf. Sci. Spectra, 1993, 2, 1–7 CrossRef CAS
.
- M. Brust, P. M. Blass and A. J. Bard, Langmuir, 1997, 13, 5602–5607 CrossRef CAS
.
- W. M. Skinner, C. A. Prestidge and R. S. C. Smart, Surf. Interface Anal., 1996, 24, 620–626 CrossRef CAS
.
- R. Shiratsuchi, Y. Aikoh and G. Nogami, J. Electrochem. Soc., 1993, 140, 3479 CrossRef CAS
.
- Y. Hori, A. Murata and R. Takahashi, J. Chem. Soc., Faraday Trans. 1, 1989, 85, 2309–2326 RSC
.
- Y. Hori, A. Murata and Y. Yoshinami, J. Chem. Soc., Faraday Trans., 1991, 87, 125–128 RSC
.
- E. L. Clark and A. T. Bell, J. Am. Chem. Soc., 2018, 140, 7012–7020 CrossRef CAS PubMed
.
- N. Gupta, M. Gattrell and B. MacDougall, J. Appl. Electrochem., 2006, 36, 161–172 CrossRef CAS
.
- V. Dieterich, A. Buttler, A. Hanel, H. Spliethoff and S. Fendt, Energy Environ. Sci., 2020, 13, 3207–3252 RSC
.
- R. Franke, D. Selent and A. Börner, Chem. Rev., 2012, 112, 5675–5732 CrossRef CAS PubMed
.
- G. n. O. Larrazábal, A. J. Martín, S. Mitchell, R. Hauert and J. Pérez-Ramírez, ACS Catal., 2016, 6, 6265–6274 CrossRef
.
Footnote |
| † Electronic supplementary information (ESI) available. See DOI: https://doi.org/10.1039/d2dt00779g |
| This journal is © The Royal Society of Chemistry 2022 |


