Ballistic ΔS = 2 intersystem crossing in a cobalt cubane following ligand-field excitation probed by extreme ultraviolet spectroscopy†
Yusef
Shari'ati
 and
Josh
Vura-Weis
 *
*
Department of Chemistry, University of Illinois at Urbana-Champaign, Urbana, IL, USA. E-mail: vuraweis@illinois.edu
First published on 24th November 2021
Abstract
Femtosecond M2,3-edge X-ray absorption near-edge structure (XANES) spectroscopy is used to probe the excited-state dynamics of the cobalt cubane [CoIII4O4](OAc)4(py)4 (OAc = acetate, py = pyridine), a model for water oxidation catalysts. After ligand-field excitation, intersystem crossing (ISC) to a metal-centered quintet occurs in 38 fs. 30% of the hot quintet undergoes ballistic back-ISC directly to the singlet ground state, with the remainder relaxing to a long-lived triplet.
Introduction
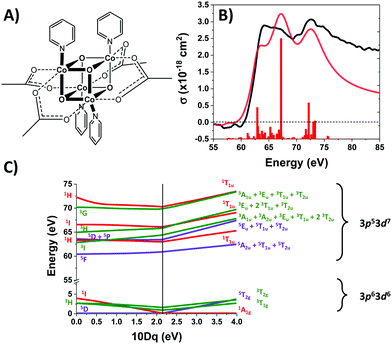
The realization of renewable solar fuels on a global scale requires the development of earth-abundant water oxidation catalysts. The tetrametallic oxo-cluster, [CoIII4O4](OAc)4(py)4 (OAc = acetate, py = pyridine), henceforth “Co4O4”, is a promising molecular compound that has attracted significant interest due to its provocative “cubane” structure which bears a strong resemblance to the active core of the oxygen-evolving complex (OEC) of photosystem II in plants. Co4O4 (shown in Fig. 1A) also exhibits water oxidation activity in several homogeneous photocatalytic systems,1–3 as well as in heterogeneous studies where it has been incorporated into photoanodes of TiO2, Fe2O3, and BiVO4.4–8 Under the high intensity irradiation conditions of photocatalysis, Co4O4 excited states may be populated either through direct absorption or via energy transfer from a photosensitizer.The excited-state dynamics of Co(III) complexes have received fairly little study, especially compared to their isoelectronic Fe(II) counterparts.9,10 Optical transient absorption spectroscopy of amine-coordinated Co(III) complexes such as Co(ethylenediamine)33+ indicate picosecond relaxation to quintet metal-centered (5MC) states after ligand-to-metal charge transfer (LMCT) excitation, whereas Co(acac)3 was proposed to relax to triplet MC states (3MC) in 10–20 fs followed by vibrational relaxation on the triplet surface.11,12
In this work, we use femtosecond M2,3-edge X-ray Absorption Near Edge Structure (XANES) spectroscopy to measure a cascade of intersystem crossing events in Co4O4 after ligand-field excitation, including a surprisingly efficient ΔS = 2 crossing between the hot 5T2 state and the 1A1 ground state. M2,3-edge XANES probes 3p → 3d transitions in the extreme ultraviolet (XUV) spectral region (40–100 eV) and is a sensitive reporter of spin state, oxidation state, and ligand field symmetry. This technique been previously used to examine excited state dynamics, including ISC, in metal oxides,13–15 semiconductors,16–19 and molecular complexes.20–22
Co4O4 consists of four low-spin d6 Co3+ atoms, each of which is in an approximately octahedral ligand field. The UV-Visible spectrum of Co4O4 (Fig. S1, ESI†) exhibits three features in the 300–1000 nm range (note that all oscillator strengths are reported per cubane molecule, not per cobalt atom). A prominent feature at 364 nm has been assigned as a O2-(2p) → Co3+(eg) LMCT band based on its strength (∼104 L mol−1 cm−1) and by comparison to other compounds bearing Co–O bonds.14,23,24 The two lower energy features (451 nm and 646 nm) are consistent with d–d transitions, which in the limit of Oh symmetry correspond to 1A1 → 1T2 and 1A1 → 1T1 transitions. Analysis of the d6 Tanabe–Sugano (TS) diagram yields a ligand field splitting 10Dq of 2.1 eV and predicts 3T1g as the lowest energy excited state (see ESI†). This 10Dq is consistent with published values for octahedral Co3+ complexes bearing aquo, carbonato, or oxalato ligands which present an electronic environment similar to that of Co4O4.25 Rigorously speaking, cobalt sites in Co4O4 are not of Oh symmetry due to the lone axial pyridine. Tetragonal distortion likely contributes to the relatively high molar absorptivity (∼500 L mol−1 cm−1) of the d–d transitions.
Methods
M2,3-edge XANES spectra of Co4O4 were acquired from thin film samples of the complex deposited upon polymer membranes.26 Details of its synthesis are described in the supporting information. The extreme ultraviolet probe continuum was produced by high-harmonic generation in a tabletop instrument using a Ti:sapphire driving laser (800 nm, 4 mJ, 35 fs, 1 kHz) focused into a ∼100 torr neon gas cell.27 Time-resolved experiments utilized the focused ∼2.5 mJ cm−2 550 nm pump output of a noncollinear optical parametric amplifier driven from a 0.65 mJ portion of the same laser. Absolute time zero was determined and corrected for by periodic measurement of the instrument-response limited onset of Fe2O3 signal after 550 nm excitation,13 with the instrument response function (IRF) found to be 48 fs FWHM. The spectrometer energy resolution is 0.3 eV, calibrated using the atomic absorption lines of ionized xenon and the XUV absorptions of Fe2O3, NiO, and Al.Results
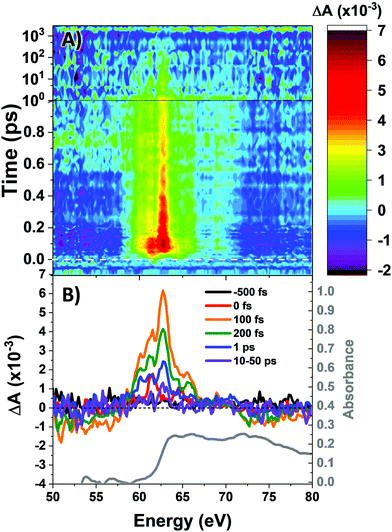
The M2,3-edge XANES spectrum of Co4O4, shown in Fig. 1B, exhibits features at 64.2, 66.2, and 72.3 eV. This three-peaked structure is in accordance with the predictions of crystal field theory for low-spin d6 complexes and corroborates previous studies.22,27 In an analogy to Tanabe–Sugano diagrams, the 3p63d6 → 3p53d7 transitions probed here can be analysed as shown in the correlation diagram of Fig. 1C. In the weak-field limit, parent states are assigned Russel–Saunders term symbols and ordered by Hund's rules, giving a 5D ground state. Moving to the right of the diagram, octahedral symmetry is imposed and the newly split states are described by Mulliken term symbols. As ligand-field strength (10Dq) increases the low-spin states become favoured. Transition energies vary with ligand-field strength and spin state, making M2,3-edge XANES spectroscopy a powerful probe of electronic structure. Situated on the right-hand side of the diagram, Co4O4 exhibits three transitions from its 1A1g to 1T1u states. Spin–orbit coupling is neglected in this simple picture, but included in ligand field multiplet (LFM) simulations performed with the program CTM4XAS, as detailed in the supplemental information. These simulations reproduce the position of the three features, though the height of the middle peak is overestimated. In addition to the singlet transitions important in the ground state of Co4O4, the analysis is useful for predictions of triplet and quintet excited states.The transient M2,3-edge XANES response after d–d excitation at 550 nm is shown in Fig. 2A, with spectral slices at selected delay times in Fig. 2B. A short-lived signal is apparent at time zero, exhibiting two sharp positive peaks at 61.6 and 64.6 eV and weak ground state bleaches at energies below 58 eV and above 71.4 eV. This initial spectrum transforms within 100 fs to a longer-lived spectrum characterized by a strong absorption at 62.8 eV, a smaller secondary peak at 65.6 eV, and the same ground state bleaches as the initial signal. The signal subsequently undergoes a loss in intensity without change in shape until ∼1 ps where the spectral shape begins to again evolve: the main 62.8 eV feature diminishes further while the bleach near 72.5 eV has instead become positive. Finally, the signal decays away over hundreds of picoseconds completely disappearing by 3 ns.
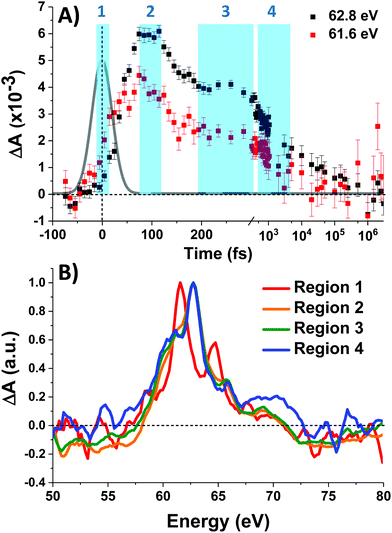
Fig. 3A shows the time traces at 61.6 and 62.8 eV corresponding to the maxima of the initial short-lived spectrum and its immediate successor. Notable features visible in this plot include the ∼35 fs delay from time zero between the two signal traces, and a significant and abrupt drop in magnitude between 100 and 200 fs. Four regions of interest were selected and their averaged and normalized spectra are shown in Fig. 3B. These are: region 1 (−15 to 15 fs) where the first short-lived spectrum appears, region 2 (75 to 115 fs) the high plateau, region 3 (200 to 300 fs) a flat valley immediately after the abrupt drop, and region 4 (900 fs to 5 ps) where the system appears to decay exponentially. The assignment of the dominant states comprising these regions is now discussed.
Photoexcitation into the 1T1/1T2 states populates antibonding eg orbitals and induces bond expansion which propels the system towards an intersection with nearby low-lying triplet and quintet states,28,29 any of which are plausible candidates for the singlet's relaxation products. LFM simulated difference spectra of these states are shown in Fig. 4A. The simulated 1T1 difference spectrum exhibits two positive features near 60 and 65 eV with a negative feature between them near 62.5 eV. The energy of these features is a good match to the spectrum of Region 1 in Fig. 3B, although the height of the positive features is underestimated. The 1T1 and 1T2 spectra are similar, though the latter bears a bleach at 65 eV unlike Region 1. The Region 1 spectrum transforms sequentially into the spectra of Regions 2 and then 3, whose difference spectra are almost identical in shape and thus likely represent the same electronic state. These are characterized by a strong positive absorption at 62.8 eV, two positive shoulders at 65.6 eV and 69.0 eV, and a broad bleach at energies greater than 71.4 eV. A broad bleach also occurs prior to the edge near 57 eV. These features are reproduced in the simulated quintet 5T2 difference spectrum in Fig. 4A, whereas the simulated triplets in contrast are a poor match. In particular, the triplet simulations predict a positive signal above ∼70 eV instead of the bleach predicted for the quintet. The lack of a high-energy bleach in the triplet spectrum can be understood by inspection of the correlation diagram in Fig. 1C, which shows several high-energy triplet transitions that nearly overlap with those of the singlet. The spectrum in Regions 2 and 3 is therefore assigned as 5T2, suggesting that the singlet excited state undergoes rapid two-electron intersystem crossing to the quintet state. If an intermediate triplet state were involved it would have to be extremely short-lived (<30 fs). Finally, the weak transient signal of Region 4 emerges. Relative to Region 3, the spectrum of Region 4 bears a broadened positive absorption near 62.8 eV and the 72.5 eV bleach has become a positive excited state absorption – features characteristic of the 3T1 triplet simulation.
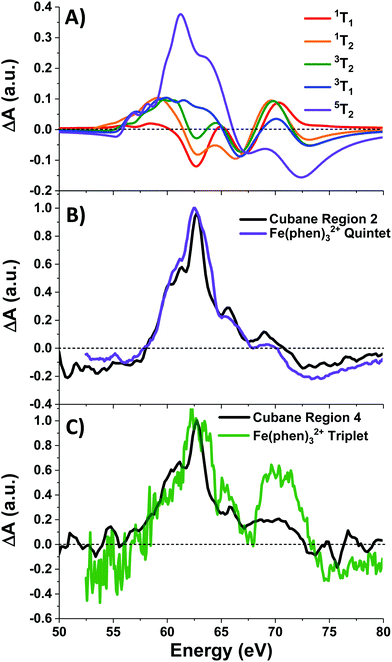 | ||
| Fig. 4 (A) LFM simulations of cubane excited states, and (B) normalized quintet difference spectra of Fe(phen)32+ (from ref. 22) compared with that of cubane Region 2, and (C) triplet intermediate spectrum (ibid.) compared with cubane Region 4. Fe(phen)32+ spectra have been blue-shifted 5.5 eV. | ||
Further corroboration of these assignment is achieved by comparison with Fe(II) spin-crossover complexes,22,28–30 which are isoelectronic to the d6 metal centers in the cubane. A recent transient M2,3-edge XANES study found that Fe(phen)32+ (phen = o-phenanthroline), after pumping into its metal-to-ligand charge transfer (MLCT) band at 535 nm, relaxes to an intermediate 3T1 state and then into a metastable 5T2 state.22 The difference spectra associated with these two states are reproduced in Fig. 4B-C along with the spectra of Regions 2 and 4 of cubane. With a +5.5 eV shift applied to the Fe(phen)32+ data to account for the increased 3p binding energy of cobalt, the spectra are a good match in the case of the triplet, and essentially superimposable for the quintet. To summarize: excitation of the d–d transitions in Co4O4 yields an initial 1T1 state that rapidly transforms into the 5T2 state, presumably through the unobserved 3T2 intermediate. The 5T2 state relaxes into a metastable 3T1 state which eventually settles to the ground state. Note that this sequence is consistent with the state orderings predicted both from the TS diagram and from DFT calculations (see ESI†).
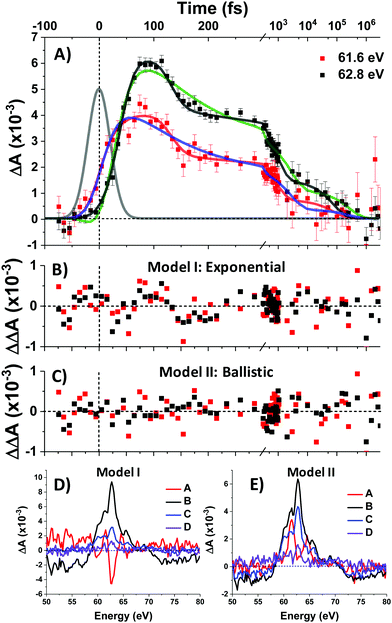
To complement the above qualitative analysis the data were subjected to global analysis under two different models (I and II), each consisting of four states visited sequentially before returning to the ground state: A → B → C → D → GS. Model I imposes single exponential (first-order) kinetics upon each transition and yielded time constants τ1 = 30 ± 2 fs, τ2 = 108 ± 20 fs, τ3 = 2.9 ± 0.7 ps, and τ4 = 285 ± 114 ps. Both this fit and that of Model II below are convolved with the IRF. Fit traces for the 61.6 eV and 62.8 eV features are shown in Fig. 5A and the extracted component spectra are shown in Fig. 5D. The component spectra in Fig. 5D correspond well with the spectra of Regions 1–4 (Fig. 3B) except for Component A, which exhibits a much stronger bleach at 62.8 eV and makes it better match the simulated 1T1 spectrum (Fig. 4A). However, the exponential kinetics of Model I fail to capture the dynamics between 100 and 200 fs, where an abrupt ∼30% decrease in signal intensity is observed. Indeed, residuals for the fit (Fig. 5B) at early times (to 1 ps) exhibit undulatory deviations indicative of inadequacy in the model. Moreover, the rapidity of the spectral evolution for the first two state transitions (30 fs and 108 fs respectively) suggest a process faster than is physically reasonable for exponential (first-order) kinetics.
Exponential kinetics arise when the transitions between states derive from the probabilistic overtopping of a reaction barrier between those states, with the barrier height described by the activation energy. In contrast, low-barrier or barrierless crossings between appropriately situated potential energy surfaces (PES) results in high-probability curve crossings events. The kinetics are then controlled not by the barrier but rather by the time it takes a population to ballistically traverse the PES from its initial entry point to the curve crossing, and this traversal time can be very short—on the order of a quarter period of the vibrational mode associated with the PES.28,31
Model II replaces τ1 and τ2 with ballistic traversal time constants ω1 and ω2, yielding fit values of ω1 = 38 ± 2 fs, ω2 = 94 ± 5 fs, τ3 = 794 ± 345 fs, and τ4 = 83 ± 14 ps), with component spectra in Fig. 5E. As can be seen qualitatively in Fig. 5A, Model II is better able to capture the rise and fall of the data; Model II residuals (Fig. 5C) do not exhibit the palpably patterned deviations of Model I. Goodness-of-fit between Models I and II was quantitatively assessed and found to favour Model II at the 95% confidence level. The details of this error analysis are described in the supporting information.
Discussion
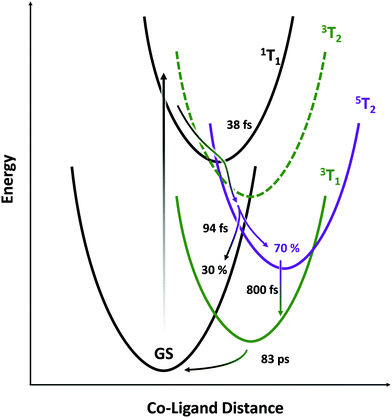
The picture that emerges (illustrated schematically in Fig. 6) is consistent with the state orderings predicted from both the TS diagram and DFT calculations (see ESI†). After ligand-field excitation into the singlet, the system rapidly (38 fs) follows a ballistic trajectory into the quintet manifold. Descending on the quintet surface, it encounters a crossing with the singlet GS after a further 94 fs and loses 30% of its population there. The remaining 70% cools on the quintet surface, then converts into the lowest energy triplet over several picoseconds. The LFM simulations in Fig. 4A predict that the triplet transient should be ∼25% the strength of the quintet, which is seen here experimentally. If the calculations underestimate this ratio, then the loss in intensity accompanying 5T2 → 3T1 conversion can be explained by an additional parallel exponential decay pathway to the GS. Finally, the metastable triplet relaxes with exponential kinetics back to the ground state in 83 ps.The rapid ΔS = 2 intersystem crossing from the 1T1 state to the 5T2 state may be understood in the context of extensive research on Fe(II) chromophores. After 1MLCT excitation, intersystem crossing to the 3MLCT and internal conversion to a 3T state occur in 100–150 fs, followed by 3T → 5T ISC in ∼50 fs. These inverted kinetics led to early controversy30,32 over the presence of the 3T state, but the brief occupation of this state was later confirmed using spin-sensitive core-level spectroscopy.22,28 This model was supported by theoretical work which rationalized this possibility by re-evaluating the effective spin–orbit coupling between those states—finding it highly geometry dependent—and showed the importance of molecular vibrations on the magnitude of spin-vibronic coupling.33–36 Predicted ISC rates are often over 1013 s−1, with the doublet-to-quartet process in Fe–Co Prussian-blue analogues calculated to be as little as 20 fs.37 Intersystem crossing between metal-centered states with ΔS = 1 occurs with essentially 100% quantum yield at the crossing point between electronic PESs, as shown by work combining X-ray emission spectroscopy and X-ray scattering.28
In the present work, the relatively slow 3MLCT → 3T step is avoided by directly exciting the 1T1 d–d state. Similarly, in an Fe(II) complex, d–d excitation was shown to populate the 5T state in as little as 70 fs, leading to enhanced 80 cm−1 coherent oscillations on the quintet surface due to lack of dephasing in the MLCT state.29 The 635 cm−1 IR band of Co4O4 has been assigned to Co–O stretching vibrations involving the Co3(μ3-O) core, with a short (53 fs) period.38 This frequency is significantly higher than the ∼250 cm−1 (∼133 fs) mode in most Fe–N6 complexes and is likely the primary determinant for the consequentially rapid 38 fs ΔS = 2 process in Co4O4. Hence, the limiting factor is not the magnitude of spin–orbit coupling matrix element, but rather the frequency of M–L stretching modes on the PESs.
The most surprising result of this study is the high (30%) yield of back-ISC upon a single crossing of the 5T2/1GS surfaces, as shown by the IRF-limited drop in the intensity of the 5T2 spectrum at 130 fs. While the ΔS = 2 forward-ISC could be rationalized as two subsequent ΔS = 1 processes that are unresolved given the time resolution of this study, there is no intermediate triplet in this portion of the quintet PES. To first order, the spin–orbit coupling matrix element for the double spin–flip is zero. However, second-order SOC can lead to significant coupling between singlet and quintet states, and mediates the back-ISC from the 5T2 state in molecules such as Fe(bpy)32+, on ∼ns timescales.39 The second-order coupling is especially significant in the presence of large distortions from the equilibrium geometry as are found in vibrationally hot states. For example, Sousa et al. calculated a spin–orbit coupling matrix element of up to 67 cm−1 for the 1MLCT → 5T2 crossing in Fe(bpy)32+, only a factor of 3–5 less than the maximum coupling for 3T → 5T2 transitions. Given the ∼100% quantum yield of the 3T → 5T2 process found in Fe(II) complexes, a 30% efficient ΔS = 2 process becomes increasingly plausible. While our treatment thus far has considered all of the photophysics to occur at a single Co center, the four cobalt atoms within the cubane cluster exhibit significant electronic delocalization and metal–metal interactions,40 which would enhance any heavy-atom effects on ISC rate.41,42
Further theoretical work will be required to map the excited-state potential energy surfaces and the coupling between them, though the presence of four metal centers will be a considerable computational challenge. The Co4O4 cubane itself presents a flexible platform for substitution of its ligands43 and incorporation of heterometals into its core,44 potentially providing insights into the factors affecting ultrafast ISC. We note that the high cross-section of M-edge XANES transitions results in a strong transient signal even with low excitation density (4% per cubane, 1% per Co), avoiding multiple excitation of a single cubane and simplifying the analysis.
Conclusions
Time resolved M2,3-edge XANES spectroscopy was used to probe the metal-centered dynamics of the cobalt cubane Co4O4 after pumping its d–d transitions at 550 nm. This revealed the presence of a short-lived singlet state that rapidly undergoes intersystem crossing into the quintet state within 38 fs. This quintet was identified by comparison with LFM simulations and with the M2,3-edge XANES signal of the known quintet in the isoelectronic Fe(phen)32+ system. Ballistic back-intersystem crossing returns 30% of the quintet to the singlet ground state in 94 fs. The remainder of the quintet progresses into a metastable triplet state which then relaxes back to the ground state in 83 ps. This work highlights the aptitude of M2,3-edge XANES spectroscopy towards the characterization of short-lived metal-centered states in transition metal complexes, and shows that single-step ΔS = 2 ISC is a viable decay pathway in such systems.Conflicts of interest
There are no conflicts to declare.Acknowledgements
This material is based upon work supported by the U.S. Department of Energy, Office of Science, Office of Basic Energy Sciences under Award Number DE-SC0018904. This material is based upon work supported by the National Science Foundation Graduate Research Fellowship under Grant No. DGE-1746047. The XUV instrument was built with partial support from the Air Force Office of Scientific Research under AFOSR Award No. FA9550-14-1-0314.References
- A. Genoni, G. La Ganga, A. Volpe, F. Puntoriero, M. Di Valentin, M. Bonchio, M. Natali and A. Sartorel, Faraday Discuss., 2015, 185, 121–141 RSC
.
- H. Liu and H. Frei, ACS Catal., 2020, 10, 2138–2147 CrossRef CAS
.
- S. Berardi, G. La Ganga, M. Natali, I. Bazzan, F. Puntoriero, A. Sartorel, F. Scandola, S. Campagna and M. Bonchio, J. Am. Chem. Soc., 2012, 134, 11104–11107 CrossRef CAS PubMed
.
- W. Jiang, X. Yang, F. Li, Q. Zhang, S. Li, H. Tong, Y. Jiang and L. Xia, Chem. Commun., 2019, 55, 1414–1417 RSC
.
- J. Li, Y. Jiang, Q. Zhang, X. Zhao, N. Li, H. Tong, X. Yang and L. Xia, RSC Adv., 2017, 7, 4102–4107 RSC
.
- B. Zhang, F. Li, F. Yu, X. Wang, X. Zhou, H. Li, Y. Jiang and L. Sun, ACS Catal., 2014, 4, 804–809 CrossRef CAS
.
- Y. Wang, F. Li, X. Zhou, F. Yu, J. Du, L. Bai and L. Sun, Angew. Chem., Int. Ed., 2017, 56, 6911–6915 CrossRef CAS PubMed
.
- S. Ye, C. Ding, R. Chen, F. Fan, P. Fu, H. Yin, X. Wang, Z. Wang, P. Du and C. Li, J. Am. Chem. Soc., 2018, 140, 3250–3256 CrossRef CAS PubMed
.
- O. S. Wenger, Chem. – Eur. J., 2019, 25, 6043–6052 CrossRef CAS PubMed
.
- J. K. McCusker, Science, 2019, 363, 484–488 CrossRef CAS PubMed
.
- J. K. McCusker, K. N. Walda, D. Magde and D. N. Hendrickson, Inorg. Chem., 1993, 32, 394–399 CrossRef CAS
.
- L. Ferrari, M. Satta, A. Palma, L. Di Mario, D. Catone, P. O’Keeffe, N. Zema, T. Prosperi and S. Turchini, Front. Chem., 2019, 7, 348 CrossRef CAS PubMed
.
- J. Vura-Weis, C. M. Jiang, C. Liu, H. Gao, J. M. Lucas, F. M. F. De Groot, P. Yang, A. P. Alivisatos and S. R. Leone, J. Phys. Chem. Lett., 2013, 4, 3667–3671 CrossRef CAS
.
- C. M. Jiang, L. R. Baker, J. M. Lucas, J. Vura-Weis, A. P. Alivisatos and S. R. Leone, J. Phys. Chem. C, 2014, 118, 22774–22784 CrossRef CAS
.
- A. Cirri, J. Husek, S. Biswas and L. R. Baker, J. Phys. Chem. C, 2017, 121, 15861–15869 CrossRef CAS
.
- M. A. Verkamp, J. Leveillee, A. Sharma, A. Schleife and J. Vura-Weis, J. Am. Chem. Soc., 2021 DOI:10.1021/jacs.1c07817
.
- S. K. Cushing, A. Lee, I. J. Porter, L. M. Carneiro, H. T. Chang, M. Zürch and S. R. Leone, J. Phys. Chem. C, 2019, 123, 3343–3352 CrossRef CAS
.
- E. Principi, E. Giangrisostomi, R. Mincigrucci, M. Beye, G. Kurdi, R. Cucini, A. Gessini, F. Bencivenga and C. Masciovecchio, Phys. Rev. B, 2018, 97, 174107 CrossRef CAS
.
- S. K. Cushing, I. J. Porter, B. R. de Roulet, A. Lee, B. M. Marsh, S. Szoke, M. E. Vaida and S. R. Leone, Sci. Adv., 2020, 6, eaay6650 CrossRef CAS PubMed
.
- E. S. Ryland, K. Zhang and J. Vura-Weis, J. Phys. Chem. A, 2019, 123, 5214–5222 CrossRef CAS PubMed
.
- R. Ash, K. Zhang and J. Vura-Weis, J. Chem. Phys., 2019, 151, 104201 CrossRef PubMed
.
- K. Zhang, R. Ash, G. S. Girolami and J. Vura-Weis, J. Am. Chem. Soc., 2019, 141, 17180–17188 CrossRef CAS PubMed
.
- T. C. Davenport and T. D. Tilley, Dalton Trans., 2015, 44, 12244–12255 RSC
.
- S. A. Chavan, D. Srinivas and P. Ratnasamy, J. Catal., 2001, 204, 409–419 CrossRef CAS
.
- A. R. Riordan, A. Jansma, S. Fleischman, D. B. Green and D. R. Mulford, Chem. Educ., 2005, 10, 115–119 CAS
.
- Y. Shari’ati and J. Vura-Weis, J. Synchrotron Radiat., 2021, 28, 1850–1857 CrossRef PubMed
.
- K. Zhang, M. F. Lin, E. S. Ryland, M. A. Verkamp, K. Benke, F. M. F. De Groot, G. S. Girolami and J. Vura-Weis, J. Phys. Chem. Lett., 2016, 7, 3383–3387 CrossRef CAS PubMed
.
- K. S. Kjær, T. B. Van Driel, T. C. B. Harlang, K. Kunnus, E. Biasin, K. Ledbetter, R. W. Hartsock, M. E. Reinhard, S. Koroidov, L. Li, M. G. Laursen, F. B. Hansen, P. Vester, M. Christensen, K. Haldrup, M. M. Nielsen, A. O. Dohn, M. I. Pápai, K. B. Møller, P. Chabera, Y. Liu, H. Tatsuno, C. Timm, M. Jarenmark, J. Uhlig, V. Sundstöm, K. Wärnmark, P. Persson, Z. Németh, D. S. Szemes, É. Bajnóczi, G. Vankó, R. Alonso-Mori, J. M. Glownia, S. Nelson, M. Sikorski, D. Sokaras, S. E. Canton, H. T. Lemke and K. J. Gaffney, Chem. Sci., 2019, 10, 5749–5760 RSC
.
- S. Zerdane, M. Cammarata, O. Iasco, M. L. Boillot and E. Collet, J. Chem. Phys., 2019, 151, 171101 CrossRef CAS PubMed
.
- G. Auböck and M. Chergui, Nat. Chem., 2015, 7, 629–633 CrossRef PubMed
.
- N. A. Miller, A. Deb, R. Alonso-Mori, J. M. Glownia, L. M. Kiefer, A. Konar, L. B. Michocki, M. Sikorski, D. L. Sofferman, S. Song, M. J. Toda, T. E. Wiley, D. Zhu, P. M. Kozlowski, K. J. Kubarych, J. E. Penner-Hahn and R. J. Sension, J. Phys. Chem. A, 2018, 122, 4963–4971 CrossRef CAS PubMed
.
- C. Bressler, C. Milne, V.-T. Pham, A. ElNahhas, R. M. van der Veen, W. Gawelda, S. Johnson, P. Beaud, D. Grolimund, M. Kaiser, C. N. Borca, G. Ingold, R. Abela and M. Chergui, Science, 2009, 323, 489–492 CrossRef CAS PubMed
.
- W. Baker and M. Van Veenendaal, Phys. Rev. B, 2021, 104, 014407 CrossRef CAS
.
- J. Chang, A. J. Fedro and M. Van Veenendaal, Phys. Rev. B: Condens. Matter Mater. Phys., 2010, 82, 075124 CrossRef
.
- C. Sousa, A. Domingo and C. de Graaf, Chem. – Eur. J., 2018, 24, 5146–5152 CrossRef CAS PubMed
.
- C. Sousa, M. Llunell, A. Domingo and C. De Graaf, Phys. Chem. Chem. Phys., 2018, 20, 2351–2355 RSC
.
- M. Van Veenendaal, Sci. Rep., 2017, 7, 6672 CrossRef PubMed
.
- R. Chakrabarty, S. J. Bora and B. K. Das, Inorg. Chem., 2007, 46, 9450–9462 CrossRef CAS PubMed
.
- A. Britz, W. Gawelda, T. A. Assefa, L. L. Jamula, J. T. Yarranton, A. Galler, D. Khakhulin, M. Diez, M. Harder, G. Doumy, A. M. March, É. Bajnóczi, Z. Németh, M. Pápai, E. Rozsályi, D. Sárosiné Szemes, H. Cho, S. Mukherjee, C. Liu, T. K. Kim, R. W. Schoenlein, S. H. Southworth, L. Young, E. Jakubikova, N. Huse, G. Vankó, C. Bressler and J. K. McCusker, Inorg. Chem., 2019, 58, 9341–9350 CrossRef CAS PubMed
.
- R. G. Hadt, D. Hayes, C. N. Brodsky, A. M. Ullman, D. M. Casa, M. H. Upton, D. G. Nocera and L. X. Chen, J. Am. Chem. Soc., 2016, 138, 11017–11030 CrossRef CAS PubMed
.
- C. M. Marian, Annu. Rev. Phys. Chem., 2020, 72, 617–640 CrossRef PubMed
.
- Y. Shimizu and T. Azumi, J. Phys. Chem., 1982, 86, 22–26 CrossRef CAS
.
- A. I. Nguyen, J. Wang, D. S. Levine, M. S. Ziegler and T. D. Tilley, Chem. Sci., 2017, 8, 4274–4284 RSC
.
- A. I. Nguyen, D. L. M. Suess, L. E. Darago, P. H. Oyala, D. S. Levine, M. S. Ziegler, R. D. Britt and T. D. Tilley, J. Am. Chem. Soc., 2017, 139, 5579–5587 CrossRef CAS PubMed
.
Footnote |
| † Electronic supplementary information (ESI) available: Details concerning the synthesis of cobalt cubane, sample preparation, LFM and density functional theory simulations, and the M-edge XANES spectrometer. See DOI: 10.1039/d1cp04136c |
| This journal is © the Owner Societies 2021 |

