
 Open Access Article
 This Open Access Article is licensed under a
 Creative Commons Attribution 3.0 Unported Licence
Predicting the phase diagram of titanium dioxide with random search and pattern recognition†
Aleks
Reinhardt
a,
Chris J.
Pickard
bc and
Bingqing
Cheng
*ade
aDepartment of Chemistry, University of Cambridge, Lensfield Road, Cambridge, CB2 1EW, UK. E-mail: bc509@cam.ac.uk
bDepartment of Materials Science & Metallurgy, University of Cambridge, 27 Charles Babbage Road, Cambridge, CB3 0FS, UK
cAdvanced Institute for Materials Research, Tohoku University, Sendai, Japan
dTCM Group, Cavendish Laboratory, University of Cambridge, J. J. Thomson Avenue, Cambridge, CB3 0HE, UK
eTrinity College, Trinity Street, Cambridge, CB2 1TQ, UK
First published on 22nd May 2020
Abstract
Predicting phase stabilities of crystal polymorphs is central to computational materials science and chemistry. Such predictions are challenging because they first require searching for potential energy minima and then performing arduous free-energy calculations to account for entropic effects at finite temperatures. Here, we develop a framework that facilitates such predictions by exploiting all the information obtained from random searches of crystal structures. This framework combines automated clustering, classification and visualisation of crystal structures with machine-learning estimation of their enthalpy and entropy. We demonstrate the framework on the technologically important system of TiO2, which has many polymorphs, without relying on prior knowledge of known phases. We find a number of new phases and predict the phase diagram and metastabilities of crystal polymorphs at 1600 K, benchmarking the results against full free-energy calculations.
I. Introduction
Predicting the properties of solid materials requires an understanding of how atoms are arranged, which in turn necessitates the determination of the relative stabilities of possible crystal polymorphic phases under various conditions. Advances in crystal structure prediction,1 including random structure search (RSS),2 particle-swarm optimisation,3 Monte Carlo simulations with variable box shapes4 and basin hopping,5 allow us to find minima on the potential-energy surface (PES) and thus to identify potentially competitive polymorphs. However, in these approaches only the enthalpy H at 0 K is typically computed and used to determine phase stability, even though the difference in entropy S between polymorphs can play a significant role.6,7 Relative Gibbs energies (G = H − TS), which in actuality dictate thermodynamic (meta)stability, are seldom computed, despite their importance for phases that can be synthesised at one thermodynamic condition but remain metastable under other conditions.Although Gibbs energies can be computed using free-energy methods such as thermodynamic integration (TI),6,8,9 such calculations are non-trivial and usually require long simulations, making them both expensive and tedious if one wants to use the PES computed from first-principles methods such as density-functional theory (DFT).10 Moreover, crystal-structure prediction schemes typically result in a multitude of structures. It can be challenging to rationalise how the structures are related to one another and which ones are promising candidates under given thermodynamic conditions.
In this study, we propose an approximate method that combines RSS and machine learning (ML) to estimate free energies of solid phases and hence the thermodynamic phase behaviour of a system of interest with relatively little computational effort and without relying on prior knowledge of the known phases. We have selected titanium dioxide at ambient and high pressures to benchmark the method because it is a widely used metal oxide with a large number of polymorphs (see the ESI†), many of which may have interesting optical,11 mechanical12 and electrochemical13 properties. Furthermore, high-pressure TiO2 phases can also serve as analogues of the structures adopted by many other important AX2 systems that are of particular interest in geology, such as high-pressure silicas.14
II. Methods
A. Calculations using empirical potential
For RSS and accurate free energy calculations, we focus on the simple MA empirical pair potential for TiO215 because of its low computational cost.9We performed RSS at 0 GPa, 20 GPa, 40 GPa and 60 GPa using the AIRSS16,17 package interfaced with Lammps.18 For each RSS run, we first chose a reasonable cell shape at random, and added 2, 3, 4, 6, 8, 9 or 12 formula units TiO2 of into the simulation cell at random positions while keeping the initial density of the cell close to the typical density range of this system. We set a lower bound on the interatomic distance for each pair of atomic species, but otherwise imposed no additional constraints or symmetries on the initial structures. We then relaxed each structure using a second-order conjugate gradient algorithm until the forces on atoms and the difference between the target and actual pressures both became negligible.
To benchmark how well our approximate framework can predict the phase behaviour TiO2 of at ambient and high pressures as described by the MA potential, we also performed free-energy calculations for both the known phases and the new phases obtained from RSS. Specifically, we computed the chemical potentials of the polymorphs using Frenkel–Ladd integration8,19 and subsequent TI along isobars and isotherms, as detailed in ref. 9.
All the necessary input files for performing the above-mentioned calculations using AIRSS and Lammps are provided in the ESI.†
B. DFT calculations
For the metastable polymorphs identified with the MA potential, we performed geometrical optimisation and computed the enthalpies at the DFT level over a pressure range of 0 GPa to 70 GPa in steps of 10 GPa. We separately employed three common functionals, LDA,20 PBE21 and PBEsol,22 using the CASTEP ab initio simulation package.23 Full details of the DFT set-ups and configurations can be found in the input files supplied in the ESI.†The key value of the current study lies in the data analysis, which we describe in the following section. A Python notebook implementing the machine learning and data processing steps, input and data files are available on the public repository https://github.com/BingqingCheng/TiO2_random_search_pattern_recognition.
III. Results and analysis
A. Characterisation of structures found by RSS
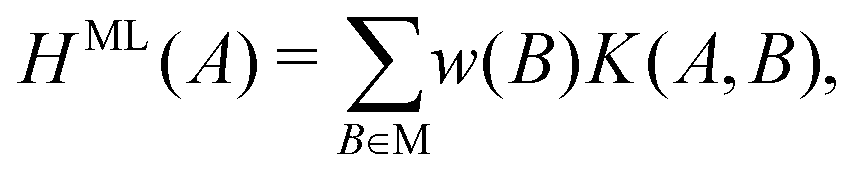
At each pressure, RSS using the MA potential produced thousands of distinct TiO2 structures with different atomic co-ordinates, cell shapes and numbers of formula units in the cell. Even though knowledge of the space groups, molar volumes and energies of the structures provides hints on how to classify them, it is still a formidable task to sort through them manually. In recent years, ML-inspired approaches have been used for the classification and visualisation of atomic structures,24–28 but they have not been systematically exploited in the context of recognising the metastable polymorphs from RSS, especially for the purpose of determining the phase behaviour of crystalline systems. We have therefore developed and employed a ML-based method to compare and cluster the structures automatically. . The kernel function K(A,B) can be formulated as an inner product of the features of A and B,
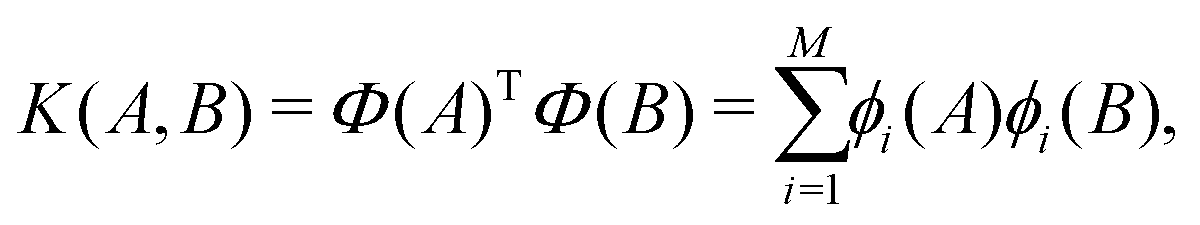 | (1) |
 that are centred on each atom n in the structure A. A straightforward way of obtaining these global fingerprints from the local ones is to take the average,26
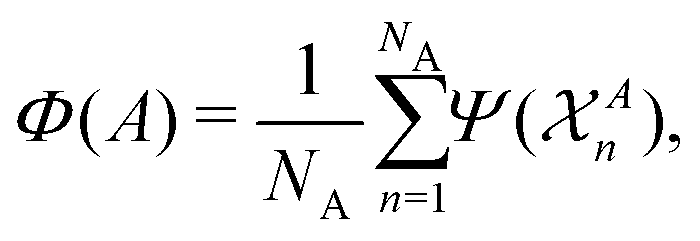 | (2) |
We employ the Smooth Overlap of Atomic Positions (SOAP) framework that was introduced in ref. 29 to construct the local fingerprints  . SOAP has been used together with Gaussian Process Regression in numerous applications, including metals, semiconductors, molecular crystals and small organic molecules,26,30–33 as well for structural identifications of bulk materials, including ice25,27 and TiO2.28 The SOAP representation is specific to atom species. For atoms of species α inside a local environment
  , it uses a smooth atomic density function
 | (3) |
 . The density
  is invariant to translations and permutations of identical atoms, but not to rotations. The SOAP representation addresses this by first expanding with a set of orthonormal basis functions on radial direction g(|r|) and spherical harmonics of angular directions
 ![[r with combining circumflex]](https://www.rsc.org/images/entities/i_char_0072_0302.gif) as
as | (4) |
 26,29
26,29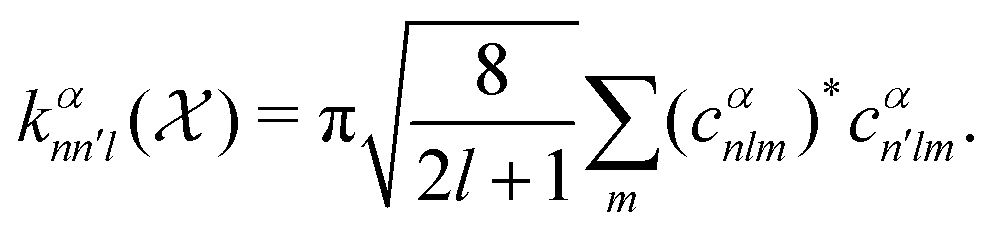 | (5) |
 constructed in this way up to certain cutoffs lmax and nmax can then be used as the local fingerprint
  in eqn (2), which in turn leads to the kernel matrix. In practice, we use the recently implemented DScribe Python package for constructing descriptors and kernels.34
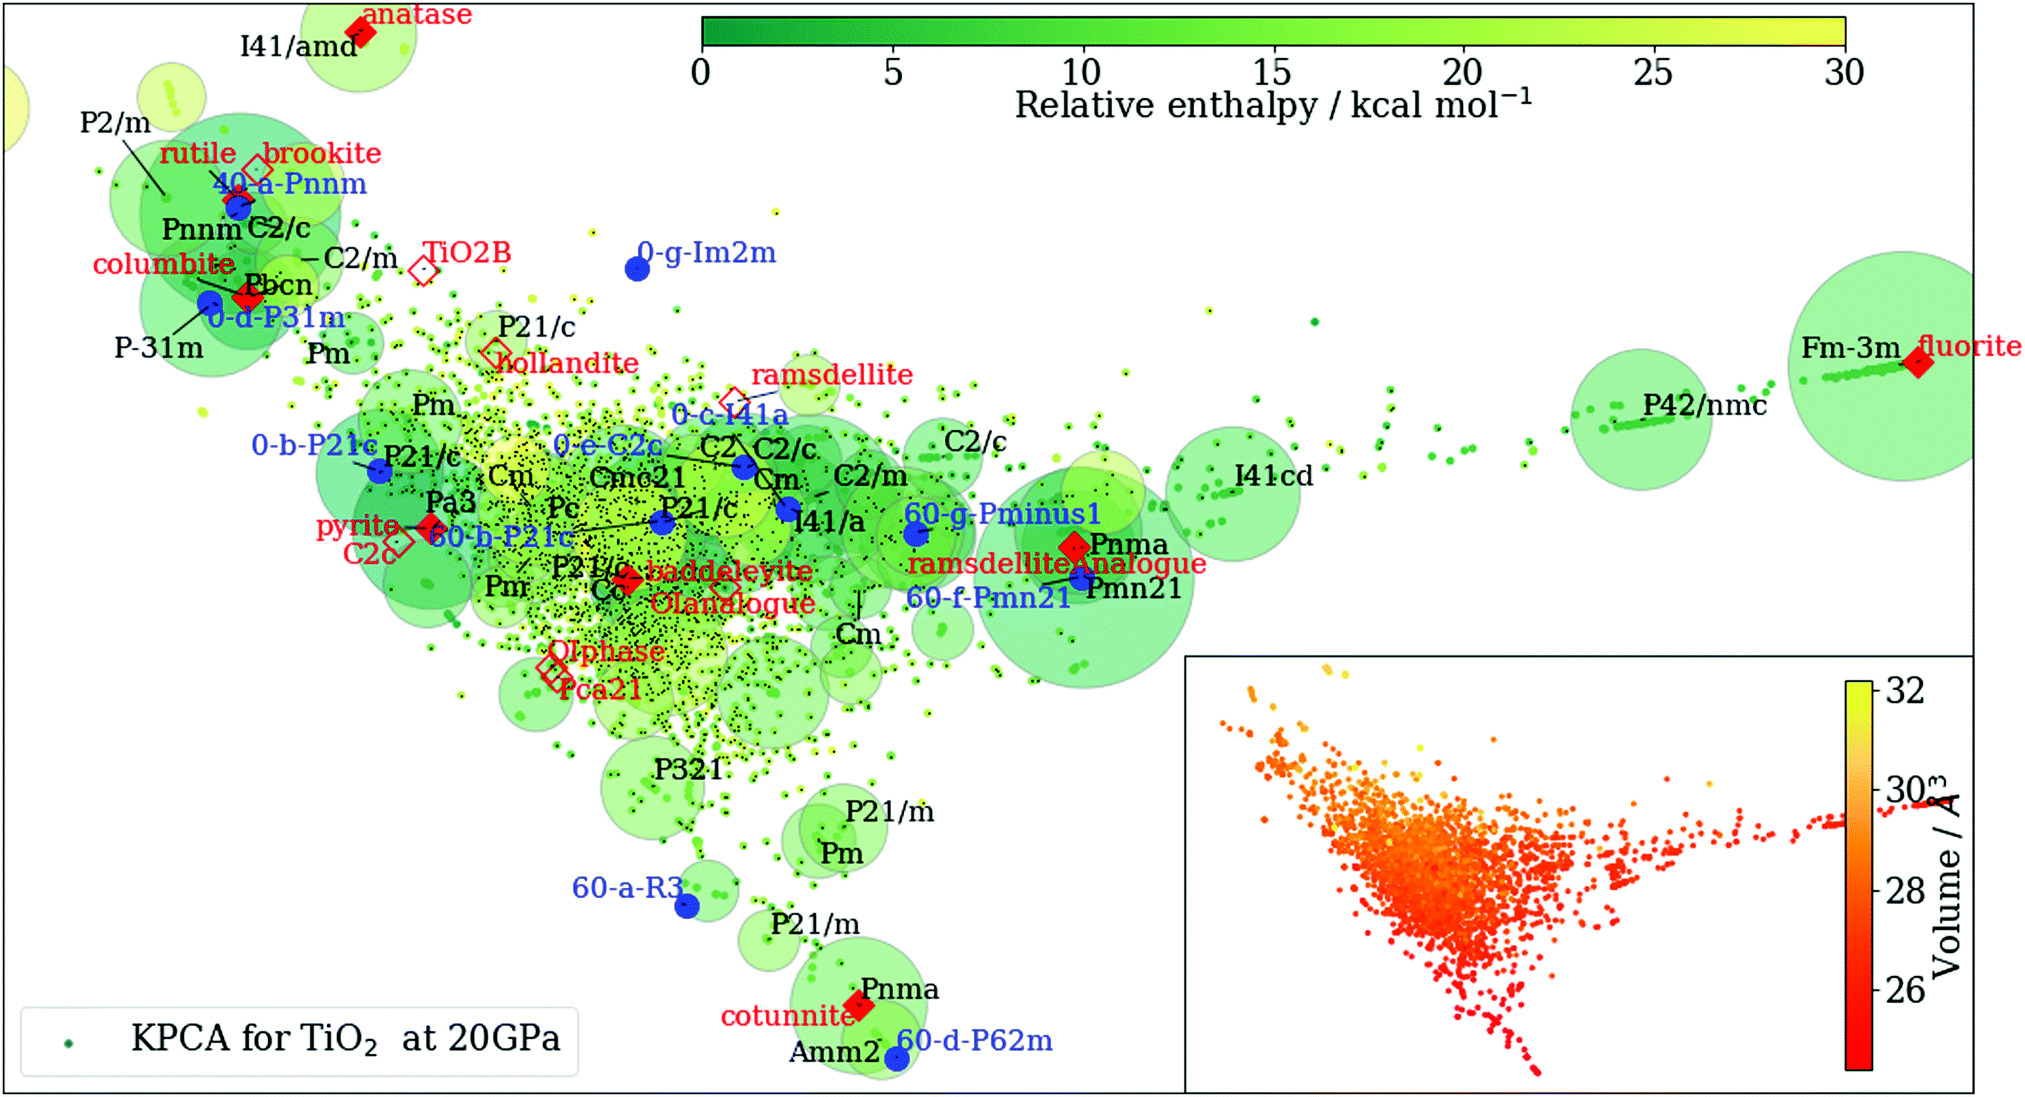 | ||
| Fig. 1 Output after KPCA and clustering analysis. The structures obtained from RSS at 20 GPa are projected onto the first two principal vectors of the kernel matrix {K(A,B)}. The known and new phases of TiO2 are indicated on the KPCA plot using solid markers if found during RSS, and hollow markers otherwise. The colours of the points in the main graph and the inset vary according to their enthalpy and volume per TiO2 formula unit, respectively. The area of each marker is proportional to the logarithm of the number of the structures in that cluster. | ||
As an example, in Fig. 1 we show such clustering results. Even though the information on space groups, molar volume and enthalpy is not explicitly included in the construction of the kernel matrix {K(A,B)}, this agnostic pattern recognition approach is able to group together structures with similar properties extremely well.
![[6 with combining macron]](https://www.rsc.org/images/entities/char_0036_0304.gif) 2m) is in fact the Fe2P phase of TiO2 that was previously considered at higher pressures than we have focused on here.11,37
2m and 60-e-P21/m have enthalpies very close to the ground-state phase of cotunnite at high pressures (P ≥ 40 GPa), and the 60-a-R
2m) is in fact the Fe2P phase of TiO2 that was previously considered at higher pressures than we have focused on here.11,37
2m and 60-e-P21/m have enthalpies very close to the ground-state phase of cotunnite at high pressures (P ≥ 40 GPa), and the 60-a-R![[3 with combining macron]](https://www.rsc.org/images/entities/char_0033_0304.gif) phase, which, as we discuss below, is particularly favoured for the MA potential, has an enthalpy only a few kcal mol−1 per formula unit larger than cotunnite. The difference in relative enthalpy between different levels of theory highlights the importance of capturing metastable phases, as in general the enthalpies predicted by empirical potentials or density-functional approximations may not be accurate enough to determine the true ground-state enthalpy.
phase, which, as we discuss below, is particularly favoured for the MA potential, has an enthalpy only a few kcal mol−1 per formula unit larger than cotunnite. The difference in relative enthalpy between different levels of theory highlights the importance of capturing metastable phases, as in general the enthalpies predicted by empirical potentials or density-functional approximations may not be accurate enough to determine the true ground-state enthalpy.
B. Approximation of entropy using frequency of appearance
In this section, we investigate whether it is possible to approximate the entropies of different phases solely from the information one can obtain from RSS. The RSS scheme, which involves performing energy minimisation of random structures, is rather similar to the direct enumeration method44 that can be used to find the basin of attraction of granular or glassy systems,44–46 although RSS is somewhat more complicated as variable cells with different numbers of atoms are used (see Methods). The entropy associated with the (dimensionless) volume v of a basin of attraction, S = kB![[thin space (1/6-em)]](https://www.rsc.org/images/entities/char_2009.gif) lnv, has been of considerable recent interest.47 It would therefore be intriguing to explore whether in this case, we can find an estimate for the basin volume and whether the corresponding basin entropy is related to the thermodynamic entropy that enters the Gibbs energy.
lnv, has been of considerable recent interest.47 It would therefore be intriguing to explore whether in this case, we can find an estimate for the basin volume and whether the corresponding basin entropy is related to the thermodynamic entropy that enters the Gibbs energy.
To estimate the entropy of the basin of the crystal structures found in RSS, we assume that (i) Sb of a crystal structure is extensive with respect to its system size, Sb = nsb, where n is the number of TiO2 formula units; and (ii) when performing energy minimisation with the same number of TiO2 formula units, nsb is proportional to the logarithm of the frequency of finding a certain crystal structure. With these strong assumptions, we are able to infer the relative basin entropy for each crystal structure considered. The value of sb obtained in this way depends on the frequency of occurrence of each structure for a given choice of n. However, for structures whose unit cells do not have compatible numbers of formula units, we can nevertheless infer the difference in sb between two such polymorphs provided that they are found in searches together with other structures that have a well-defined sb for both values of n.
To test our assumptions, and to compare the basin entropy sb of the crystal structures and the thermodynamic entropy S, we plot them against each other in Fig. 2. Given that the two sets of entropies were estimated using completely different approaches, it is remarkable how similar their spread is. The Pearson correlation coefficient (PCC) is estimated to be r ≈ 0.3, and the root mean squared error (RMSE) is 0.2kB. The value of the PCC may at first glance seem low, but note that the entropy difference between different phases of this system is itself relatively small, so even a rather small RMSE can significantly reduce the PCC. Moreover, we can notice that low enthalpy structures tend to have sb larger than S: low enthalpy phases are found more frequently in RSS than one might expect from their thermodynamic entropies. This may be because the way the initial structures are prepared and the subsequent enthalpy minimisation is performed during RSS can introduce a bias towards locating deeper minima, which is advantageous if one aims to find stable phases over high energy ones. The trend of finding more frequently the low enthalpy structures has been observed in a previous study that also involves sampling polymorphs of ionic solids.48 To achieve a better estimate of S, one can thus use a linear combination such as sb − aH, where a is a parameter to the fit aH + constant = sb − S over all data points. We show a comparison between this adjusted entropy sb − aH and S in Fig. S4 of the ESI,† which shows a much stronger correlation (r ≈ 0.7; see Section S4, ESI†). Of course, determining the value of a requires prior knowledge of S, so such a correction scheme is less useful in practice.
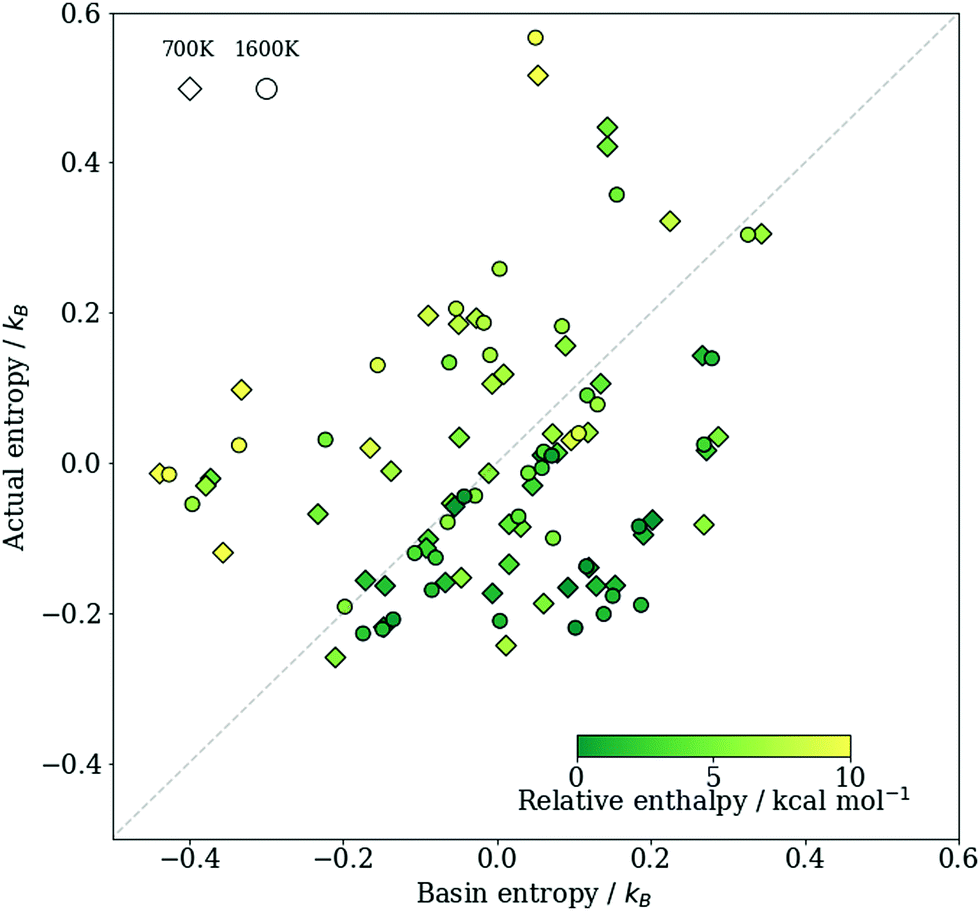 | ||
| Fig. 2 A comparison between the basin entropy sb = kBln(v)/n and the thermodynamic entropy S = (H − G)/T per formula unit of TiO2. Diamonds show results at 700 K and circles show results at 1600 K. Results obtained at all four pressures considered are all included, and the label of each point can be found in the ESI† (Fig. S4). Each data point is coloured according to the relative enthalpy of a structure compared to the ground state at the same pressure. As only the relative entropy under a given thermodynamic condition between different phases matters, we centred the data about the origin. | ||
Nevertheless, the results here demonstrate that the frequency of finding a structure in RSS does encode some information about its entropy. Furthermore, the correlation between sb − S and H means that the difference in sb is a better estimator of the actual entropy difference between structures with similar enthalpies than for pairs with large enthalpy differences. Since we are typically interested in phases in the vicinity of the most favourable structure, this may be sufficient.
In order to demonstrate the level of approximation one can achieve in estimating the free energy using only RSS results, whenever we discuss ML-based approximations of G, we use sb to estimate the true entropy. To obtain a more accurate estimate of S, one can use the harmonic approximation,6 or if resources allow, the TI method.6,8,9
C. Machine-learning prediction of enthalpy and entropy
As the number of local minima in the PES grows exponentially with increasing system size, it is difficult to ensure that all the important structures have been found during RSS. Indeed, not all the previously characterised or new structures of have been found at each pressure considered. There may also be situations where a certain crystal structure is known for an analogous system, but may not have been considered for the system of interest. In all such cases, we may wish to predict the enthalpies as well as the free energies of such structures. Of course, for a certain lattice arrangement, one can choose to perform energy minimisations and free-energy calculations, but it would be convenient to have a surrogate model that can quickly assess its enthalpy and basin entropy.We developed such an approximate model using the kernel ridge regression (KRR) approach. In the following, we only discuss estimating H; the estimation of Sb follows the same workflow. For a given pressure, an enthalpy estimate function defined on a given structure A is represented as a linear sum over kernel functions
 | (6) |
| wM = (KMM + KMNΛ−1KTMN)−1KMNΛ−1HN, | (7) |
We plot the predictions of the KRR model alongside values obtained in direct energy minimisation simulations in the ESI† [Fig. S2]. The agreement of the prediction with the calculated enthalpies is excellent, demonstrating that the ML model is able to capture the fundamentals of the interactions based on local environments, even though long-range coulombic terms are present in the empirical potential. The ML predictions for the basin entropy are less good, perhaps due to the intrinsic errors in the estimation of sb for systems of small sizes, or because descriptions of equilibrium configurations cannot fully capture the basin volume. We note that representations other than the average SOAP kernel used here, as well as a different choice of the regression, can also be used for the predictions.50–52
D. Phase behaviour and phase diagram estimation
In Fig. 3(a), we show chemical potentials (i.e. Gibbs energies per formula unit) computed using TI at a relatively high temperature of 1600 K. We chose this temperature because entropic effects have become important, but the majority of the phases of interest are still metastable across the pressure range considered.53 The baddeleyite phase and several of the newly considered phases [namely 0-c-I41/a, 0-e-C2/c, 60-c-Pc and 60-e-P21/m] do not appear in Fig. 3(a), because they are no longer metastable at such high temperatures. Baddeleyite, for example, spontaneously converts into pyrite at approximately 1150 K when heated at 20 GPa. One particularly interesting transition is that between rutile and the new phase 40-a-Pnnm (see ESI† (Fig. S1)), which are structurally particularly similar. The transition between them appears to be continuous as the system is pressurised: while the space group changes, there does not seem to be any change in density or enthalpy. In a sense, the 40-a-Pnnm polymorph is thus merely a high-pressure analogue of the rutile phase. Intriguingly, Fig. 3(a) shows a new phase, 60-a-R, is the most stable phase above ∼60 GPa, even though for some of this pressure regime, its enthalpy is not the lowest. This example highlights the importance of properly accounting for the entropy of the polymorphs. A number of other new phases also have free energies lower than some of the known structures of, demonstrating the power of the RSS approach in successfully locating possible candidate phases for consideration.
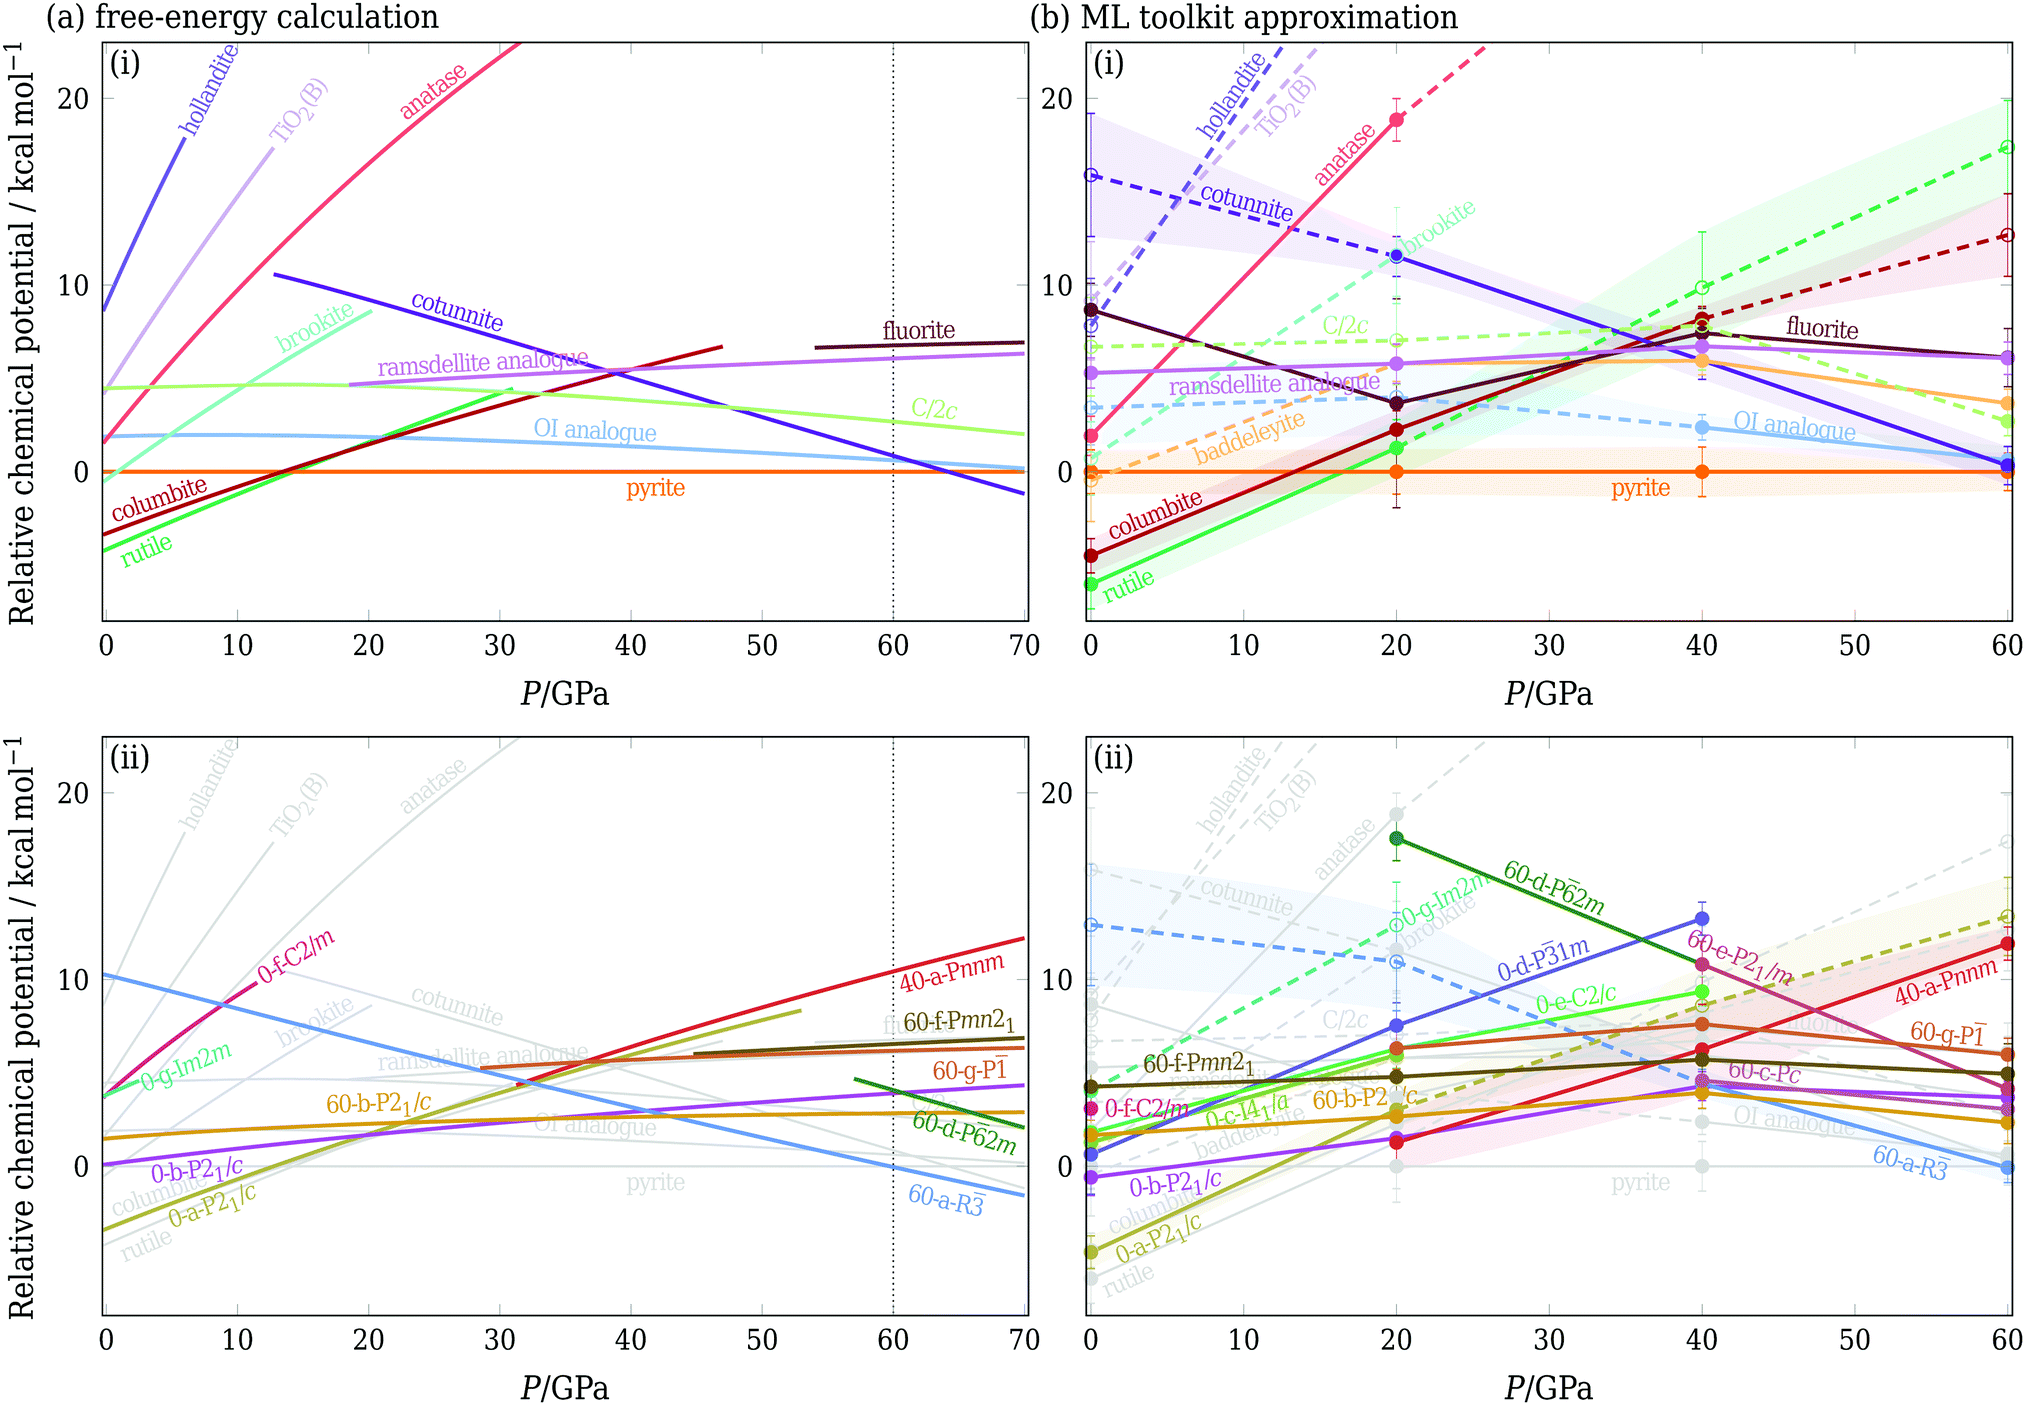 | ||
| Fig. 3 Chemical potential at 1600 K expressed per formula unit and relative to the pyrite phase. Left panel: Results obtained using free-energy calculations. Right panel: Predictions using solely data obtained from RSS. If a structure is found during RSS at a given pressure, solid lines show the approximate chemical potential based on its enthalpy and basin entropy. If a structure is not found, dashed lines indicate the machine-learning prediction as described in Section IIIC. In each case, in panel (i), only the previously known phases are shown, and in panel (ii), new phases obtained from RSS are shown, with the structures from panel (i) repeated in grey. In (b), the error bar of potentially competitive phases is shown as a coloured band, and where a phase was not obtained at a given pressure from a random search, the marker is hollow and connected to other points by a dashed line. Note that the pressure axis covers different ranges in (a) and (b); dotted lines in (a) indicate the range of panel (b). | ||
To circumvent extensive and laborious free-energy calculations, we can approximate the chemical potential using solely the data obtained from RSS. If a structure is found in RSS at a particular pressure, we use h(0 K) − Tsb to approximate its chemical potential, where h is the enthalpy per formula unit. For structures that are not found, we first use the ML schemes outlined in Section IIIC to estimate the enthalpy and basin entropy, and then estimate the chemical potential using the same expression. These chemical potentials are plotted in Fig. 3(b); phases found in RSS are indicated by solid lines and phases not found by dashed lines. As RSS was performed at four pressures, linear interpolations were used between the intervals. Alternatively, if one has data at only one pressure, a simple linear approximation G(P + ΔP) ≈ G(P) + ΔPV for extrapolation to nearby pressures can be considered.2
The agreement with the calculations of Fig. 3(a) is rather remarkable, with broad consistency of both the shape of the curves and the ordering of the structures (within error bars). In part, this is because of the excellent prediction of the enthalpy (ESI,† Fig. S2); in addition, we note that the approximate approach is also able to account for example for the fact that the OI phase has a low enthalpy, but a narrow basin of attraction, and becomes less favourable at sufficiently high temperatures.
We note that Fig. 3 encodes the information required for constructing phase diagrams: the phase with the lowest chemical potential at a given pressure is the most stable for this potential at this temperature, and the crossover of the chemical potential curves is a point of phase coexistence. Using either the full free-energy calculation approach or the ML-based approximation, we can repeat the procedure at several temperatures and can thus determine the phase diagram of this system [see ESI,† Fig. S7]. However, it ought to be borne in mind that a phase diagram hides much of the underlying thermodynamic behaviour, particularly for metastable phases, so the prediction of chemical potentials, as illustrated in Fig. 3(b), is thus a rather more rigorous test of the ML approach. Furthermore, since the free energies of many of the phases considered are similar to one another and many phases are metastable under certain conditions, predicting the metastabilities of all relevant polymorphs is particularly important.
IV. Conclusions
This paper presents a framework that uses a combination of ML methods to help extract information from random crystal structure searches. This framework allows automatic classification and characterisation of possible solid phases, as well as providing an estimate of the phase diagram and metastabilities of solid polymorphs. The framework does not use any prior knowledge of the phase behaviour of the system and instead relies only on data obtained directly from a random structure search. Starting from the thousands of structures obtained from RSS, we first employ a pattern recognition approach to cluster similar structures with little manual input. We then estimate the basin entropy of the crystal structures found by assuming that their basin of attraction is related to the number of times each structure is found. Moreover, we use a machine learning approach to predict the enthalpy of unknown structures based on ones that are observed. Combining all these, we can estimate the free energies of solid phases and hence the thermodynamic phase behaviour of a system of interest with relatively little computational effort.We tested the framework on the rather complicated system of TiO2 at ambient and high pressures. We predicted a number of possible phases and estimated their chemical potentials at finite temperatures. Even though we only explicitly showed the chemical potentials at a moderately high temperature, the framework that we present can be used for any reasonable temperature. Pair potentials similar to the ones used for our RSS are widely used for other binary oxides,54,55 so the new phases we found and the methodology introduced may be relevant to other oxides as well.
The methods we propose are transferable to other systems with many solid polymorphs, such as high-pressure solid hydrogen,56 perovskites,57 different phases of water-ice25 and molecular crystals.58 A useful strategy for predicting the phase diagram is first to use the framework to select competitive polymorphs using the data generated from crystal structure searches, and then to compute explicit free energies only of those phases. Such an approach would make the determination of phase behaviour of systems exhibiting many solid polymorphs using accurate free-energy calculations considerably more straightforward and computationally tractable.
Conflicts of interest
The authors declare no competing interests.Acknowledgements
We acknowledge fruitful discussions with Daan Frenkel. We thank Michele Ceriotti, Stephen J. Cox, Edgar Engel and Bonan Zhu for critically reading the manuscript and providing useful feedback. BC acknowledges funding from the Swiss National Science Foundation (Project P2ELP2-184408). AR and BC acknowledge resources provided by the Cambridge Tier-2 system operated by the University of Cambridge Research Computing Service funded by EPSRC Tier-2 capital grant EP/P020259/1. CJP acknowledges financial support from the Engineering and Physical Sciences Research Council [Grant EP/P022596/1] and a Royal Society Wolfson Research Merit award.References
- S. M. Woodley and R. Catlow, Crystal structure prediction from first principles, Nat. Mater., 2008, 7, 937–946 CrossRef CAS.
- C. J. Pickard and R. Needs, Ab initio random structure searching, J. Phys.: Condens. Matter, 2011, 23, 053201 CrossRef.
- Y. Wang, J. Lv, L. Zhu and Y. Ma, Crystal structure prediction via particle-swarm optimization, Phys. Rev. B: Condens. Matter Mater. Phys., 2010, 82, 094116 CrossRef.
- L. Filion, M. Marechal, B. van Oorschot, D. Pelt, F. Smallenburg and M. Dijkstra, Efficient method for predicting crystal structures at finite temperature: variable box shape simulations, Phys. Rev. Lett., 2009, 103, 188302 CrossRef PubMed.
- D. J. Wales and H. A. Scheraga, Global optimization of clusters, crystals, and biomolecules, Science, 1999, 285, 1368–1372 CrossRef CAS PubMed.
- B. Cheng and M. Ceriotti, Computing the absolute Gibbs free energy in atomistic simulations: applications to defects in solids, Phys. Rev. B, 2018, 97, 054102 CrossRef CAS.
- Z. Fu, Y. Liang, S. Wang and Z. Zhong, Structural phase transition and mechanical properties of TiO2 under high pressure, Phys. Status Solidi B, 2013, 250, 2206–2214 CAS.
- C. Vega, E. Sanz, J. L. F. Abascal and E. G. Noya, Determination of phase diagrams via computer simulation: methodology and applications to water, electrolytes and proteins, J. Phys.: Condens. Matter, 2008, 20, 153101 CrossRef.
- A. Reinhardt, Phase behavior of empirical potentials of titanium dioxide, J. Chem. Phys., 2019, 151, 064505 CrossRef.
- B. Monserrat, N. D. Drummond, P. Dalladay-Simpson, R. T. Howie, P. L. Ros, E. Gregoryanz, C. J. Pickard and R. J. Needs, Structure and metallicity of phase V of hydrogen, Phys. Rev. Lett., 2018, 120, 255701 CrossRef CAS PubMed.
- H. Dekura, T. Tsuchiya, Y. Kuwayama and J. Tsuchiya, Theoretical and experimental evidence for a new post-cotunnite phase of titanium dioxide with significant optical absorption, Phys. Rev. Lett., 2011, 107, 045701 CrossRef PubMed.
- L. S. Dubrovinsky, N. A. Dubrovinskaia, V. Swamy, J. Muscat, N. M. Harrison, R. Ahuja, B. Holm and B. Johansson, The hardest known oxide, Nature, 2001, 410, 653–654 CrossRef CAS.
- K. Mukai and I. Yamada, Columbite-type TiO2 as a negative electrode material for lithium-ion batteries, J. Electrochem. Soc., 2017, 164, A3590–A3594 CrossRef CAS.
- J. Staun Olsen, L. Gerward and J. Z. Jiang, On the rutile/-PbO2-type phase boundary of TiO2, J. Phys. Chem. Solids, 1999, 60, 229–233 CrossRef.
- M. Matsui and M. Akaogi, Molecular dynamics simulation of the structural and physical properties of the four polymorphs of TiO2, Mol. Simul., 1991, 6, 239–244 CrossRef.
- C. J. Pickard and R. J. Needs, High-pressure phases of silane, Phys. Rev. Lett., 2006, 97, 045504 CrossRef PubMed.
- C. J. Pickard and R. J. Needs, Ab initio random structure searching, J. Phys.: Condens. Matter, 2011, 23, 053201 CrossRef PubMed.
- S. Plimpton, Fast parallel algorithms for short-range molecular dynamics, J. Comput. Phys., 1995, 117, 1–19 CrossRef CAS.
- D. Frenkel and A. J. C. Ladd, New Monte Carlo method to compute the free energy of arbitrary solids. Application to the fcc and hcp phases of hard spheres, J. Chem. Phys., 1984, 81, 3188–3193 CrossRef CAS.
- R. O. Jones and O. Gunnarsson, The density functional formalism, its applications and prospects, Rev. Mod. Phys., 1989, 61, 689–746 CrossRef CAS.
- J. P. Perdew, K. Burke and M. Ernzerhof, Generalized gradient approximation made simple, Phys. Rev. Lett., 1996, 77, 3865–3868 CrossRef CAS PubMed.
- J. P. Perdew, A. Ruzsinszky, G. I. Csonka, O. A. Vydrov, G. E. Scuseria, L. A. Constantin, X. Zhou and K. Burke, Restoring the density-gradient expansion for exchange in solids and surfaces, Phys. Rev. Lett., 2008, 100, 136406 CrossRef PubMed.
- S. J. Clark, M. D. Segall, C. J. Pickard, P. J. Hasnip, M. I. Probert, K. Refson and M. C. Payne, First principles methods using CASTEP, Z. Kristallogr. Cryst. Mater., 2005, 220, 567–570 CAS.
- M. Ceriotti, G. A. Tribello and M. Parrinello, Simplifying the representation of complex free-energy landscapes using sketch-map, Proc. Natl. Acad. Sci. U. S. A., 2011, 108, 13023–13028 CrossRef CAS PubMed.
- E. A. Engel, A. Anelli, M. Ceriotti, C. J. Pickard and R. J. Needs, Mapping uncharted territory in ice from zeolite networks to ice structures, Nat. Commun., 2018, 9, 2173 CrossRef PubMed.
- S. De, A. P. Bartók, G. Csányi and M. Ceriotti, Comparing molecules and solids across structural and alchemical space, Phys. Chem. Chem. Phys., 2016, 18, 13754–13769 RSC.
- A. Anelli, E. A. Engel, C. J. Pickard and M. Ceriotti, Generalized convex hull construction for materials discovery, Phys. Rev. Mater., 2018, 2, 103804 CrossRef CAS.
- J. Mavračić, F. C. Mocanu, V. L. Deringer, G. Csányi and S. R. Elliott, Similarity between amorphous and crystalline phases: The case of TiO2, J. Phys. Chem. Lett., 2018, 9, 2985–2990 CrossRef PubMed.
- A. P. Bartók, R. Kondor and G. Csányi, On representing chemical environments, Phys. Rev. B: Condens. Matter Mater. Phys., 2013, 87, 184115 CrossRef.
- V. L. Deringer and G. Csányi, Machine learning based interatomic potential for amorphous carbon, Phys. Rev. B, 2017, 95, 094203 CrossRef.
- W. J. Szlachta, A. P. Bartók and G. Csányi, Accuracy and transferability of Gaussian approximation potential models for tungsten, Phys. Rev. B: Condens. Matter Mater. Phys., 2014, 90, 104108 CrossRef.
- A. P. Bartók, S. De, C. Poelking, N. Bernstein, J. Kermode, G. Csányi and M. Ceriotti, Machine learning unifies the modelling of materials and molecules, Sci. Adv., 2017, 3, e1701816 CrossRef PubMed.
- F. Musil, S. De, J. Yang, J. E. Campbell, G. M. Day and M. Ceriotti, Machine learning for the structure-energy-property landscapes of molecular crystals, Chem. Sci., 2018, 9, 1289–1300 RSC.
- L. Himanen, M. O. J. Jäger, E. V. Morooka, F. Federici Canova, Y. S. Ranawat, D. Z. Gao, P. Rinke and A. S. Foster, DScribe: library of descriptors for machine learning in materials science, Comput. Phys. Commun., 2020, 247, 106949, DOI:10.1016/j.cpc.2019.106949.
- B. Schölkopf, A. Smola and K.-R. Müller, Nonlinear component analysis as a kernel eigenvalue problem, Neural Comput., 1998, 10, 1299–1319 CrossRef.
- M. Ester, H.-P. Kriegel, J. Sander and X. Xu, A density-based algorithm for discovering clusters in large spatial databases with noise, in Proceedings of the Second International Conference on Knowledge Discovery and Data Mining, AAAI Press, 1996, pp. 226–231 Search PubMed.
- M. J. Lyle, C. J. Pickard and R. J. Needs, Prediction of 10-fold coordinated TiO2 and SiO2 structures at multimegabar pressures, Proc. Natl. Acad. Sci. U. S. A., 2015, 112, 6898–6901 CrossRef CAS PubMed.
- D. R. Collins and W. Smith, Evaluation of TiO2 force fields, Tech. Rep. DL-TR-96-001 (Council for the Central Laboratory of the Research Councils, 1996).
- V. Swamy, J. D. Gale and L. S. Dubrovinsky, Atomistic simulation of the crystal structures and bulk moduli of TiO2 polymorphs, J. Phys. Chem. Solids, 2001, 62, 887–895 CrossRef CAS.
- J. Trail, B. Monserrat, P. L. Ros, R. Maezono and R. J. Needs, Quantum Monte Carlo study of the energetics of the rutile, anatase, brookite, and columbite TiO2 polymorphs, Phys. Rev. B, 2017, 95, 121108 CrossRef.
- X. G. Ma, P. Liang, L. Miao, S. W. Bie, C. K. Zhang, L. Xu and J. J. Jiang, Pressure-induced phase transition and elastic properties of TiO2 polymorphs, Phys. Status Solidi B, 2009, 246, 2132–2139 CrossRef CAS.
- Z.-G. Mei, Y. Wang, S. Shang and Z.-K. Liu, First-principles study of the mechanical properties and phase stability of TiO2, Comput. Mater. Sci., 2014, 83, 114–119 CrossRef CAS.
- T. Zhu and S.-P. Gao, The stability, electronic structure, and optical property of TiO2 polymorphs, J. Phys. Chem. C, 2014, 118, 11385–11396 CrossRef CAS.
- N. Xu, J. Blawzdziewicz and C. S. O'Hern, Random close packing revisited: Ways to pack frictionless disks, Phys. Rev. E: Stat., Nonlinear, Soft Matter Phys., 2005, 71, 061306 CrossRef PubMed.
- D. Asenjo, F. Paillusson and D. Frenkel, Numerical calculation of granular entropy, Phys. Rev. Lett., 2014, 112, 098002 CrossRef PubMed.
- S. Martiniani, K. J. Schrenk, K. Ramola, B. Chakraborty and D. Frenkel, Numerical test of the Edwards conjecture shows that all packings are equally probable at jamming, Nat. Phys., 2017, 13, 848–851 Search PubMed.
- (a) S. Martiniani, K. J. Schrenk, J. D. Stevenson, D. J. Wales and D. Frenkel, Turning intractable counting into sampling: Computing the configurational entropy of three-dimensional jammed packings, Phys. Rev. E, 2016, 93, 012906 CrossRef PubMed; (b) A. Daza, A. Wagemakers, B. Georgeot, D. Guéry-Odelin and M. A. F. Sanjuán, Basin entropy: A new tool to analyze uncertainty in dynamical systems, Sci. Rep., 2016, 6, 31416 CrossRef CAS PubMed.
- V. Stevanović, Sampling polymorphs of ionic solids using random superlattices, Phys. Rev. Lett., 2016, 116, 075503 CrossRef PubMed.
- F. Musil, M. J. Willatt, M. A. Langovoy and M. Ceriotti, Fast and accurate uncertainty estimation in chemical machine learning, J. Chem. Theory Comput., 2019, 15, 906–915 CrossRef PubMed.
- F. A. Faber, L. Hutchison, B. Huang, J. Gilmer, S. S. Schoenholz, G. E. Dahl, O. Vinyals, S. Kearnes, P. F. Riley and O. A. Von Lilienfeld, Prediction errors of molecular machine learning models lower than hybrid DFT error, J. Chem. Theory Comput., 2017, 13, 5255–5264 CrossRef CAS PubMed.
- C. Chen, W. Ye, Y. Zuo, C. Zheng and S. P. Ong, Graph networks as a universal machine learning framework for molecules and crystals, Chem. Mater., 2019, 31, 3564–3572 CrossRef CAS.
- C. J. Bartel, S. L. Millican, A. M. Deml, J. R. Rumptz, W. Tumas, A. W. Weimer, S. Lany, V. Stevanović, C. B. Musgrave and A. M. Holder, Physical descriptor for the Gibbs energy of inorganic crystalline solids and temperature-dependent materials chemistry, Nat. Commun., 2018, 9, 4168, DOI:10.1038/s41467-018-06682-4.
- It should however be noted that at high temperatures, intrinsic defects may become important.59,60 Some defects, such as Frenkel-style interstitials, can be accounted for with our approach, but the most important defects in TiO2 include charge transfer and cannot be modelled with simple empirical potentials. Given the large typical free energies of defect formation of all main types even at such high temperatures,59 it is not likely that they would significantly change the phase behaviour; however, an investigation of this behaviour with more advanced potentials would be particularly interesting.
- G. V. Lewis and C. R. A. Catlow, Potential models for ionic oxides, J. Phys. C: Solid State Phys., 1985, 18, 1149–1161 CrossRef CAS.
- F. Shimojo, T. Okabe, F. Tachibana, M. Kobayashi and H. Okazaki, Molecular dynamics studies of yttria stabilized zirconia. I. Structure and oxygen diffusion, J. Phys. Soc. Jpn, 1992, 61, 2848–2857 CrossRef CAS.
- B. Cheng, G. Mazzola and M. Ceriotti, Evidence for supercritical behavior of high-pressure liquid hydrogen, 2019, arXiv preprint arXiv:1906.03341.
- M. Murakami, K. Hirose, K. Kawamura, N. Sata and Y. Ohishi, Post-perovskite phase transition in MgSiO3, Science, 2004, 304, 855–858 CrossRef CAS PubMed.
- G. J. O. Beran, Modeling polymorphic molecular crystals with electronic structure theory, Chem. Rev., 2016, 116, 5567–5613 CrossRef CAS PubMed.
- J. Nowotny, M. A. Alim, T. Bak, M. A. Idris, M. Ionescu, K. Prince, M. Z. Sahdan, K. Sopian, M. A. Mat Teridi and W. Sigmund, Defect chemistry and defect engineering of TiO2-based semiconductors for solar energy conversion, Chem. Soc. Rev., 2015, 44, 8424–8442 RSC.
- A. Sarkar and G. G. Khan, The formation and detection techniques of oxygen vacancies in titanium oxide-based nanostructures, Nanoscale, 2019, 11, 3414–3444 RSC.
Footnote |
| † Electronic supplementary information (ESI) available. See DOI: 10.1039/d0cp02513e |
| This journal is © the Owner Societies 2020 |