 Open Access Article
Creative Commons Attribution 3.0 Unported Licence
Heterostructures of skutterudites and germanium antimony tellurides – structure analysis and thermoelectric properties of bulk samples†
Felix
Fahrnbauer
a,
Stefan
Maier‡
b,
Martin
Grundei
b,
Nadja
Giesbrecht
b,
Markus
Nentwig
ab,
Tobias
Rosenthal
b,
Gerald
Wagner
a,
G. Jeffrey
Snyder
cd and
Oliver
Oeckler
*a
aInstitute for Mineralogy, Crystallography and Materials Science, Leipzig University, Scharnhorststr. 20, 04275 Leipzig, Germany. E-mail: oliver.oeckler@gmx.de
bDepartment of Chemistry, Ludwig Maximilian University, Butenandtstr. 5-13, 81377 Munich, Germany
cMaterials Science, California Institute of Technology, 1200 E. California Blvd., Pasadena, 91125 CA, USA
dDepartment of Materials Science and Engineering, Northwestern University, 2220 Campus Drive, Evanston, IL 60208-3109, USA
First published on 31st July 2015
Abstract
Heterostructures of germanium antimony tellurides with skutterudite-type precipitates are promising thermoelectric materials due to low thermal conductivity and multiple ways of tuning their electronic transport properties. Materials with the nominal composition [CoSb2(GeTe)0.5]x(GeTe)10.5Sb2Te3 (x = 0–2) contain nano- to microscale precipitates of skutterudite-type phases which are homogeneously distributed. Powder X-ray diffraction reveals that phase transitions of the germanium antimony telluride matrix depend on its GeTe content. These are typical for this class of materials; however, the phase transition temperatures are influenced by heterostructuring in a beneficial way, yielding a larger existence range of the intrinsically nanostructured pseudocubic structure of the matrix. Using microfocused synchrotron radiation in combination with crystallite pre-selection by means of electron microscopy, single crystals of the matrix as well as of the precipitates were examined. They show nano-domain twinning of the telluride matrix and a pronounced structure distortion in the precipitates caused by GeTe substitution. Thermoelectric figures of merit of 1.4 ± 0.3 at 450 °C are observed. In certain temperature ranges, heterostructuring involves an improvement of up to 30% compared to the homogeneous material.
Introduction
In the search for novel thermoelectric materials for application in waste-heat recovery, micro- and nanostructured composites have become a major field of research. In addition to doping experiments that aim at adjusting an optimal charge carrier concentration, domain boundaries efficiently reduce the phononic part κph of the thermal conductivity κ.1–3 This is favorable in terms of a high thermoelectric figure of merit ZT = σS2Tκ−1 (σ = electrical conductivity, S = Seebeck coefficient). While interfaces may efficiently scatter phonons, their impact on the charge carrier propagation is minimal when the domains are intergrown endotactically. This leads to the phonon glass electron crystal (PGEC) concept, which assumes a maximum ZT in materials with glass-like thermal conductivity in combination with a high charge carrier mobility. The latter is mainly determined by the slope of conduction bands, with flat bands leading to a low charge carrier mobility but a high Seebeck coefficient.4 Much research has focused on skutterudite-type CoSb3 (space group Im![[3 with combining macron]](https://www.rsc.org/images/entities/char_0033_0304.gif) ) as a PGEC material due to its favorable crystal structure. It can be considered a severely distorted ReO3 type with voids in the center of a (CoSb6/2)8 unit large enough for the incorporation of loosely bound “rattling” atoms. Unfilled and undoped CoSb3 suffers from its rather high thermal conductivity, which is around 10 W m−1 K−1 at room temperature (RT).5 Whereas void filling with various heavy atoms can significantly reduce κph,6–8 the electronic structure can be tuned by Sb substitution in the characteristic Sb4 units, for example by GeTe.9–11 Quenched germanium antimony tellurides (GST materials), on the other hand, exhibit a remarkably low thermal conductivity due to pronounced nanostructures. Upon slow cooling, their rocksalt-type high-temperature (HT) modification undergoes a phase transition to a trigonal layered one stable at RT.12,13 The layers are separated by van der Waals gaps, whereas vacancies in the cubic phase are randomly distributed on the cation position. When the HT phase is quenched, cation diffusion is limited, which leads to finite defect layers in a pseudocubic modification as found by high resolution transmission electron microscopy (HRTEM).14,15
) as a PGEC material due to its favorable crystal structure. It can be considered a severely distorted ReO3 type with voids in the center of a (CoSb6/2)8 unit large enough for the incorporation of loosely bound “rattling” atoms. Unfilled and undoped CoSb3 suffers from its rather high thermal conductivity, which is around 10 W m−1 K−1 at room temperature (RT).5 Whereas void filling with various heavy atoms can significantly reduce κph,6–8 the electronic structure can be tuned by Sb substitution in the characteristic Sb4 units, for example by GeTe.9–11 Quenched germanium antimony tellurides (GST materials), on the other hand, exhibit a remarkably low thermal conductivity due to pronounced nanostructures. Upon slow cooling, their rocksalt-type high-temperature (HT) modification undergoes a phase transition to a trigonal layered one stable at RT.12,13 The layers are separated by van der Waals gaps, whereas vacancies in the cubic phase are randomly distributed on the cation position. When the HT phase is quenched, cation diffusion is limited, which leads to finite defect layers in a pseudocubic modification as found by high resolution transmission electron microscopy (HRTEM).14,15
The thermoelectric properties of skutterudites can be improved by nanoscale heterostructuring, for example with precipitates of AgSbTe2.16 As this is unexpected in a classical mixture according to effective medium theory,17 this improvement is attributed to phonon scattering at nanoscale interfaces. In such heterogeneous systems, the transport properties need to be considered a combined result of the compounds present. Previous work aimed at decoupling the interdependent Seebeck coefficient and electrical conductivity. Thus a simultaneous increase of both properties may be feasible by a high charge carrier mobility in combination with interface energy filtering.16 To that effect, a combination of skutterudites with GST materials is intriguing as both exhibit promising thermoelectric properties; and similar atom environments in both compounds might lead to endotactic intergrowth.
Experimental procedure
Synthesis
All syntheses started from stoichiometric quaternary melts of the pure elements Co (99.995%, Sigma Aldrich), Sb (99.9999%, Smart Elements), Ge (99.999%, Smart Elements) and Te (puriss., VEB Spurenmetalle Freiberg and 99.999%, Alfa Aesar) in sealed silica glass ampoules under a dry Ar atmosphere. The samples were quenched after at least 2 h at 950 °C and subsequently annealed at 590 °C (0.5–4 h) or at 530 °C (64.5 h), followed again by quenching. Quenching rates were approximately 10 K s−1. Detailed information on the thermal treatment of the individual samples is given in the ESI† (Table S1). Disc-shaped samples for thermoelectric characterization were obtained by using flat-bottomed silica glass ampoules. The ingots were polished using SiC grinding powder and sawn by a diamond wire saw when cuboid samples were necessary.Analytical methods
The morphology and composition of the samples were examined by means of scanning electron microscopy (SEM) and energy-dispersive X-ray spectroscopy (EDX) using a Zeiss LEO 1530 microscope (acceleration voltage 20 kV) equipped with an EDX detector (INCA system, Oxford Instruments). The phase composition was assessed by powder X-ray diffraction (PXRD) using a Huber G670 diffractometer (Guinier geometry with imaging-plate detector, Ge(111) monochromator) with Cu-Kα1 radiation (λ = 1.54051 Å) for RT measurements and a similar instrument with Mo-Kα1 radiation (λ = 0.71073 Å) for temperature-dependent measurements. RT diffraction patterns were obtained from crushed samples on flat specimen holders; for temperature-dependent measurements, samples in glass capillaries under dry Ar were rotated in a ceramic heating cradle (direct heat transfer).Finely ground samples on copper grids coated with a holey carbon film as well as polished slabs of samples dimpled and thinned using Ar-ions (Duo-Mill, GATAN) were used for transmission electron microscopy (TEM). Selected area electron diffraction (SAED), high-resolution transmission electron microscopy (HRTEM) and scanning transmission electron microscopy (STEM) were done on a Titan 80-300 (FEI, field emission gun, voltage 300 kV) with a TEMTOPS 30 EDX spectrometer (EDAX) and on a Philips CM-200 (LaB6 cathode, 200 kV, super-twin lens) with an R-TEM 136-5 EDX detector (EDAX).
Single-crystal structure elucidation was done by microfocus synchrotron diffraction (beamline ID11, ESRF, Grenoble)18 on a Huber diffractometer with a FReLoN2K CCD detector (dynamical range 216) as detailed below.19 The approximate beam size was 700 nm × 1.5 μm (λ = 0.2946 Å ![[= with combining circumflex]](https://www.rsc.org/images/entities/char_003d_0302.gif) 42.1 keV). Further details of the crystal structure investigations may be obtained from the Fachinformationszentrum Karlsruhe, 76344 Eggenstein-Leopoldshafen, Germany (fax: (+49) 7247-808-666; e-mail: E-mail: crysdata@fiz-karlsruhe.de) on quoting the deposition numbers CSD 429336 and 429337.
42.1 keV). Further details of the crystal structure investigations may be obtained from the Fachinformationszentrum Karlsruhe, 76344 Eggenstein-Leopoldshafen, Germany (fax: (+49) 7247-808-666; e-mail: E-mail: crysdata@fiz-karlsruhe.de) on quoting the deposition numbers CSD 429336 and 429337.
Thermal diffusivities were measured in Ar flow using an LFA457 MicroFlash (Netzsch) with an InSb detector. A Cowan heat loss correction was applied.20 Additional diffusivity measurements were performed under He atmosphere with a Linseis LFA1000 equipped with an InSb detector using the Dusza model for simultaneous heat loss and finite pulse corrections.21 The thermal conductivity κ was calculated as the product of the thermal diffusivity, the density (derived by the weight and the volume determined by Archimedes' principle or measuring the dimensions of the sample) and the Dulong–Petit heat capacity. All values were averaged from 5 measurement points at each temperature and linearly interpolated. The electrical conductivity and the Seebeck coefficient S were simultaneously measured under a He atmosphere with a Linseis LSR-3 instrument equipped with NiCr/Ni and Ni contacts. For measurements of S, the polarity of the thermocouples was continuously reversed (bipolar setup). Further measurements of the electrical conductivity and Hall coefficient (RH) measurements were done on an in-house built facility using the van der Pauw method in a reversible magnetic field up to 2 T.22 The Hall carrier density nH was obtained according to nH = 1/eRH, where e is the electron charge. Additional S measurements were obtained using W-Nb thermocouples. Calculated ZT values are assumed to exhibit an absolute uncertainty of 20%.23 For detailed information on the devices used for each sample cf. Table S1 in the ESI.†
All computer programs and databases used are given in Section I of the ESI,† including the respective references.
Results
Chemical and phase analysis
All investigated samples quenched from quaternary Co/Ge/Sb/Te melts do not contain skutterudite-type phases, but different cobalt germanides and elemental cobalt as side-phases (cf. Fig. S3 in ESI†). Thus, they were annealed at 530–590 °C, i.e. in the existence range of the rocksalt-type HT modification of GST. Subsequent quenching yields skutterudite-type precipitates, whose size strongly depends on the annealing time. Average sizes of 1 μm or less were found when the samples were annealed for 30 min, whereas sizes of 2–5 μm were predominant for longer annealing times. However, the dependence of the precipitate size on the annealing temperature is not particularly pronounced. In order to avoid nanoscopic precipitates for the reliable determination of the phase composition by Rietveld refinement, the samples discussed in this section were annealed for 4 h. In all samples, Sb in the skutterudite types turned out to be partially substituted by GeTe, with the substitution degree depending on the GeTe content of the starting material. Especially for relatively large phase fractions of skutterudite-type compounds, this substitution needs to be taken into account in the starting composition in order to avoid the precipitation of elemental Ge. Although the degree of substitution is slightly varying, a substitution of 1/3 of Sb in CoSb3 by GeTe proved to be a good starting point for most sample compositions. Thus, [CoSb2(GeTe)0.5]x(GeTe)nSb2Te3 is a reasonable nominal formula as in an alloy-like formula [CoSb2(GeTe)0.5]x[(GeTe)nSb2Te3]1−x, x would still not be a measure of the skutterudite-type fraction as the amount of GST phase is also determined by n. The skutterudite-type fraction is best quantified via the overall Co content. The variation of n yields matrix phases with the 9P-(GeTe)2Sb2Te3 type for n = 2, whereas the (pseudo-)cubic modification is present in quenched samples with higher n. Values of n ≥ 15 yield trigonal matrix phases whose average structures correspond to the GeTe type.13,24 Mixtures of different matrix phases such as 9P-(GeTe)2Sb2Te3 and the rocksalt-type modification occur for intermediate compositions (e.g. with n = 5). Quantitative phase analyses for a series of these samples with an approximately constant fraction of the skutterudite-type phase are shown in Fig. 1. The GeTe content of the precipitates was determined from the lattice parameters of the skutterudite-type phase, based on the fact that the solid solution series CoSb3–CoGe1.5Te1.5 obeys Vegard's law.9 Reference samples of CoSb3 and CoSb2.5(GeTe)0.25 were synthesized and yielded lattice parameters that are in good agreement with the published ones. Thus, site occupancies (i.e. the degree of substitution) from ref. 9 were used and not refined. The refined phase fractions are slightly lower than the expected 12.9 wt%. These deviations can be attributed to the imprecision of the method. By means of EDX, no incorporation of Co into the matrix could be detected and its composition did not deviate from the nominal composition. As no shift of the matrix' lattice parameters was observed, the composition of the matrix was not refined but constrained to the one assumed in the nominal composition of the starting material. Obviously, the bias with respect to the slightly varying GeTe content of the precipitates is negligible. Further refinements including samples with a GeTe-type GST main phase as well as with a homogeneous 9P-Pb2Sb2Se5-type25 matrix are given in the ESI† (Fig. S1). An increase of the nominal skutterudite-type fraction beyond ≈ 15% yields side-phases such as cobalt germanides or elemental Co.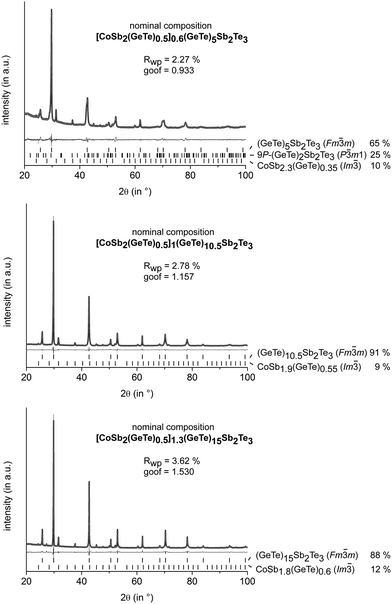 | ||
Fig. 1 PXRD patterns of different GST materials with skutterudite-type precipitates: experimental (black), calculated (light gray) and difference (dark gray) profiles; reflection positions are indicated as vertical lines; residuals and calculated phase fractions (weight%) are given; structure models taken from ref. 26 (P![[3 with combining macron]](https://www.rsc.org/images/entities/char_0033_0304.gif) m1), 27 (Fm m1), 27 (Fm![[3 with combining macron]](https://www.rsc.org/images/entities/char_0033_0304.gif) m) and 28 (Im m) and 28 (Im![[3 with combining macron]](https://www.rsc.org/images/entities/char_0033_0304.gif) ); anisotropic peak broadening fitted using Stephens' model.29 ); anisotropic peak broadening fitted using Stephens' model.29 | ||
Temperature-dependent behavior
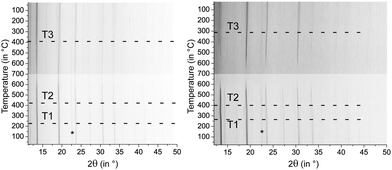
Samples of (GeTe)10.5Sb2Te3 quenched after 0.5 h at 590 °C exhibit cubic metrics. Temperature-dependent powder X-ray diffraction patterns show that upon heating a slight structure distortion towards a modification with a trigonal average structure sets in at ∼220 °C (T1 in Fig. 2), which explains the reflection broadening observed. At ∼425 °C (T2), the reflections become sharper again due to the phase transition to a rocksalt-type HT phase. Upon slow cooling, the reflection broadening sets in at ∼400 °C (T3). The phase transition at T1 is irreversible, thus no cubic phase is present at lower temperatures. In [CoSb2(GeTe)0.5]1(GeTe)10.5Sb2Te3, the same phase transitions were found, but T1 is shifted towards higher temperatures (∼275 °C) which leads to a narrower existence range of the trigonal modification. This impact of the precipitates on the phase transition temperatures of the matrix is possibly due to the additional domain boundaries which hinder cation diffusion.Analysis of the micro-/nanostructure
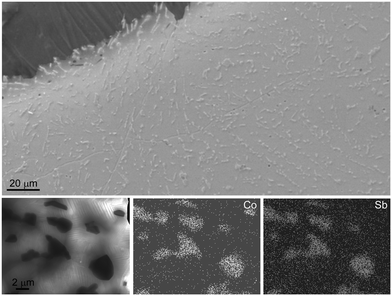
The particle size and distribution within the matrix were determined using SEM and STEM. A representative secondary electron image of a quenched and annealed (590 °C, 4 h) sample with the nominal composition [CoSb2(GeTe)0.5]1(GeTe)10.5Sb2Te3 as well as the STEM-EDX results are depicted in Fig. 3. The homogeneously distributed precipitates are 1–2 μm in size. Ge and Te are found in all regions of the sample, which confirms the Sb substitution in the skutterudite type as observed by the shift of the reflections in the PXRD patterns. Point EDX measurements agree well with the nominal composition (the complete EDX mapping as well point measurement results are given in Fig. S4 and Table S2 in the ESI†). The coincidence of the 〈110〉* direction of CoSb1.6(GeTe)0.7 and the 〈100〉* direction (indexing according to cubic metrics) of the matrix as observed for some crystallites hints at endotactic intergrowth (see Fig. S5 and S6 in the ESI†). However, as the lattice parameters and thus the common atomic distances vary with the GeTe content n of the GST phase as well as with the Sb substitution degree in the skutterudite-type phase, no oriented intergrowth was found in general.SEM imaging revealed no significant porosity, neither of quenched samples (see the image of polished ingot in Fig. 3), nor after several heating cycles. There are no pronounced changes in the microstructure upon such a thermal treatment. Although the materials are heterogeneous, the high density of the compact samples indicates that the transport properties discussed below are not considerably affected by extrinsic effects such as pores. The theoretical densities (weighted average of the components) vary from 6.252 g cm−3 for pure (GeTe)10.5Sb2Te3 to 6.477 g cm−3 for [CoSb2(GeTe)0.5]2(GeTe)10.5Sb2Te3, and typical measured values are >95% of the latter.
Structure elucidation
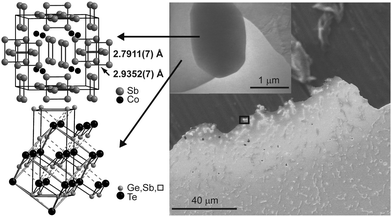
Due to the heterogeneity of the material as well as the microscale size of the precipitates, conventional X-ray methods are not suitable for structure elucidation. Thus, a discrete skutterudite-type crystallite in a polished and thinned slab cut from an ingot was selected by means of TEM. The type and composition of the precipitate and the surrounding matrix were confirmed by SAED and EDX. This crystallite was optically re-located at the European Synchrotron Radiation Facility (ESRF) and centered by means of fluorescence scans for Co, Sb and Te (for a detailed description of this procedure, see ref. 30). Single-crystal datasets of the precipitates as well as the surrounding matrix were collected using a 700 nm × 1.5 μm beam. The results of the structure refinements are given in Table 1 and Tables S4–S7 (ESI†). In the skutterudite-type precipitates, the characteristic Sb4 units (highlighted in Fig. 4) are more distorted than in CoSb3. Two types of bonds can be distinguished, which both are shorter than in CoSb3 (cf.Fig. 4: 2.7911(7) vs. 2.8947 Å and 2.9352(7) Å vs. 2.9796 Å, ratio 0.95![[thin space (1/6-em)]](https://www.rsc.org/images/entities/char_2009.gif) :
:![[thin space (1/6-em)]](https://www.rsc.org/images/entities/char_2009.gif) 1 vs. 0.97
1 vs. 0.97![[thin space (1/6-em)]](https://www.rsc.org/images/entities/char_2009.gif) :
:![[thin space (1/6-em)]](https://www.rsc.org/images/entities/char_2009.gif) 1). This distortion corresponds to the Sb substitution by GeTe (as also indicated by shifted reflection positions in powder diffraction patterns, see above) due to the smaller atomic radii of Ge and Te (1.25 and 1.40 Å vs. 1.45 Å for Sb)31 and has a significant influence on the band structure.32,33 No residual electron density was found in the voids, thus no significant void filling by Te or Ge is present.
1). This distortion corresponds to the Sb substitution by GeTe (as also indicated by shifted reflection positions in powder diffraction patterns, see above) due to the smaller atomic radii of Ge and Te (1.25 and 1.40 Å vs. 1.45 Å for Sb)31 and has a significant influence on the band structure.32,33 No residual electron density was found in the voids, thus no significant void filling by Te or Ge is present.
| Formula | CoSb1.53(9)(GeTe)0.74(5) | Ge0.77Sb0.15Te1 = (GeTe)10.3Sb2Te3a |
|---|---|---|
| a Fixed composition from SEM point measurements (cf. Table S2 in the ESI). b Transformation matrix from the rocksalt-type setting to one rhombohedral individual: (0.5 0 −0.5|−0.5 0.5 0|1 1 1), and equivalents. c All reflections observed. | ||
| Formula mass (g mol−1) | 393.6 | 202.2 |
| Crystal system/space group (no.) | Cubic/Im![[3 with combining macron]](https://www.rsc.org/images/entities/char_0033_0304.gif) (204) (204) |
Trigonal/R3m (160) |
| Cell parameters (in Å) | a = 8.9166(3) | a = 4.2348(11) |
| c = 10.373(3) | ||
| Cell volume (in Å3) | 708.93(6) | 161.10(11) |
| X-ray density (in g cm−3) | 7.375 | 6.252 |
| Formula units (per unit cell) | 8 | 3 |
| F(000) | 1338.2 | 253.4 |
| Wavelength (in Å), energy (in keV) | 0.29460, 42.1 | |
| d min (in Å) | 0.50 | 0.55 |
| Absorption coefficient (in mm−1) | 10.27 | 9.05 |
| Absorption correction | Semiempirical (SADABS)36 | |
| Reflections measured/independent | 4064/562 | 871/138 |
| R int/Rσ | 0.0521/0.0334 | 0.0797 |
| Parameters/restraints | 10/0 | 9/0 |
| Twin fractions | — | 0.213(18), 0.252(13), 0.254(13), 0.281b |
| R 1 [I > 2σ(I)]/(all data) | 0.0353/0.0475 | 0.0314/0.0314c |
| wR2 [I > 2σ(I)]/(all data) | 0.0804/0.0827 | 0.0885/0.0885c |
| GooF | 1.202 | 1.055 |
| Δρ (min/max, in e Å−3) | −2.36/2.75 | −0.84/0.90 |
While the PXRD pattern shows pronounced rhombohedral reflection splitting of the matrix (cf. Fig. S2 in the ESI†), the region analyzed with microfocused synchrotron radiation seemed to be very close to cubic metrics. This is due to twinning of rhombohedral crystals whose reflection positions correspond to averaged superimposed groups of reflections according to a symmetry reduction from Fm![[3 with combining macron]](https://www.rsc.org/images/entities/char_0033_0304.gif) m to R
m to R![[3 with combining macron]](https://www.rsc.org/images/entities/char_0033_0304.gif) m (a translationengleiche subgroup of index 4). A further translationengleiche reduction (index 2) leads to the GeTe-type (R3m) as confirmed by refinements that showed a pronounced distortion of the GeTe-type layers along the cubic 〈111〉 direction. The deviation of the cations' z parameter from zero on the Wyckoff position 3a: 0, 0, 0.0203(12) is significant by more than 10σ. Thus, pseudomerohedral fourfold twinning was taken into account while a possible additional inversion twinning in the polar space group R3m was neglected as it did not change the structure model but rendered the refinement unstable. This twinning is typical for germanium antimony tellurides and was found to play an important role in their phase transition behavior by inducing stress and strain, especially in small crystallites.34,35
m (a translationengleiche subgroup of index 4). A further translationengleiche reduction (index 2) leads to the GeTe-type (R3m) as confirmed by refinements that showed a pronounced distortion of the GeTe-type layers along the cubic 〈111〉 direction. The deviation of the cations' z parameter from zero on the Wyckoff position 3a: 0, 0, 0.0203(12) is significant by more than 10σ. Thus, pseudomerohedral fourfold twinning was taken into account while a possible additional inversion twinning in the polar space group R3m was neglected as it did not change the structure model but rendered the refinement unstable. This twinning is typical for germanium antimony tellurides and was found to play an important role in their phase transition behavior by inducing stress and strain, especially in small crystallites.34,35
Thermoelectric properties
The characteristic phase transitions of GST materials lead to a pronounced discrepancy of the thermoelectric properties between the first and the following heating curves. Fig. 5 shows the results of the first measurement cycles of the Seebeck coefficient and the electrical conductivity for (GeTe)10.5Sb2Te3 in comparison to [CoSb2(GeTe)0.5]0.5(GeTe)10.5Sb2Te3. Upon heating the quenched material, extrema around 250 °C can be correlated with T1 in Fig. 2 and are attributed to the transition of the metastable quenched GST phase to the stable trigonal layered one. The higher phase transition temperature of the heterostructured sample is in good agreement with temperature-dependent PXRD measurements (see above). Above 400 °C, the transition to the rocksalt-type HT modification (T2 in Fig. 2) also influences the charge transport as indicated by the changing slope of the measurement curves (Fig. 5). Upon cooling, the layered phase is re-formed but no phase transition back to a (pseudo-) cubic modification is observed.37,38 Thus, the cooling curve as well as the following measurement cycles show only the transition trigonal-cubic (heating) and cubic-trigonal (cooling). This reversible structural process results in a reproducible hysteresis of each heating and cooling curve, except the first heating curve of quenched samples. The following discussion thus focusses on cooling curves, which do not significantly change during consecutive cycles. The corresponding heating curves (except the very first one) show the same trends. Selected plots for consecutive measurement cycles are given in Fig. S7 in the ESI.†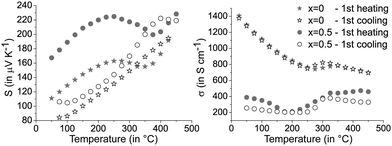 | ||
| Fig. 5 Seebeck coefficients S (left) and electrical conductivities σ (right) of [CoSb2(GeTe)0.5]x(GeTe)10.5Sb2Te3 with x = 0 and 0.5; first heating and subsequent slow cooling of quenched samples. | ||
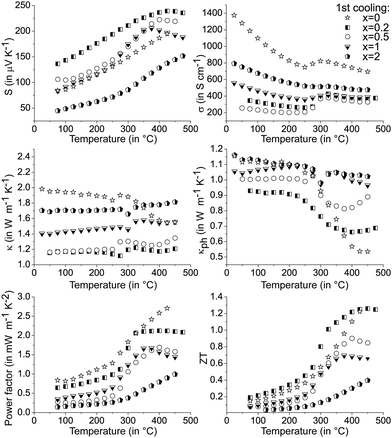
The precipitation of CoSb2(GeTe)0.5 in (GeTe)10.5Sb2Te3 leads to significantly higher Seebeck coefficients and lower electrical conductivities (cf.Fig. 6) than those of pure (GeTe)10.5Sb2Te3. This effect is most pronounced for rather low fractions of CoSb2(GeTe)0.5. As a result, the power factor S2σ of [CoSb2(GeTe)0.5]0.2(GeTe)10.5Sb2Te3 is comparable to the one found for (GeTe)10.5Sb2Te3. An increase of the precipitate content leads to electrical conductivities approaching the values of pure (GeTe)10.5Sb2Te3, but this effect is over-compensated by a simultaneous decrease of the Seebeck coefficient, which leads to power factors lower than those of (GeTe)10.5Sb2Te3.
In several (but not all) Seebeck coefficient curves, broad maxima could indicate the activation of minority carriers. Nevertheless, changes in the defect content as a consequence of phase transitions are also likely to influence the Seebeck coefficient via changes in the charge carrier concentration (as evident from Hall measurements, see below). As a tendency, these maxima are found at lower temperatures for higher precipitate contents, e.g., they shift from ∼425 °C for [CoSb2(GeTe)0.5]0.2(GeTe)10.5Sb2Te3 to ∼375 °C for [CoSb2(GeTe)0.5]1(GeTe)10.5Sb2Te3. The thermal band gap (Eg) as very roughly determined from the maximum Seebeck coefficients using the Goldsmid–Sharp relation39Smax ≈ Eg/2eTmax (with the elementary charge e) amounts to ∼0.3 eV. There is no such Seebeck maximum for [CoSb2(GeTe)0.5]2(GeTe)10.5Sb2Te3 and (GeTe)10.5Sb2Te3 itself. Differences between pure (GeTe)10.5Sb2Te3 and the heterostructured samples might be due to slight Co doping in the matrix of the heterostructured materials below the detection limit of EDX analysis.
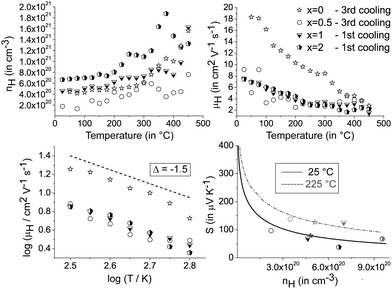
These findings motivate a closer look on the electrical transport properties of heterostructured [CoSb2(GeTe)0.5]x(GeTe)10.5Sb2Te3 materials. All samples exhibit p-type Hall carrier concentrations of 1020–1021 h+ cm−3, which are in the range of typical heavily doped semiconductors. In Fig. 7, the data of the Hall mobility are smoothed using a Savitzky–Golay filter, while the original data show some scattering due to contact resistances in the van der Pauw setup (a plot of the raw data is given in the ESI†). In all samples, the Hall mobility decrease with temperature approximately follows a T−3/2 relationship. This behavior implies that acoustic phonons are the primary scattering source that limits the charge carrier mobility. As a consequence, the single parabolic band (SPB) model with the acoustic phonon scattering approximation is applicable in the temperature range with an approximately linear increase of the Seebeck coefficient and electrical resistivity, i.e. up to 250 °C. The effective charge carrier mass m* is determined by the measured Hall carrier density nH = nc/rH (assuming a spherical Fermi surface, nc = chemical carrier concentration, rH = calculated Hall factor) using
| nc = 4π(2m*kBT/h2)3/2F1/2(η) |
| rH = 3F1/2(η)F−1/2(η)/4F0(η)2 |
| S = kB/e(2F1(η)/F0(η) − η). |
The Fermi integrals Fx(η) are
| Fx(η) = ∫fεxdε = ∫εxdε/(1 + exp[ε − η]). |
Fig. 7 also shows the Seebeck coefficient as a function of the Hall carrier concentration (Pisarenko plot) as calculated from the measured Hall mobility and Seebeck values of (GeTe)10.5Sb2Te3 using the SPB model. The effective masses used are 2.5me for the 25 °C plot and 2.75me for the 225 °C plot, respectively, as calculated using S and nH measured for the sample with x = 0. As is typical for single parabolic band behavior, the measured Seebeck coefficients for heterostructured [CoSb2(GeTe)0.5]x(GeTe)10.5Sb2Te3 samples are slightly lower than the calculated ones.40 The lower charge carrier mobilities for heterostructured materials up to 375 °C are in accordance with the higher Seebeck coefficients and the lower electrical conductivities in comparison to pure (GeTe)10.5Sb2Te3.
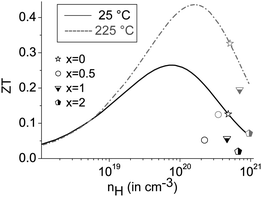
The mobility curves of samples with and without precipitates meet at 375 °C; however, in most heterostructured materials, lower charge carrier concentrations yield lower electrical conductivities than in (GeTe)10.5Sb2Te3. For example, the charge carrier concentration of [CoSb2(GeTe)0.5]0.5(GeTe)10.5Sb2Te3 is roughly half that of (GeTe)10.5Sb2Te3, but more skutterudite-type precipitates lead to an increase of the charge carrier concentration. Note that minority carrier transport sets in above ∼250 °C. The Hall factor thus consists of contributions of both carrier types at elevated temperatures, which were not investigated in detail. In order to determine the ideal charge carrier concentration, the maximum ZT with respect to the Hall carrier concentration was modelled (cf.Fig. 8) under the assumption of SPB behavior using
| ZT = S2/(L + (ψβ)−1) |
| β = μ0(m*/me)3/2T5/2/κph |
| μ0 = μHF−1/2(η)/2F0(η) |
| ψ = 8/3πe(2mekB/h2)3/2F0(η). |
| L = kB2/e2(3F0(η)F2(η) − 4F1(η)2)/F0(η)2. |
The predicted ZTmax at 25 °C is 0.26 for a Hall carrier concentration nH = 8.0 × 10¹⁹ h+ cm−3 and reaches 0.44 at 225 °C for nH = 1.6 × 10²⁰ h+ cm−3. The experimental results for the heterostructured materials are lower than the calculated ZT values for their carrier concentrations, which is mostly due to lower charge carrier mobilities than those used for calculation (which are the measured values for (GeTe)10.5Sb2Te3). All the samples are overdoped with respect to the Hall carrier concentrations, but all are in the same nH range.
The thermal conductivitites were calculated using the Dulong–Petit heat capacity Cp. Measured Cp values for the single components are close to these values.14,38,41 A study on GST materials (see Fig. S9 in the ESI†) showed deviations from the ideal values, especially at elevated temperatures, which are within the range of the reliability interval of the measurements. The error in ZT introduced by the Dulong–Petit approximation can therefore be considered only a few percent in the present cases. All thermal conductivity curves show pronounced minima above 250 °C, which hints at the onset of diffusion phenomena (cf.Fig. 6 middle). Small fractions of skutterudite-type precipitates yield a thermal conductivity which is much lower than that of (GeTe)10.5Sb2Te3 without precipitates, but κ increases upon higher skutterudite-type fractions which correlates with the increase of the electrical conductivity. For κph calculations, individual Lorenz numbers for each composition were determined at RT assuming SPB behavior. Up to 275 °C, the lattice thermal conductivity is significantly reduced for heterostructured material and almost temperature-independent, which might be due to a large residual optical phonon contribution.42
The curve discontinuities of the single parameters compensate each other, which leads to ZT curves that appear with almost no discontinuities (Fig. 6 bottom). For small fractions of skutterudite-type precipitates and most pronounced at intermediate temperatures, there is an apparent increase of ZT upon heterostructuring (30% in certain temperature ranges) which due to the hysteresis and microstructure evolution has considerable uncertainty. The increase in ZT is mainly due to a lower thermal conductivity in combination with only a slightly lower power factor.
Conclusions
This study shows that heterostructures with nanoscale skutterudite-type precipitates are an intriguing way of enhancing the thermoelectric properties of germanium antimony tellurides by means of decreasing their thermal conductivities. Further improvement of the ZT values might be achieved by tuning the charge carrier concentration, which is rather high in the samples investigated. It could be reduced by doping the precipitates with n-type carriers. If these are induced by filling the cage-like voids of the skutterudite type, there may be additional influence on κ. Nevertheless, slightly lower maximum ZT values upon precipitation of skutterudite-type crystallites might be acceptable for the sake of broader existence ranges of the single modifications of the matrix, which thus results in an improved cyclability of GST materials. Due to the complex phase transitions that occur upon heating, the phase composition needs to be carefully controlled, especially regarding the thermal treatment during sample preparation. For a deeper understanding of the phase transitions involved, a detailed analysis of the phase contents is crucial. For this, microfocus synchrotron diffraction is the method of choice, as small crystalline precipitates can be examined without the shortcomings of electron microscopy.Further studies might include ball-milled heterogeneous material, where the size control of the precipitates is straight-forward and an additional reduction of the thermal conductivity is expected.
Acknowledgements
Financial support from the European Union (European Social Fund, NFG “Effiziente Energienutzung: Neue Konzepte und Materialien”) and the Deutsche Forschungsgemeinschaft (Grant OE530/1-2) is gratefully acknowledged. The authors thank Dr Gavin B. Vaughan, Dr Jonathan Wright and Dr Loredana Erra (ESRF, Grenoble) for their support during the synchrotron measurements (project HS-4625). We are indebted to Prof. Dr Wolfgang Schnick (LMU Munich) for his generous support of this work. Tom Faske, Christina Fraunhofer and Sabine Hübner are acknowledged for help with some preliminary syntheses. GJS acknowledges support of DoE EFRC-S3TEC Award DE-SC0001299.References
- E. Quarez, K.-F. Hsu, R. Pcionek, N. Frangis, E. K. Polychroniadis and M. G. Kanatzidis, J. Am. Chem. Soc., 2005, 127, 9177 CrossRef CAS PubMed.
- K. Hoang, K. Desai and S. D. Mahanti, Phys. Rev. B: Condens. Matter Mater. Phys., 2005, 72, 064102 CrossRef.
- M. G. Kanatzidis, Chem. Mater., 2010, 22, 648 CrossRef CAS.
- Y. Pei, H. Wang and G. J. Snyder, Adv. Mater., 2012, 24, 6125 CrossRef CAS PubMed.
- J. R. Sootsman, D. Young Chung and M. G. Kanatzidis, Angew. Chem., Int. Ed., 2009, 48, 8616 CrossRef CAS PubMed.
- G. S. Nolas, D. T. Morelli and T. M. Tritt, Annu. Rev. Mater. Sci., 1999, 29, 89 CrossRef CAS.
- G. Tang, D. Zhang, G. Chen, F. Xu and Z. Wang, Solid State Commun., 2012, 152, 2193 CrossRef CAS PubMed.
- B. C. Sales, D. Mandrus, B. C. Chakoumakos, V. Keppens and J. R. Thompson, Phys. Rev. B: Condens. Matter Mater. Phys., 1997, 56, 15081 CrossRef CAS.
- B. Duan, P. Zhai, L. Liu and Q. Zhang, J. Electron. Mater., 2011, 40, 932 CrossRef CAS.
- X. Su, H. Li, Q. Guo, X. Tang, Q. Zhang and C. Uher, J. Electron. Mater., 2011, 40, 1286 CrossRef CAS.
- X. Su, H. Li, G. Wang, H. Chi, X. Zhou, X. Tang, Q. Zhang and C. Uher, Chem. Mater., 2011, 23, 2948 CrossRef CAS.
- M. N. Schneider, T. Rosenthal, C. Stiewe and O. Oeckler, Z. Kristallogr., 2010, 225, 463 CrossRef CAS.
- T. Matsunaga, H. Morita, R. Kojima, N. Yamada, K. Kifune, Y. Kubota, Y. Tabata, J.-J. Kim, M. Kobata, E. Ikenaga and K. Kobayashi, J. Appl. Phys., 2008, 103, 093511 CrossRef PubMed.
- T. Rosenthal, M. N. Schneider, C. Stiewe, M. Döblinger and O. Oeckler, Chem. Mater., 2011, 23, 4349 CrossRef CAS.
- H. S. Lee, B.-S. Kim, C.-W. Cho, M.-W. Oh, B.-K. Min, S.-D. Park and H.-W. Lee, Acta Mater., 2015, 91, 83 CrossRef CAS PubMed.
- J. Peng, L. Fu, Q. Liu, M. Liu, J. Yang, D. Hitchcock, M. Zhou and J. He, J. Mater. Chem. A, 2014, 2, 73 CAS.
- D. Stroud, Superlattices Microstruct., 1998, 23, 567 CrossRef.
- G. B. M. Vaughan, J. P. Wright, A. Bytchkov, C. Curfs, C. Grundlach, M. Orlova, L. Erra, H. Gleyzolle, T. Buslaps, A. Götz, G. Suchet, S. Petitdemange, M. Rossat, L. Margulies, W. Ludwig, A. Snigirey, I. Snigireva, H. O. Sorensen, E. M. Lauridsen, U. L. Olsen, J. Oddershede and H. F. Poulsen, Challenges in Materials Science Possibilities in 3D and 4D Characterization Techniques: Proceedings of the 31st Risø International Symposium on Materials Science, 2010, 457 Search PubMed.
- J.-C. Labiche, O. Mathon, S. Pascarelli, M. A. Newton, G. G. Ferre, C. Curfs, G. Vaughan, A. Homs and D. F. Carreiras, Rev. Sci. Instrum., 2007, 78, 091301 CrossRef PubMed.
- R. D. Cowan, J. Appl. Phys., 1963, 34, 926 CrossRef CAS PubMed.
- L. Dusza, High Temp. - High Pressures, 1995/1996, 27/28, 467 Search PubMed.
- K. A. Borup, E. S. Toberer, L. D. Zoltan, G. Nakatsukasa, M. Errico, J. P. Fleurial, B. B. Iversen and G. J. Snyder, Rev. Sci. Instrum., 2012, 83, 123902 CrossRef PubMed.
- Y. Pei, X. Shi, A. LaLonde, H. Wang, L. Chen and G. J. Snyder, Nature, 2011, 473, 66 CrossRef CAS PubMed.
- T. K. Chattopadhyay, J. X. Boucherle and H. G. von Schnering, J. Phys. C: Solid State Phys., 1987, 20, 1431 CrossRef CAS PubMed.
- K. A. Agaev, A. G. Talybov and S. A. Semiletov, Sov. Phys. Crystallogr., 1967, 11, 630 Search PubMed.
- P. Urban, M. N. Schneider, L. Erra, S. Welzmiller, F. Fahrnbauer and O. Oeckler, CrystEngComm, 2013, 15, 4823 RSC.
- T. Matsunaga, R. Kojima, N. Yamada, K. Kifune, Y. Kubota, Y. Tabata and M. Takata, Inorg. Chem., 2006, 45, 2235 CrossRef CAS PubMed.
- D. G. Mandrus, A. Migliori, T. W. Darling, M. F. Hundley, E. J. Peterson and J. D. Thompson, Phys. Rev. B: Condens. Matter Mater. Phys., 1995, 52, 4926 CrossRef CAS.
- P. W. Stephens, J. Appl. Crystallogr., 1999, 32, 281 CrossRef CAS.
- F. Fahrnbauer, T. Rosenthal, T. Schmutzler, G. Wagner, G. Vaughan, J. Wright and O. Oeckler, Angew. Chem., Int. Ed., 2015, 54 DOI:10.1002/anie.201503657.
- J. C. Slater, J. Chem. Phys., 1964, 41, 3199 CrossRef CAS PubMed.
- P. Vaqueiro, G. G. Sobany, A. V. Powell and K. S. Knight, J. Solid State Chem., 2006, 179, 2047 CrossRef CAS PubMed.
- D. Jung, M.-H. Whangbo and S. Alvarez, Inorg. Chem., 1990, 29, 2252 CrossRef CAS.
- P. Urban, M. N. Schneider, M. Seemann, J. P. Wright and O. Oeckler, Z. Kristallogr., 2015, 230, 369 CAS.
- M. N. Schneider, P. Urban, A. Leineweber, M. Döblinger and O. Oeckler, Phys. Rev. B: Condens. Matter Mater. Phys., 2010, 81, 184102 CrossRef.
- SADABS, version 2.05, Bruker AXS, Madison, USA, 1999.
- M. N. Schneider, T. Rosenthal, C. Stiewe and O. Oeckler, Z. Kristallogr., 2010, 225, 463 CrossRef CAS.
- T. Rosenthal, P. Urban, K. Nimmrich, L. Schenk, J. de Boor, C. Stiewe and O. Oeckler, Chem. Mater., 2014, 26, 2567 CrossRef CAS.
- H. J. Goldsmid and J. W. Sharp, J. Electron. Mater., 1999, 28, 869 CrossRef CAS.
- A. F. May and G. J. Snyder, in Introduction to Modeling Thermoelectric Transport at High Temperatures in Thermoelectrics and its Energy Harvesting, ed. D. M. Rowe, CRC Press, 2012, vol. 1 Search PubMed.
- X. Shi, J. Yang, J. R. Salvador, M. Chi, J. Y. Cho, H. Wang, S. Bai, J. Yang, W. Zhang and L. Chen, J. Am. Chem. Soc., 2011, 133, 7837 CrossRef CAS PubMed.
- E. S. Toberer, A. Zevalkink and G. J. Snyder, J. Mater. Chem., 2011, 21, 15843 RSC.
Footnotes |
| † Electronic supplementary information (ESI) available: Detailed information on syntheses and analyses, further Rietveld refinements and electron microscopy, additional information on the structure refinement from single-crystal data and thermoelectric properties. See DOI: 10.1039/c5tc01509j |
| ‡ Present address: Laboratoire CRISMAT UMR 6508 CNRS ENSICAEN, 6 Boulevard du Maréchal Juin, 14050 Caen, France. |
| This journal is © The Royal Society of Chemistry 2015 |

