Application of a tailor-made polymer as a selective and sensitive colorimetric sensor for reliable detection of trace levels of uranyl ions in complex matrices†
Mohammad Behbahani*a,
Sara Salimia,
Hamid Sadeghi Abandansaria,
Fariborz Omidib,
Mani Salarianc and
Ali Esrafilid
aDepartment of Chemistry, Shahid Beheshti University, Tehran, Iran. E-mail: mohammadbehbahani89@yahoo.com; Fax: +98 2122431683, +98 4113333458; Tel: +98 2122431661, +98 9141028230
bDepartment of Occupational Health Engineering, School of Public Health, Shahroud University of Medical Sciences, Shahroud, Iran
cDepartment of Chemistry, Georgia State University, Atlanta, Georgia, USA
dDepartment of Environmental Health Engineering, School of Public Health, Iran University of Medical Sciences, Tehran, Iran
First published on 3rd July 2015
Abstract
In this study, a new colorimetric chemosensor based on ion imprinted polymer nanoparticles was designed for quantitative detection of uranyl ions at trace levels in environmental water samples. The removal and pre-concentration of uranyl ions using the synthesized imprinted polymer was performed under optimized conditions and the color of the sorbent changed from yellow to violet. UO22+-imprinted polymer nanoparticles were synthesized by a precipitation polymerization technique. The sorbent was characterized using solid state UV-vis analysis, thermogravimetric analysis (TGA), differential thermal analysis (DTA), scanning electron microscopy (SEM), elemental analysis (CHN) and Fourier transform infrared spectrometry (FT-IR). The color change provides a simple, rapid and reliable method for the sensitive and selective visual detection of trace levels of uranyl ions without the need of sophisticated instruments. The color of the sorbent in the absence and presence of uranyl ions shifts from yellow to violet. The method detection limit of the synthesized chemo-sensor for uranyl ions was 0.0005 ppm. The method was successfully applied for trace detection of uranyl ions in distilled, tap, Caspian Sea and Persian Gulf water samples.
1. Introduction
Uranium is a radioactive element which exists naturally in the environment.1 Nowadays, the risk of exposure to uranium causing adverse effects to human health has been increased tremendously,2,3 uranium is one of the main sources in nuclear energy generation and enriched uranium is a major component in nuclear weapons. Uranium has many forms in aqueous solution, and the most soluble or bioavailable form is uranyl (UO22+). The maximum contamination level of UO22+ in drinking water is defined as 1.30 × 10⁻⁷ mol L−1 by the U.S. Environmental Protection Agency (EPA),4 therefore, it is desirable to have simple and convenient analytical methods that can determine the uranyl present in the aqueous medium at trace levels. Many analytical techniques, require expensive and complicated instruments such as inductively coupled plasma-mass spectrometry (ICP-MS),5–7 and atomic absorption spectrometry8,9 which makes onsite real-time sensing difficult. Optical sensing approaches (e.g. laser fluorimetry,10,11 absorption,12,13 luminescence14) and electrochemical approaches15,16 for the detection of environmental and biological uranium have been developed in the field of chemical sensors across several decades. Among the optical sensors, the fluorescence-based technique is a very appealing approach for future practical application due to its intrinsic sensitivity and high spatial resolution.17,18 For instance, Ganesh et al. reported the determination of the uranium concentration in a raffinate stream of the Purex process during reprocessing of spent nuclear fuel using fluorescence enhancing reagents such as sodium pyrophosphate;19 Angel et al. reported the detection of uranyl ion via fluorescence quenching and photochemical oxidation of calcein with the detection limit of 4.0 × 10⁻⁸ mol L−1;20 recently Liao et al. described the separation and determination of trace uranium using a double-receptors method based on immobilized salophen and fluorescence labeled oligonucleotide.21 However, these methods always require additional chemicals (such as sodium pyrophosphate, calcein and oligonucleotide) or devices (such as balllens22) to obtain high sensitivity and high selectivity. Recently we noticed the fluorescence-signaling DNA aptamers and deoxyribozymes were used as novel biosensing moieties for heavy metal ions.23–25 For example, Lu et al. reported a catalytic beacon sensor for UO22+ based on an in vitro selected UO22+ specific DNAzyme, and this method has a 45 pM detection limit and million-fold selectivity.26 However, such biosensors (uranyl-specific DNAzyme) is costly due to the complication of in vitro-selection. Therefore, there is still an urgent need to develop new simple and convenient methods with high sensitivity and high selectivity for the detection of trace uranium in the environment.Based on the idea of molecular imprinting technique, ion-imprinted polymers (IIPs) have attracted much attention as selective sorbents for preconcentration of metal ions.27 In ion imprinting techniques, the ion–ligand complex serves as a template. In ion imprinting process, three general steps are applied, which include the complexation of metal ion with a suitable ligand (formation of template) as the initial step. The second step is the co-polymerization of monomers in the presence of template, and afterwards removal of complex from the polymer. For adsorption of the target ion, the prepared polymer was put into a solution containing metal ions. Ion-imprinted polymers have various applications, e.g. in separation, preconcentration and purification processes with regard to metal ions including transition elements,28 actinides,29 lanthanides,30 and noble metals in diverse matrices.31
In this work, the ion imprinted polymer nanoparticles were applied as a highly selective and sensitive colorimetric sensor for visual detection of ultra-trace levels of uranyl ions in aqueous solution. The nanosized UO22+-imprinted polymer was prepared by precipitation polymerization technique.
The parameters affecting the visual detection of uranyl ions were investigated and optimized. In these experimental conditions, when the synthesized imprinted polymer nanoparticles interact with uranyl ions, a color change from yellow to violet can be observed. The high sensitivity of the sensor enables the qualitative detection of uranyl ions at trace levels. The method detection limit of the sensor for uranyl ions was 0.0005 ppm.
2. Experimental
2.1. Reagents and materials
Methacrylic acid (MAA) and 2-(5-bromo-2-pyridylazo)-5-(diethylamino) phenol (Br-PADAP) with high purity was purchased from Merck (Darmstadt, Germany, http://www.merck.de). Ethylene glycol dimethacrylate (EGDMA) was obtained from Fluka (Buchs SG, Switzerland, http://www.sigmaaldrich.com). 2,2ʹ-Azobisisobutyronitrile (AIBN) was obtained from Acros Organics (New Jersey, USA). NaOH, HCl, HNO3, acetonitrile and methanol were purchased from Merck (Darmstadt, Germany). All other reagents used in this study were of analytical grade and purchased from Merck (Darmstadt, Germany, http://www.merck.de). Stock solutions of UO22+, Cu2+, Cd2+, Pd2+, Zn2+, Ni2+, Ca2+, Mg2+, Ag+, Fe3+, Mn2+, Na+, K+ and Co2+ were prepared with the addition of an appropriate amount of nitrate salts in ultra-pure water. Ultrapure water was prepared using a Milli-Q system from Millipore (Bedford, MA, USA).2.2. Apparatus
A digital pH meter, Metrohm 827 Ion analyzer (Herisau, Switzerland), equipped with a combined glass calomel electrode was used for the pH adjustments at 25 ± 1 °C temperature. Heidolph heater stirrer model MR 3001 (Germany) was employed for heating and stirring of the solutions. Fourier transform infrared (FT-IR) spectra (4000–200 cm−1) in KBr were recorded using Bruker IFS66/S FT-IR spectrometer. The CHN analysis was performed on a Thermo Finnigan Flash EA112 elemental analyzer (Okehampton, UK). Scanning electron microscopy (SEM) was performed by gently distributing the powder sample on the stainless steel stubs, using SEM (KYKY, EM3200) instrument. The thermal properties of synthesized polymers were determined using a BAHR-Thermoanalyse GmbH (Germany) with employing, heating and cooling rates of 10 °C min−1 and using a condenser as the coolant. The samples were weighed as a thin film and carefully packed into a clean aluminum pan (11.5–12.5 mg), and sealed by crimping an aluminum lid on the pan (Shimadzu universal crimper). An Al2O3 empty pan sealed with a cover pan was used as a reference sample. A scanning range of 10 to 800 °C was used for samples at 10 °C min−1 in nitrogen gas. The reflection spectra of the chemosensor were collected using a solid state 2100-UV-vis Shimadzu spectrophotometer.2.3. Synthesis of UO22+ ion imprinted polymer nanoparticles
The nanosized UO22+-imprinted polymer was prepared by precipitation polymerization technique. In the first step, 2 mmol of methacrylic acid (functional monomer) and 2 mmol of 2-(5-bromo-2-pyridylazo)-5-(diethylamino)phenol (the uranyl-binding ligand) were dissolved in 100 mL of acetonitrile/methanol (1![[thin space (1/6-em)]](https://www.rsc.org/images/entities/char_2009.gif) :
:![[thin space (1/6-em)]](https://www.rsc.org/images/entities/char_2009.gif) 1 v/v) in a 200 mL glass flask. Subsequently, as the second step, 1 mmol of UO2(NO3)2 as an imprinted metal ion (template) was added slowly to a glass flask and the resulted mixture was stirred for 5 h at room temperature. In the third step, 16 mmol of EGDMA and 100 mg of AIBN were added as cross-linker and initiator. The oxygen of the sample solution was removed by bubbling nitrogen through the sample for 10.0 min. Polymerization was performed in an oil bath at 65 °C for 24 h in the presence of nitrogen under magnetic stirring at 400 rpm. The prepared polymer was washed several times with 1
1 v/v) in a 200 mL glass flask. Subsequently, as the second step, 1 mmol of UO2(NO3)2 as an imprinted metal ion (template) was added slowly to a glass flask and the resulted mixture was stirred for 5 h at room temperature. In the third step, 16 mmol of EGDMA and 100 mg of AIBN were added as cross-linker and initiator. The oxygen of the sample solution was removed by bubbling nitrogen through the sample for 10.0 min. Polymerization was performed in an oil bath at 65 °C for 24 h in the presence of nitrogen under magnetic stirring at 400 rpm. The prepared polymer was washed several times with 1![[thin space (1/6-em)]](https://www.rsc.org/images/entities/char_2009.gif) :
:![[thin space (1/6-em)]](https://www.rsc.org/images/entities/char_2009.gif) 4 (v/v) methanol/water to remove the unreacted materials and then with HCl (1.0 mol L−1) for leaching the imprinted metal ions (uranyl ions) until the washing solution was free from uranyl ions. Finally, it was washed with double distilled water until reached a neutral pH (Fig. 1 provides the images of synthesized nanosized IIP after each step).
4 (v/v) methanol/water to remove the unreacted materials and then with HCl (1.0 mol L−1) for leaching the imprinted metal ions (uranyl ions) until the washing solution was free from uranyl ions. Finally, it was washed with double distilled water until reached a neutral pH (Fig. 1 provides the images of synthesized nanosized IIP after each step).
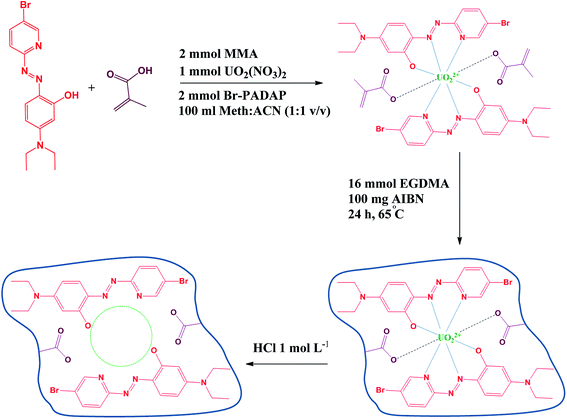 | ||
| Fig. 1 Schematic illustration of imprinting process for the preparation of uranyl-imprinted polymer nanoparticles by precipitation polymerization technique. | ||
2.4. Naked-eye colorimetric detection of uranyl ions
Batch experiments were used for investigation of factors in visual detection of target ion. In the pre-concentration and visual detection step, the pH of sample solution was adjusted to 7.0 by drop wise addition of 2 mol L−1 sodium hydroxide or hydrochloric acid solutions. Then, 10 mg of dried polymer was suspended in aqueous solution containing specific amount of UO22+ and stirred for 5 minutes with a magnetic stirrer. Fig. 2 displays the naked-eye colorimetric change of the imprinted polymer with (1 ppm of uranyl ion). Using the proposed chemosensor, uranyl ions can be pre-concentrated and then visually detected over a wide range [(0.001–100 ppm)]. Fig. 2 demonstrates a selective color change from yellow to violet. The color change provides a simple, rapid and reliable method for the sensitive and selective detection of trace levels of uranyl ions without the need for sophisticated instruments.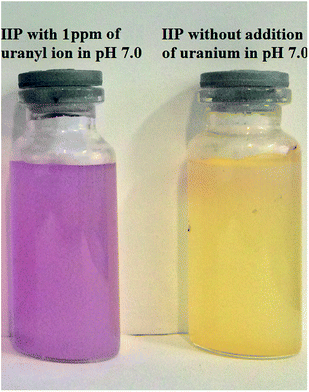 | ||
| Fig. 2 Selective color change of ion imprinted polymer nanoparticles from yellow to violet in the presence of uranyl ions. | ||
2.5. Real sample pretreatment
The tested water samples were distilled water, tap water (Tehran, Iran), and sea water (Persian Gulf and Caspian Sea). The sea water samples were collected in polyethylene bottles. They were cleaned with acid bath, and then filtered through nylon filters (Millipore, 0.22 μm) before the analysis. Finally, the pH of each solution was adjusted to 7.0 by drop wise addition of HCl and NaOH for separation and visual detection of uranyl ions from the water samples.3. Results and discussion
3.1. Characterization of the chemosensor
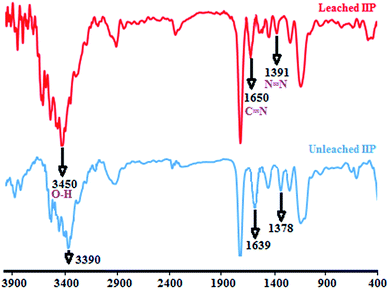
![[double bond, length as m-dash]](https://www.rsc.org/images/entities/char_e001.gif) N (1391 cm−1) and C
N (1391 cm−1) and C![[double bond, length as m-dash]](https://www.rsc.org/images/entities/char_e001.gif) N (1650 cm−1) which further confirm the presence of Br-PADAP in the polymer bead. The peak appeared at 1650 cm−1 corresponding to C
N (1650 cm−1) which further confirm the presence of Br-PADAP in the polymer bead. The peak appeared at 1650 cm−1 corresponding to C![[double bond, length as m-dash]](https://www.rsc.org/images/entities/char_e001.gif) N stretching vibration for Br-PADAP was shifted to 1639 cm−1 for unleached IIP. In addition, the peak appeared at 1391 cm−1 due to N
N stretching vibration for Br-PADAP was shifted to 1639 cm−1 for unleached IIP. In addition, the peak appeared at 1391 cm−1 due to N![[double bond, length as m-dash]](https://www.rsc.org/images/entities/char_e001.gif) N stretching vibration of Br-PADAP was shifted to 1378 cm−1 for unleached IIP. The decrease in band frequencies indicates that the uranyl ions have been coordinated with non-bonding electron pairs of nitrogen in Br-PADAP, and as a result, it demonstrates the presence of uranyl ions in unleached IIP structure. On the other hand, the broad band which observed at 3450 cm−1 is attributed to O–H stretching vibration of hydroxyl group from Br-PADAP. The shift obtained for this band in unleached IIP to 3390 cm−1 is due to hydroxyl group of Br-PADAP involved in the interaction.
N stretching vibration of Br-PADAP was shifted to 1378 cm−1 for unleached IIP. The decrease in band frequencies indicates that the uranyl ions have been coordinated with non-bonding electron pairs of nitrogen in Br-PADAP, and as a result, it demonstrates the presence of uranyl ions in unleached IIP structure. On the other hand, the broad band which observed at 3450 cm−1 is attributed to O–H stretching vibration of hydroxyl group from Br-PADAP. The shift obtained for this band in unleached IIP to 3390 cm−1 is due to hydroxyl group of Br-PADAP involved in the interaction.
3.2. Naked-eye colorimetric optimization
| Tolerance limit for potentially interfering ions (ppm) | |||||||||||||
|---|---|---|---|---|---|---|---|---|---|---|---|---|---|
| Analytes | Ca2+ | Mg2+ | Cu2+ | Ag+ | Co2+ | Cd2+ | Pd2+ | Ni2+ | Zn2+ | Mn2+ | Fe3+ | Na+ | K+ |
| UO22+ | 40 | 50 | 25 | 50 | 50 | 45 | 55 | 40 | 50 | 45 | 55 | 1000 | 1000 |
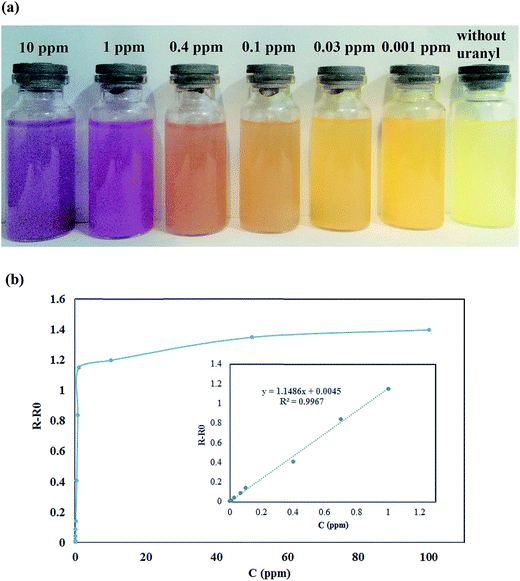 | ||
| Fig. 8 (a) The selective color change from yellow to violet with increases concentration of uranyl ions (selected concentration) (b) the calibration curve in different concentration. | ||
The calibration graph is plotted for various concentrations of uranyl ions as shown in Fig. 8(b). The calibration plot was evaluated based on the relation of R–Ro, where R is the relative reflectance spectra after addition of uranyl ions and Ro is the reflectance of blank solid of the sorbent. The absorbance spectra showed a linear correlation at low concentrations of uranyl ions in the range of 0.001–1 ppm as judged from Fig. 8(b) (inset). It is also noted that the reflectance spectra were nonlinear due to saturation effects, indicating the sensitive detection of low uranyl ions concentrations by the sorbent. This finding shows evidence of the capability of the chemo-sensor assays to determine the uranyl ions with the low concentration level. The method detection limit by the sorbent was 0.0005 ppm and this was calculated according to 3S/N (S: signal and N: noise of analysis). Therefore, the synthesized ion imprinted polymer is highly sensitive to detection uranyl ions.
In order to evaluate the analytical applicability of the proposed method, determination of uranyl ions in selected water samples was performed. The reproducibility of the method was demonstrated by the mean relative standard deviation (RSD). Furthermore, the relative recovery (RR) is defined as the fraction or percentage of a target analyte extracted from a sample containing a known amount of the analyte. RR calculates as following equation:
| RR (%) = (Cfound − Creal/Cadded) × 100 |
The appropriate data was found for analysis of the target ion; therefore, the prepared ion imprinted polymer can be used as a reliable sample treatment technique for trace determination of uranyl ions in water samples. The obtained data for analysis of water samples was summarized in Table 2.
| Sample | Element | Real sample (ppb) | Added (ppb) | Found (ppb) | RRa [%] | RSD [%] |
|---|---|---|---|---|---|---|
| a Relative recovery. | ||||||
| Distilled water | Uranyl | — | 10.0 | 9.8 | 98.0 | 3.2 |
| — | 100.0 | 98.2 | 98.2 | 3.8 | ||
| Tap water | Uranyl | — | 10.0 | 9.7 | 97.0 | 3.1 |
| — | 100.0 | 98.5 | 98.5 | 3.5 | ||
| Caspian Sea water | Uranyl | 6.2 | 10.0 | 16.1 | 99.0 | 3.8 |
| 6.2 | 50.0 | 56.5 | 100.6 | 4.2 | ||
| Persian Gulf water | Uranyl | 4.1 | 10.0 | 13.9 | 98.0 | 4.1 |
| 4.1 | 50.0 | 53.8 | 99.4 | 4.5 | ||
4. Conclusion
To the best of our knowledge, this is the first time that the ion imprinted polymer nanoparticles were applied as a highly selective and sensitive colorimetric sensor for visual detection of uranyl ions at trace levels in aqueous solution with naked eye. Results revealed that the ion imprinted polymer sensor can be used as a simple pre-concentrator to yield high preconcentration efficiency, leading to visual detection and complete removal of uranyl ions over a wide, adjustable range of concentrations. With our novel visual sensor, concentrations of UO22+ as low as 0.001 ppm can be detected with naked eye. The designed chemo-sensor can be used as an effective, simple, rapid, reversible and reliable visual sensor for determination of uranyl ions. The prepared sorbent was characterized with different techniques such as solid state UV-vis, FT-IR, TGA, DTA, SEM and CHN analysis.Acknowledgements
We gratefully acknowledge financial support from the Research Council of Shahid Beheshti University.References
- K. B. Gongalsky, Environ. Monit. Assess., 2003, 89, 197–219 CrossRef CAS.
- E. Schnug and B. G. Lottermoser, Environ. Sci. Technol., 2013, 47, 2433–2434 CrossRef CAS PubMed.
- N. Casacuberta, P. Masque, J. Garcia-Orellana, J. M. Bruach, M. Anguita, J. Gasa, M. Villa, S. Hurtado and R. Garcia-Tenorio, J. Hazard. Mater., 2009, 170, 814–823 CrossRef CAS PubMed.
- EPA, U.S., EPA Integrated Risk Information System (IRIS) Electronic Database, U.S., Environmental Protection Agency, Washington, DC, 1996 Search PubMed.
- K. Chandrasekaran, D. Karunasagar and J. Arunachalam, Anal. Methods, 2011, 3, 2140–2147 RSC.
- J. J. Gonzalez, D. Oropeza, X. Mao and R. E. Russo, J. Anal. At. Spectrom., 2008, 23, 229–234 RSC.
- C. Moeser, R. Kautenburger and H. Philipp Beck, Electrophoresis, 2012, 33, 1482–1487 CrossRef CAS PubMed.
- S. A. Abbasi, Int. J. Environ. Anal. Chem., 1989, 36, 163–172 CrossRef CAS PubMed.
- M. Mlakar and M. Branica, Anal. Chim. Acta, 1989, 221, 279–287 CrossRef CAS.
- A. K. Brown, J. Liu, Y. He and Y. Lu, ChemBioChem, 2009, 10, 486–492 CrossRef CAS PubMed.
- R. S. Addleman, M. Carrott, C. M. Wai, T. E. Carleson and B. W. Wenclawiak, Anal. Chem., 2001, 73, 1112–1119 CrossRef CAS.
- A. Safavi and M. Bagheri, Anal. Chim. Acta, 2005, 530, 55–60 CrossRef CAS PubMed.
- Y. Luo, Y. Zhang, L. Xu, L. Wang, G. Wen, A. Liang and Z. Jiang, Analyst, 2012, 137, 1866–1871 RSC.
- P. T. Varineau, R. Duesing and L. E. Wangen, Appl. Spectrosc., 1991, 45, 1652–1655 CrossRef CAS.
- A. Becker, H. Tobias and D. Mandler, Anal. Chem., 2009, 81, 8627–8631 CrossRef CAS PubMed.
- R. M. Z. Kakhki and G. Rounaghi, Mater. Sci. Eng., C, 2011, 31, 1637–1642 CrossRef CAS PubMed.
- A. M. Powe, K. A. Fletcher, N. N. Luce St, M. Lowry, S. Neal, M. E. McCarroll, P. B. Oldham, L. B. McGown and I. M. Warner, Anal. Chem., 2004, 76, 4614–4634 CrossRef CAS PubMed.
- O. S. Wolfbeis, Anal. Chem., 2004, 76, 3269–3283 CrossRef CAS PubMed.
- S. Ganesh, F. Khan, M. K. Ahmed, P. Velavendan, N. K. Pandey, U. K. Mudali and S. K. Pandey, J. Radioanal. Nucl. Chem., 2012, 292, 331–334 CrossRef CAS PubMed.
- D. A. Nivens, Y. K. Zhang and S. M. Angel, J. Photochem. Photobiol., A, 2002, 152, 167–173 CrossRef CAS.
- M. Wu, L. Liao, M. Zhao, Y. Lin, X. Xiao and C. Nie, Anal. Chim. Acta, 2012, 729, 80–84 CrossRef CAS PubMed.
- D. Pestov, C. C. Chen, J. D. Nelson, J. E. Anderson and G. Tepper, Sens. Actuators, B, 2009, 138, 134–137 CrossRef CAS PubMed.
- J. Liu and Y. Lu, Angew. Chem., Int. Ed., 2007, 46, 7587–7590 CrossRef CAS PubMed.
- J. Li and Y. Lu, J. Am. Chem. Soc., 2000, 122, 10466–10467 CrossRef CAS.
- N. Rupcich, W. Chiuman, R. Nutiu, S. Mei, K. K. Flora, Y. F. Li and J. D. Brennan, J. Am. Chem. Soc., 2006, 128, 780–790 CrossRef CAS PubMed.
- J. Liu, A. K. Brown, X. Meng, D. M. Cropek, J. D. Istok, D. B. Watson and Y. Lu, Proc. Natl. Acad. Sci. U. S. A., 2007, 104, 2056–2061 CrossRef CAS PubMed.
- T. Prasada Rao, R. Kala and S. Daniel, Anal. Chim. Acta, 2006, 578, 105–116 CrossRef PubMed.
- M. Behbahani, M. Taghizadeh, A. Bagheri, H. Hosseini, M. Salarian and A. Tootoonchi, Microchim. Acta, 2012, 178, 429–437 CrossRef CAS.
- L. Zhoua, C. Shanga, Z. Liua, G. Huanga and A. A. Adesinab, J. Colloid Interface Sci., 2012, 366, 165–172 CrossRef PubMed.
- S. Shirvani-Arania, S. J. Ahmadi, A. Bahrami-Samani and M. Ghannadi-Maragheh, Anal. Chim. Acta, 2008, 623, 82–88 CrossRef PubMed.
- B. Godlewska-Zyłkiewicz, B. Lésniewska and I. Wawreniuk, Talanta, 2010, 83, 596–604 CrossRef PubMed.
Footnote |
| † Electronic supplementary information (ESI) available. See DOI: 10.1039/c5ra09221c |
| This journal is © The Royal Society of Chemistry 2015 |

