Oral bioavailability and sex specific tissue partitioning of quantum dots in fathead minnows, Pimephales promelas†
C. M.
Lavelle
a,
J. H.
Bisesi
Jr.
b,
M. A.
Hahn
c,
K. J.
Kroll
a,
T.
Sabo-Attwood
b and
N. D.
Denslow
*a
aUniversity of Florida, Department of Physiological Sciences, Center for Environmental and Human Toxicology, 2187 Mowry Rd, Gainesville, USA. E-mail: clavelle@ufl.edu; krollk@ufl.edu, ndenslow@ufl.edu
bUniversity of Florida, Department of Environmental and Global Health, Center for Environmental and Human Toxicology, 2187 Mowry Road, PO Box 110885, Gainesville, FL 32611, USA. E-mail: jbisesi@phhp.ufl.edu; sabo@phhp.ufl.edu
cMedtronic Surgical Technologies, 6743 Southpoint Drive North, Jacksonville, FL 32216, USA. E-mail: megan.hahn@medtronic.com
First published on 16th October 2015
Abstract
The number of potential applications for manufactured nanomaterials (NMs) is growing exponentially around the world as is concomitant research into the possible consequences of inadvertent or purposeful releases into the environment. Fish and other aquatic organisms reside in bodies of water where many NMs may potentially be deposited, as these environments act as terminal sinks for many contaminants. A growing body of evidence suggests that some NMs, depending on their composition, size, and/or surface functionalization, can affect fish health by adversely interacting with gill function or by entering circulation through the digestive tract. The goal of this study was to investigate the role surface functionalization plays on oral bioavailability of NMs, using quantum dots (QDs) as a model. Three different surface functional groups, amino, carboxyl, and PEG were investigated. Additionally, two different exposure scenarios, a single dose or 5 sequential doses over 2 weeks, were used to determine which tissues were the sites of greatest accumulation over time. Results show QDs are able to enter the blood stream after ingestion, and accumulate in the intestine, liver, gonads, and other organs in female and male fathead minnows. Data from a repeated dosing experiment indicated that QDs were retained and accumulated in most tissues in a surface functionalization and sex specific manner. The carboxyl and amino QDs were found to be most readily taken up and the carboxyl QDs were found to be in the greatest concentration in the most number of tissues including the gonad, spleen and kidneys in both males and females.
Nano impactNanomaterials have the potential to revolutionize many aspects of our lives, including medicine, food preservation, environmental remediation, and consumer products. Exponential growth in the development and use of NMs is currently underway without a clear understanding of their potential environmental impacts. Similar to most environmental contaminants, the aquatic environment and relevant species, including fish, will likely experience complex and chronic exposures to NMs. The results of this study can be combined with those of other studies to identify NM characteristics that increase bioavailability and toxicity. Engineers can use data obtained from these studies to facilitate a “safety by design” approach to nanomaterial production. Specifically, the results of this study and similar studies that elucidate how surface functionalization drives uptake can be used by producers to design NMs that are less bioavailable and/or less toxic to aquatic organisms. |
Introduction
The nanomaterial (NM) industry is expected to yield $1 trillion world-wide by 2015 with an increasing number of products and uses.1 But concomitant research on the environmental health and safety of these materials has been outpaced by their use in industrial, commercial, and medical applications. Aquatic ecosystems are generally impacted by anthropogenic releases and discharges of NMs are likely to target them as well.2 Recent estimates put direct surface water release of NMs globally at over 60![[thin space (1/6-em)]](https://www.rsc.org/images/entities/char_2009.gif) 000 tons.3 Because of this potential impact on aquatic systems, fish are an important model for studying NM environmental health and safety. Data indicates that fish are able to absorb NMs from their aquatic surroundings primarily through the gills.4–6 Other uptake routes may include oral exposure through water or food, and dermal exposure.6–9 Only one other fish study, to date, has investigated NM uptake by oral gavage in fathead minnows (FHMs). In this study, FHMs were gavaged with single walled carbon nanotubes and tracked with a custom imaging system for seven days.10 There was no evidence of uptake into any tissues as fluorescence attributable to the nanotubes was only observed in the gut tissue. However, signs of toxicity including edema and mucus cell morphology in the gut were observed. Other studies have also shown uptake and accumulation of NMs through gills and into tissues of other fish species including carp and zebrafish.5,11,12 The results of these studies suggest that NM uptake into aquatic organisms including fish is NM specific.
000 tons.3 Because of this potential impact on aquatic systems, fish are an important model for studying NM environmental health and safety. Data indicates that fish are able to absorb NMs from their aquatic surroundings primarily through the gills.4–6 Other uptake routes may include oral exposure through water or food, and dermal exposure.6–9 Only one other fish study, to date, has investigated NM uptake by oral gavage in fathead minnows (FHMs). In this study, FHMs were gavaged with single walled carbon nanotubes and tracked with a custom imaging system for seven days.10 There was no evidence of uptake into any tissues as fluorescence attributable to the nanotubes was only observed in the gut tissue. However, signs of toxicity including edema and mucus cell morphology in the gut were observed. Other studies have also shown uptake and accumulation of NMs through gills and into tissues of other fish species including carp and zebrafish.5,11,12 The results of these studies suggest that NM uptake into aquatic organisms including fish is NM specific.
An important consideration in metal-NM toxicity studies is determining if observed effects are due to the intact NMs or to the result of free ion release. This distinction will vary greatly with different NMs and exposure conditions, especially for nano-metals.13 One study compared the effects of copper NMs and ionic copper (at concentrations modelling free ion release from the NM version), and found similar uptake in the gills for both copper forms, suggesting the observed uptake was from free ions only.5 However, Scown et al.14 reported an increase in silver in the liver and gills of fish exposed to nano-silver rather than bulk silver or silver nitrate. Metal ion release and subsequent toxicity can be reduced by capping or coating NMs, such as is done with many quantum dots (QDs) that contain toxic metal cores.15
An immense amount of diversity exists in engineered NMs in terms of their use, release, material, size, shape, and surface chemistry.3 This diversity makes drawing generalizations about NMs as a group difficult and prone to caveats. However, a single NM can be used to study the effects of changing a specific characteristic, such as surface chemistry, to elucidate the role that characteristic can play in altering endpoints such as uptake and biodistribution.
Quantum dots are semi-conductive NMs with a crystalline metalloid core and an outer protective shell, which is often covered in a bioactive coating made of proteins or small molecules to “functionalize” them.15 There are no published reports of global QD production but their unique properties are being exploited by the biomedical, optics, and electronic industries.15 QDs make excellent model NMs because they are innately fluorescent (while intact) due to quantum confinement physics allowing them to be tracked from the sub-cellular to the organismal level in real time.16 Other beneficial properties of QDs, which make them excellent model NMs are their electron density and their cadmium core, making them amenable to transmission electron microscopy (TEM) and inductively coupled plasma mass spectrometry (ICP-MS), respectively. The possibility of particle tracking allows for the ability to conduct comprehensive biodistribution and toxicity studies in biological systems.
Few studies have investigated the biodistribution and toxicity of QDs in fish. Blickley et al.17 exposed estuarine killifish, Fundulus heteroclitus, to cadmium-based QDs via their diet for 85 days. Results of this study suggest that only a small percent of the total dose of QDs (125.8 μg of Cd) were taken up into the fish. However, the study showed that either QDs or their degradation products are transferred from exposed female fish to spawned eggs. A study of the biodistribution of QDs in fathead minnows (FHMs) used aqueous exposures of carboxyl surface-modified QDs and showed significant accumulation in the gut tissue as measured using a fluorescence-based approach.18
Comprehensive understanding of the biological differences between model species is important for picking a model species and extrapolating the results of a study to other species. All cyprinids, including fathead minnows (FHMs), are stomach-less fish.19 Since, FHMs lack a stomach they do not secrete hydrochloric acid and do not create an acidic environment in the gut. In other species, QDs have been shown to degrade in simulated acidic conditions of the stomach and release cadmium ions.20 Therefore, it can be hypothesized that cadmium uptake in a fish with a stomach may be the result of greater free ion uptake whereas in a stomach-less fish cadmium uptake would be the result of intact particle uptake. FHMs are also an ideal model for studying the effects of NMs on reproduction. They are a commonly used model for these types of studies because females are constantly maturing eggs through the reproductive season.21
The inevitable exposure of aquatic organisms to NMs necessitates identification of NMs that pose the greatest risk as likely targets for sub lethal toxicity. The goal of this study was to investigate the role surface functionalization plays on oral bioavailability of NMs, using QDs as a model. Three different surface functional groups were investigated with two different exposure scenarios, a single dose or 5 doses over 2 weeks, to determine which tissues are the sites of greatest accumulation.
Experimental
Animals
Fathead minnows were lab reared and raised to maturity in the Aquatic Toxicology Laboratory with approval from the University of Florida Institutional Animal Care and Use Committee (Gainesville, FL). Fish were maintained in 25 °C flow-through dechlorinated tap water in 565 L fiberglass aquaria held on a summertime light cycle (16 hours of light: 8 hours of darkness). They were fed a mixture of brine shrimp flakes and bloodworms to satiation daily until 12 hours before dosing. Fish in the single and multiple dose experiments were not fed on dosing day.Particle characterization
Quantum dots, were purchased with three different surface chemistries; Qdot ITK 705 carboxyl (carboxyl), Qdot ITK 705 amino (amino, amine-derivatized PEG), and QTracker 705 (PEG) from a commercial source (Life Technologies; Carlsbad, CA). The core of these QDs is primarily comprised of cadmium (Cd) and to a lesser degree, tellurium (Te) and selenium (Se) and the core is surrounded by a ZnS shell that inhibits QD dissolution. Additionally, they are stable in aqueous solutions due to an additional amphophilic polymer coating. Stocks were diluted to 100 nM in Milli-Q water (Millipore; Billerica, Massachusetts) prior to use.Quantum dot core size was obtained by image analysis of TEM images for the longest dimension (n = 200 QDs per type) using ImageJ (http://imagej.nih.gov/ij/). TEM images were taken from whole mount preparations of the 100 nM stocks mounted on 200-mesh copper grids coated with Formvar and carbon (Ted Pella, Inc, Redding, CA). Samples were examined with a Hitachi H-7000 TEM (Hitachi High Technologies America, Inc. Schaunburg, IL) equipped with a 100 kV electron beam.
Fluorescence spectra were obtained by measuring the emission from 500 nm to 850 nm at 1 nm increments with an excitation wavelength of 450 nm on a HORIBA Jobin Yvon NanoLog fluorometer equipped with a tungsten lamp. Zeta potential was measured on a Brookhaven ZetaPlus (Brookhaven Instruments Corp, Holtsville, NY) with at least 5 runs with 10 cycles per run for each sample and values were calculated using the Smoluchowski model, which is the classic model used to the convert the mobility of a colloid to its zeta potential.22 The hydrodynamic radius of QDs was measured by dynamic light scattering (DLS) using a Microtrac Nanotrac (Montgomeryville, PA) in triplicate 60 second runs per sample.
Inductively coupled plasma-mass spectrometry
Metal levels in tissues were measured using inductively coupled plasma mass spectrometry (ICP-MS) as previously described.23 Briefly, tissue samples were placed in disposable borosilicate culture tubes (18 mm × 150 mm) and subjected to nitric acid–peroxide digestion using Optima grade nitric acid at 140 °C until the samples were almost dried. Immediately after digestion, 200 μL of 30% hydrogen peroxide (ACS certified) was added. Samples were then diluted with Milli-Q water to a final nitric acid concentration of 2% before being filtered with a 0.2 μm SFCA syringe filter (Corning Incorporated). Analyses of cadmium (111Cd) and tellurium (125Te) were performed on a Thermo Electron X Series ICP-MS (Thermo Electron Corporation, Winsford, Cheshire, UK) using iridium (m/z = 115) as an internal standard. Each sample was assayed in triplicate and the average used to calculate the concentration against a standard curve spanning six orders of magnitude (0 to 1000 ng mL−1). The limit of detection (LOD) was calculated as three times the standard deviation of the blank and is 0.021 ng mL−1 for Cd and 0.034 ng mL−1 for Te, respectively. The lower limit of quantitation (LLOQ), as determined by the lowest point of the calibration curve with less than 30% error, was 0.1 ng mL−1 for both Cd and Te. Therefore, as prepared, samples needed to have a total of 0.063 ng Cd and 0.102 ng Te to be over the LOD and 0.3 ng Cd and Te to be over the LLOQ. Samples that were below the LOD were reported as ½ (LOD) for statistical analysis. Selenium was not measured in samples because low levels are difficult to quantify with ICP-MS due to ionization issues and interferences. All the reagents used in this experiment were purchased from ThermoFisher (Thermo Fisher Scientific Inc.) except the standards which were purchased from Inorganic Ventures (Christiansburg, Virginia).Experiment 1: single dose biodistribution
Fathead minnows were anesthetized using buffered tricane methanesulfonate (MS-222, Western Chemical Incorporated). Test QDs were orally dosed by gavage (20 μL of 100 nM QDs) into FHMs using a 20 μL pipette with a sterile disposable tip. This corresponds to a dose of 2 pmols per fish. A total of 48 fish of each sex were subjected to one of four test conditions (three different QDs or control Milli-Q water, n = 12 per treatment and sex). After dosing, fish were placed individually in covered glass beakers with 250 mL of clean laboratory water and aeration for 12 hours while also shielded from light. At the end of the 12 hour period, fish were euthanized with an overdose of buffered MS-222, weighed and length measured. Individually dissected organs (whole blood, gonad, liver, intestine, gut contents) from male and female FHMs were removed for ICP-MS. Blood was collected with a heparinized microhematocrit tube after severing the caudal peduncle with a razor blade. Total blood volume in the fish was estimated to be 4% of the total mass (40 μL g−1 fish) and was used to calculate the total amount of cadmium in the blood per fish.24 All tissues and whole blood were immediately digested for ICP-MS analysis as described above. Uptake was quantified by ICP-MS measurements of cadmium as described above, although this method is unable to distinguish if QDs are intact or have degraded. Additionally, the amount excreted in 12 hours was determined by collecting and digesting the feces and tank water. The sum of cadmium measured in the tank water, feces, gut and gut contents of individual fish represents the total amount of cadmium expected to be excreted, and was used to evaluate total uptake in the single dose experiment.Experiment 2: multiple dose biodistribution
As many samples in Experiment 1 were below the quantitation limit for Cd, another oral bioavailability study was conducted. In Experiment 2, fish were gavaged every third day during a two week period for a total of five doses consisting of 10 μL of Milli-Q water control or one of the QD treatments: 100 nM PEG, amino, or carboxyl QDs. Six replicate fish of each sex were subjected to one of four test conditions (3 QDs or control) for a total of 24 fish per sex. Fish were kept in 10 L aquaria over the 2 week exposure so no analysis of feces in aquaria water was conducted. Fish were fed daily, except on dosing days when they were not fed. At the termination of the experiment fish were euthanized, sexed, weighed and length measured. Individually dissected tissues (whole blood, gonad, liver, anterior kidney, posterior kidney, spleen, intestine, gut contents) from male and female FHMs were removed and digested for analysis. As in Experiment 1, tissues were analyzed for cadmium by ICP-MS. However, 125Te was also measured in the tissues for determination of QD integrity in vivo. Comparison of the ratio of Cd to Te in tissues that have quantifiable levels of tellurium can be used to determine if QDs are intact or degraded as the two elements differ in their retention kinetics when investigated in mammalian models.25–27Statistical analysis
Particle characterization endpoints including core size, hydrodynamic radius, zeta potential and cadmium content were analyzed by one-way ANOVA, with a Tukey post-test. In Experiment 1, ICP-MS data are reported as ng Cd per mg tissue, ng Cd per μL in blood, and as percent dose in intestines, gut contents, feces and water (combined as “excreted”). In Experiment 2, ICP-MS data were reported as ng Cd per mg tissue and ng Cd per μL in whole blood. In Experiment 1 and Experiment 2, differences in uptake with treatment were analyzed with the Kruskal–Wallis test as the data were not normally distributed. When p < 0.05, a Dunn's post-test with comparisons of all means was conducted. Comparisons between only two groups (single vs. multiple doses) were made using a Mann–Whitney U-test. All statistical tests were carried out in Prism 5 (Graphpad Software, San Diego, CA).Results
Particle characterization
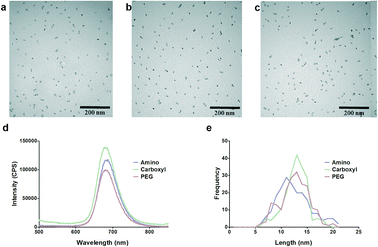
One of the most important aspects of biological studies with NMs is adequate characterization of the NMs as dosed to which effects can be compared. Images from TEM of the samples showed the amino (Fig. 1a), carboxyl (Fig. 1b) and PEG (Fig. 1c) QDs to be well dispersed, with no evidence of agglomeration.The QDs used in this study had advertised peak emissions at 705 nm based on manufacturer specifications: however, emission spectra were obtained for the prepared dosing stocks. Peak emission at an excitation wavelength of 450 nm was measured to be at 685 nm, slightly different than the advertised 705 nm (Fig. 1d).
All three QD types were found to have core sizes of approximately 12 nm (Table 1) and a size distribution with a single dominant peak (Fig. 1e). Despite having the same core size, all three QDs were different in their hydrodynamic radii as measured by DLS (p < 0.0001) (Table 1). The difference in size as measured by DLS of the three QD types is due to the different surface functional groups.
| Amino | Carboxyl | PEG | |
|---|---|---|---|
| Core size as measured by TEM (nm), hydrodynamic radius measured by DLS (nm), ζ-potential (mV), and cadmium content (ng pmol−1 QDs) and cadmium to tellurium ratio. All data presented as mean ± SD. Comparisons between QD types were made by ANOVA with a Tukey post-test and statistically significant differences represented by different letters (A, B, and C), p < 0.05. | |||
| Core size (nm) | 11.94 ± 3.23 | 12.32 ± 2.30 | 12.11 ± 2.72 |
| Hydrodynamic radius (nm) | 18.31 ± 3.47A | 14.4 ± 2.67B | 26.2 ± 4.49C |
| ζ-potential (mV) | −24.97 ± 2.64A | 63.75 ± 1.99B | 6.89 ± 2.64C |
| Cd (ng pmol−1) | 769.2 ± 23.23 | 780.34 ± 55.96 | 731.96 ± 24.99 |
| Cd/Te | 60.26 ± 3.19 | 57.30 ± 2.02 | 58.65 ± 4.23 |
Surface charge of the QD dosing preparations was estimated by measuring ζ-potential. All three QDs, as dosed, differed significantly (p < 0.0001) in surface charge with the carboxyl QDs being the most negative (−55.62 ± 2.16), PEG QDs the least negative (−14.89 ± 1.3) and amino QDs in the middle (−23.38 ± 0.45) (Table 1).
The QD constituents, Cd and Te, were measured by ICP-MS. Cadmium concentration in the QDs was measured between 731.96 and 780.34 ng pmol−1, but there were no differences between QD types (Table 1). Additionally, the mass ratio of Cd to Te in the QDs did not differ among types.
Single dose biodistribution
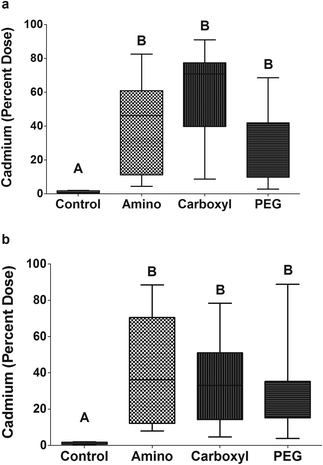
In order to determine if QDs with any of the surface functional groups studied could penetrate tissues from the gut, fish were administered a single oral dose by gavage. The experiment was terminated 12 hours after dosing because significant levels of Cd could be detected in the feces by this time-point in pilot studies (data not shown); suggesting this was long enough to accommodate gut transit time.Fish exposed to a single oral dose of QDs had detectable levels of Cd in blood, liver and gonad tissues within 12 hours indicating that QDs are able to cross the gut barrier and enter the circulation. In assessing overall uptake of NMs, we observed a significant difference between control fish and QD-exposed fish but no significant differences between QD-type for both females (Fig. 2a) and males (Fig. 2b).
Direct comparisons of overall uptake between males and females were not made because of their difference in size as the average size of females was 2.41 g (±0.68) and males was 4.64 g (±0.89). Males have a larger gut mass than females (p < 0.0001) (77.49 ± 25.63 mg for females and 113.7 ± 27 mg for males), and therefore, it is likely they also have more adsorptive surface area. Indeed, a positive correlation was detected between fish mass and internalized QDs (Fig. S1†). The total amount of Cd that was expected to be excreted was calculated as the sum of the amount in the gut, gut contents, feces, and water.
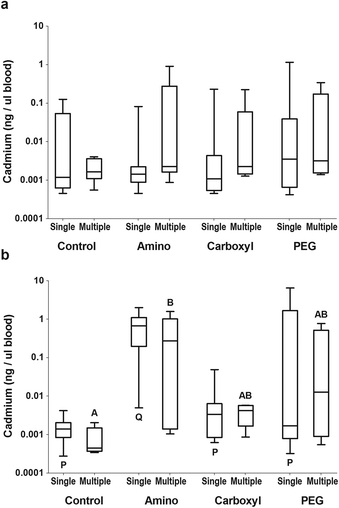
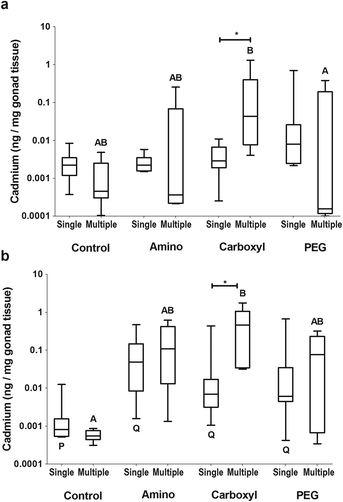
Individual tissues were then investigated for QD uptake, including whole blood, liver, and gonad. In general, individual biological variability was high, however, a number of significant observations were noted. Females did not have detectable cadmium in the blood, likely due to the small volume of blood that could be acquired (Fig. 3a). Males had significantly more cadmium in the blood of amino QD dosed fish than the controls (p < 0.0001) or either other QD type (p < 0.05) (Fig. 3b).
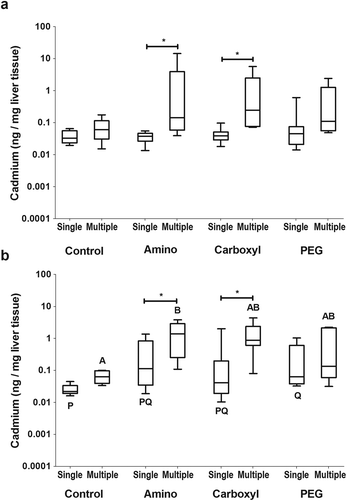
Uptake of QDs into the liver was investigated because the liver is commonly found to be a target of NMs in other model systems and is an important tissue for detoxification. No significant differences were detected in the amount of cadmium measured in the liver of females in any of the QD treatments (Fig. 4a) whereas there was accumulation of significant amounts of PEG QDs (p = 0.019) in male livers (Fig. 4b) compared to controls.
Gonad tissue was investigated, as it is the major reproductive tissue and could be a source of maternal transfer. There were no significant differences in cadmium levels (p = 0.017) of the female gonad for any QD type (Fig. 5a). In males, the testes from amino (p < 0.001), carboxyl (p < 0.05) and PEG (p < 0.05) QD exposed fish had significant levels of cadmium when compared to controls but were not distinguishable from each other statistically (Fig. 5b).
Multiple dose biodistribution
Results of the single dose experiment revealed that QDs, or the constituents of their metal core, are able to cross the gut and be measured in various tissues. However, variability was high and most of the dose was excreted. Therefore, in order to improve the ability to detect uptake and differences between QDs, a new experiment was conducted in which FHMs received 2.5 times the amount of QDs administered in the single dose experiment, divided into 5 doses given over 2 weeks. Repeated dosing of QDs over 2 weeks allowed for better identification of target tissues because the number of samples below the LOQ was reduced.Accumulation of QDs was found to vary by tissue, QD type, and sex. Just as in the single dose study, no detectable differences in cadmium were found in female blood (Fig. 3a) or liver (Fig. 4a) tissues. In the ovary, significantly more (p = 0.0401) cadmium per mg tissue was found in the carboxyl-dosed compared to the PEG-dosed females (Fig. 5a).
Similar to the single gavage experiment, males dosed with amino QDs in the multiple gavage study had higher levels of cadmium in their blood compared to controls (p = 0.0244) (Fig. 3b). Additionally, the livers of the amino QD dosed males had the most cadmium which was significantly (p < 0.05) higher than controls (Fig. 4b). In the testes, dosing with the carboxyl QDs resulted in the highest levels of cadmium, which were significantly (p < 0.01) different from controls (Fig. 5b).
Comparisons were made between the amount of cadmium found in tissues between the single gavage and the multiple gavage study to identify tissues that accumulated intact QDs or cadmium from degrading QDs. In females, the amount of cadmium in the gut (data not shown) and in the blood (Fig. 3a) was not affected by increasing the number of doses. However, significantly more cadmium was found in the liver of females that received multiple amino (p = 0.003) or carboxyl (p = 0.00) QD doses (Fig. 4a). In the ovary, only the fish that received multiple doses of the carboxyl QDs had significantly (p = 0.004) higher amounts of Cd than their single dose counterparts (Fig. 5a). Similar to females, male FHMs did not accumulate Cd in the gut (data not shown) or blood (Fig. 3b). The liver of males exposed to amino (p = 0.025) and carboxyl (p = 0.017) QDs in multiple doses showed significant accumulation over their singly dosed counterparts (Fig. 4b) and the gonad of males dosed with carboxyl QDs had significant (p = 0.004) Cd accumulation with the increase in the number of doses (Fig. 5b).
Cadmium content in the spleen, anterior kidney, and posterior kidney were evaluated in the multiple dose study only. Due to the small weight of these tissues, samples from replicate fish of the same treatment were pooled. Because of having only one sample, no statistical analysis could be performed. However, Cd levels can be seen in these tissues to be one to two orders of magnitude higher than in control tissues (Table 2), suggesting these tissues are potential target tissues of internalized QDs. Tissues from carboxyl QDs had the highest amounts of cadmium compared to the other QD types in both males and females while a sex difference for the PEG QDs in these tissues is suggested by this data.
| Control (Cd ng per mg tissue) | Amino (Cd ng per mg tissue) | Carboxyl (Cd ng per mg tissue) | PEG (Cd ng per mg tissue) | |
|---|---|---|---|---|
| Tissues analyzed as pools (n = 1) because of small size. | ||||
| Spleen | ||||
| Male | 0.06 | 2.17 | 6.20 | 3.59 |
| Female | 0.03 | 5.28 | 6.43 | 0.03 |
| Anterior kidney | ||||
| Male | 0.12 | 2.16 | 6.26 | 1.41 |
| Female | 0.36 | 1.23 | 5.45 | 2.60 |
| Posterior kidney | ||||
| Male | 0.10 | 1.38 | 3.36 | 0.82 |
| Female | 0.22 | 1.31 | 1.94 | 1.86 |
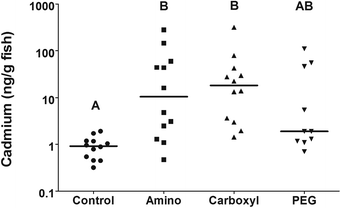
The amount of QDs in different tissues by sex was best evaluated by first summing the total amount of uptake seen in individuals. The internalized dose was calculated as the sum of cadmium measured in the liver, blood and gonad of each individual fish. The amount of QDs internalized was highly variable but statistical analysis revealed that carboxyl and amino QDs were most readily internalized (Fig. 6).
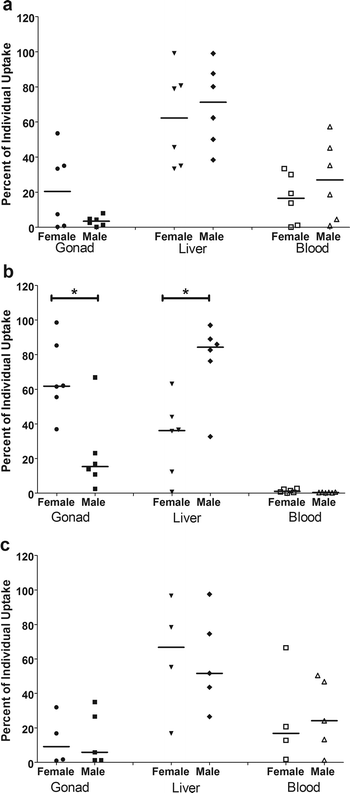
Next, partitioning into the whole blood, liver and gonad tissues was calculated on an individual basis, as the percent of the internalized dose in each tissue. Differences in partitioning by QD type in female blood and liver were not detected. However, a higher (p = 0.007) percent of the internalized dose was detected in the ovary of females dosed with the carboxyl QDs. The QDs containing PEG, the amino and PEG QDs, were found at a higher (p < 0.05) percent of the internalized dose in male blood, however, no significant differences were detected in the livers or gonads of males.
There are clear sex differences in partitioning of the internalized dose by QD-type. For the amino (Fig. 7a) and PEG (Fig. 7c) QD dosed fish, there are no statistically significant differences in partitioning into different tissues due to sex. However, for the carboxyl (Fig. 7b) QD dosed fish, there is a significant difference in tissue partitioning, with females accumulating a higher percent of the internalized dose in the gonad than males (p = 0.026) and males accumulating a higher percent of the internalized dose in the liver than females (p = 0.026).
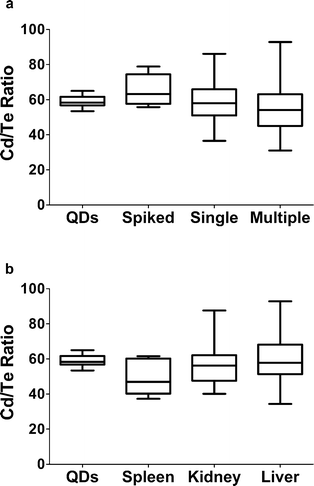
Measuring cadmium in tissues elucidated some interesting differences with sex and surface functionalization. However, whether the QDs are still intact in these tissues can't be determined by measuring cadmium alone. The integrity of the QDs was evaluated by determining the ratio of cadmium to tellurium in different tissues. The ratios of Cd to Te by QD type (Table 1) were not significantly different, and the average ratio for the three QD types combined was 58.97 ± 3.63 (mean ± SD). The average in vivo cadmium to tellurium ratio in samples where tellurium was above the LOQ or expected to be above the LOQ based on the amount of cadmium present was 57.84 ± 20.33 (mean ± SD). Comparisons were made between single and multiple doses (Fig. 8a) and by tissue type (Fig. 8b) and no statistically significant differences were detected. Similarly, no differences were seen when analyzed by QD type in grouped non-GI tissues (liver, gonad, blood, spleen, anterior kidney, and posterior kidney), by sex in grouped non-GI tissues, by QD type in the liver only, and by sex in the liver only (data not shown).
Discussion
In this study, the oral bioavailability of QDs with different surface functionalizations in adult FHMs was determined, and the transport of ingested QDs through the digestive tract and into the blood stream where they may then become incorporated into the gonads or other tissues was described.Data from a repeated dosing experiment indicated that QDs were retained and accumulated in specific tissues. Additionally, this study shows that QDs are able to traverse the gut epithelium partition from blood into tissues in a QD and sex specific manner. The observed sex specificity of the carboxyl QDs suggests an interaction with sex specific proteins or other molecules they encounter before reaching specific tissues, possibly in plasma, which in turn mediates tissue distribution. For example, carboxyl QDs may be interacting with plasma vitellogenin or nutrients en route to a developing oocyte which could facilitate uptake into these tissues.
Detection of NMs in biological tissues and environmental samples can be problematic and time consuming.28 For example, TEM analysis of Daphnia magna exposed to single walled carbon nanotubes suggested adsorption, however, high resolution TEM could not validate apparent uptake due to the limitations of detecting carbon NMs in biological systems.29 Using QDs as a model NM allowed for detection using metal analysis, and further provided a method of determining whether or not the NMs remained intact in tissues.
An important aspect of uptake and toxicity studies of NMs is distinguishing between particles and ions. Cadmium measurement by ICP-MS is a sensitive method of detection with a LOQ in low ppb range. However, Cd concentration alone is not enough to confirm uptake of an intact particle. The FHM, as with all cyprinid fish, does not have a stomach,30 and thus NMs do not encounter an acidic environment that could facilitate degradation. This biological feature would support the hypothesis that intact QDs are able to cross the gut epithelium.
Confirmation of QD disposition was made by comparing the Cd/Te ratio since, at least in other species, the biological half-life of Cd ions is much longer than Te ions.31 The interactions of Cd with metallothionein (MT) are well understood as a classic example of heavy metal detoxification in fish.32 While Te metabolism has yet to be investigated in fish and is poorly understood in mammals, it is suspected that the same mechanisms influencing Se metabolism, specifically incorporation into amino acids or methylation for excretion, are involved in Te metabolism, as they are closely related chalcogens.33,34 As the metabolism of these two metals differs, it can be expected that their retention in tissues will differ as well, a characteristic that was exploited to infer the integrity of the QDs in vivo. Therefore, if QDs were degraded, an increase in the ratio of Cd to Te would be expected if the tissue retention kinetics of cadmium and tellurium are different, as they are in mammals.
Comparing the ratio of Cd to Te suggests that there is minimal degradation of the QDs in tissues. This is an important finding, suggesting that, at least for this exposure scenario, observed toxicity in subsequent studies can be attributed to the QD and not to free ions. In contrast, Peyrot et al.32 found that uncoated QDs in an aqueous environment aggregated and released cadmium ions. The authors of this study, reported on biodistribution and induction of MT in exposed mussels, finding that the amount of free cadmium ions could explain Cd distribution patterns and MT gene expression changes. A key difference in the QDs used in the current study and that of Peyrot et al.32 is the use of a capping material that offers resistance to degradation and ion release.
Free Cd would be sequestered by MT already present in the tissue or MT that is produced by induction in response to free Cd.33 Exploiting the likely tissue retention kinetic differences can give a quick, easy and inexpensive insight into the integrity of QDs when compared to other definitive methods such as TEM.
Other investigators, using a rodent model and the same PEG QDs used in this study, have used this method of comparing the ratio of cadmium to tellurium. These investigators found an increase in the Cd/Te ratio, but only in the kidney after two weeks of exposure (ratio of approximately 200) through the duration of the 16 week study (at which time the ratio increased to approximately 3500) after a single intravenous injection.25 In the present study, the variance of the ratio was increased in biological tissues, but the average remained the same as the intact QDs. No single tissue, including the kidney seems to be the source of the higher variability, as no significant difference was found in any of the comparisons of time, sex, tissue and QD type made. The source of the variability in the Cd/Te ratio is likely an artifact of quantifying low levels of these analytes in small tissues.
Most studies of QD biodistribution have been conducted in rodent models with biomedical applications using injection as the exposure route. Intravenous injection is used in most studies evaluating the role of surface functionalization on biodistribution; however, this route bypasses first-pass metabolic processes. But despite these studies being conducted in rodent models and by a different route of administration, similar trends in biodistribution are observed. For example, Su and Sun35 did not observe any carboxyl QDs in rat blood 50 minutes post injection while the amino and PEG QDs were found to remain constant in the blood for the 350 minute experimental duration. PEG coatings are often used to prevent biological recognition36,37 so finding these QDs at higher amounts in the blood compared to the carboxyl QDs was expected.
An interesting finding in this study is that uptake in the female gonad of the carboxyl QDs was higher than for the other QD types, and this preference was female specific, as it was not seen in males. This finding raises an interesting hypothesis that QDs, once internalized, form a protein corona of plasma proteins that influence uptake by their target tissues. NM protein corona has been shown to influence biodistribution.38–42 Therefore, it is possible that the carboxyl QDs assume a corona that allows for uptake into the ovary more readily than the other QD types and this same property may make them more bioavailable in females than in males. One possible candidate constituent, amongst many others, is vitellogenin, as it is female specific and is readily incorporated into growing oocytes.
Conclusions
The results of this study suggest that differences in total tissue uptake are mediated by sex (possibly related to fish and/or gut size) and surface functionalization of the QDs. Preferential uptake of carboxyl QDs into the female gonad was observed and suggests a possible mode of reproductive toxicity and maternal transfer that should be investigated in future studies.The result of metal analysis by ICP-MS suggests that the QDs are not appreciably degraded in vivo. To our knowledge, this is the first study to evaluate the uptake and biodistribution of QDs in stomach-less fish exposed via oral gavage. Studies in a gastric fish, like this one, allow for uptake examination without the additional variable of degradation of NMs due to acidic stomach conditions found in other fish. This is an important observation, as distinguishing between particle and ion toxicity will be essential for future regulatory considerations. Future studies could use this model system for determining the toxicity profiles of NMs with different functional groups as well as NMs without capping materials that prevent in vivo degradation.
Acknowledgements
We would like to thank Dr. Georgia Hinkley, Elizabeth Nelson, and John Munson for ICP-MS training. This work was supported by funds from the National Science Foundation (CBET-0853707 and IOS-1407094).References
- A. Nel, T. Xia, L. Madler and N. Li, Science, 2006, 311, 622 CrossRef CAS PubMed.
- R. Owen and M. Depledge, Mar. Pollut. Bull., 2005, 50, 609 CrossRef CAS PubMed.
- A. A. Keller, S. McFerran, A. Lazareva and S. Suh, J. Nanopart. Res., 2013, 15, 1692 CrossRef.
- R. J. Griffitt, R. Weil, K. A. Hyndman, N. D. Denslow, K. Powers, D. Taylor and D. S. Barber, Environ. Sci. Technol., 2007, 41, 8178 CrossRef CAS.
- R. J. Griffitt, K. A. Hyndman, N. D. Denslow and D. S. Barber, Toxicol. Sci., 2009, 107, 404 CrossRef CAS PubMed.
- S. Kashiwada, Environ. Health Perspect., 2006, 114, 1697 CAS.
- R. D. Handy, G. Al-Bairuty, A. Al-Jubory, C. S. Ramsden, D. Boyle, B. J. Shaw and T. B. Henry, J. Fish Biol., 2011, 79, 821 CrossRef CAS PubMed.
- S. Ma and D. Lin, Environ. Sci.: Processes Impacts, 2013, 15, 145 CAS.
- T. M. Scown, R. van Aerle and C. R. Tyler, Crit. Rev. Toxicol., 2010, 40, 653 CrossRef CAS PubMed.
- J. H. Bisesi Jr, J. Merten, K. Liu, A. N. Parks, A. N. Afrooz, J. B. Glenn, S. J. Klaine, A. S. Kane, N. B. Saleh, P. L. Ferguson and T. Sabo-Attwood, Environ. Sci. Technol., 2014, 48, 1973 CrossRef PubMed.
- R. J. Griffitt, C. M. Lavelle, A. S. Kane, N. D. Denslow and D. S. Barber, Aquat. Toxicol., 2013, 130, 192 CrossRef PubMed.
- X. Z. Zhang, H. W. Sun, Z. Y. Zhang, Q. Qian Niua, Y. Chen and J. C. Crittenden, Chemosphere, 2007, 67, 160 CrossRef CAS PubMed.
- B. J. Shaw and R. D. Handy, Environ. Int., 2011, 37, 1083 CrossRef CAS PubMed.
- T. M. Scown, E. M. Santos, B. D. Johnston, B. Gaiser, M. Baalousha, S. Mitov, J. R. Lead, V. Stone, T. F. Fernandes, M. Jepson, R. van Aerle and C. R. Tyler, Toxicol. Sci., 2010, 115, 521 CrossRef CAS PubMed.
- R. Hardman, Environ. Health Perspect., 2006, 114, 165 CrossRef.
- A. M. Iga, J. H. Robertson, M. C. Winslet and A. M. Seifalian, J. Biomed. Biotechnol., 2007, 2007, 76087 Search PubMed.
- T. M. Blickley, C. W. Matson, W. N. Vreeland, D. Rittschof, R. T. Di Giulio and P. D. McClellan-Green, Aquat. Toxicol., 2014, 148, 27 CrossRef CAS PubMed.
- K. L. Leigh, J. L. Bouldin and R. A. Buchanan, Dose-Response, 2012, 10, 331 CrossRef CAS PubMed.
- R. D. Day, D. P. German, J. M. Manjakasy, I. Farr, M. J. Hansen and I. R. Tibbetts, J. Comp. Physiol., B, 2011, 181, 603 CrossRef CAS PubMed.
- L. Wang, D. K. Nagesha, S. Selvarasah, M. R. Dokmeci and R. L. Carrier, J. Nanobiotechnol., 2008, 6, 1 CrossRef PubMed.
- K. M. Jensen, J. J. Korte, M. D. Kahl, M. S. Pasha and G. T. Ankley, Comp. Biochem. Physiol., Part C: Toxicol. Pharmacol., 2001, 128, 127 CrossRef CAS.
- R. J. Hunter, Zeta potential in colloid science: principles and applications, Academic, New York, 1981 Search PubMed.
- A. C. Mehinto, M. S. Prucha, R. C. Colli-Dula, K. J. Kroll, C. M. Lavelle, D. S. Barber, C. D. Vulpe and N. D. Denslow, Aquat. Toxicol., 2014, 152, 186 CrossRef CAS PubMed.
- K. R. Olson, Fish Physiol. Biochem., 1992, 12, 135 Search PubMed.
- C. H. Lin, L. W. Chang, H. Chang, M. H. Yang, C. S. Yang, W. H. Lai, W. H. Chang and P. Lin, J. Nanotechnol., 2009, 20, 215101 CrossRef PubMed.
- Y. Han, G. Xie, Z. Sun, Y. Mu, S. Han, Y. Xiao, N. Liu, H. Wang, C. Guo, X. Shi, Y. Li and P. Huang, J. Nanopart. Res., 2011, 13, 5373 CrossRef CAS.
- N. Liu, Y. Mu, Y. Chen, H. Sun, S. Han, M. Wang, Y. Li, Q. Xu, H. Huang and Z. Sun, Part. Fibre Toxicol., 2013, 10, 9 CrossRef PubMed.
- B. M. Simonet and M. Valcarcel, Anal. Bioanal. Chem., 2009, 393, 17 CrossRef CAS PubMed.
- A. J. Edgington, E. J. Petersen, A. A. Herzing, R. Podila, A. Rao and S. J. Klaine, Nanotoxicology, 2013, 8, 2 CrossRef PubMed.
- J. M. Wilson and L. F. C. Castro, Fish Physiol., 2010, 30, 1 Search PubMed.
- G. Nordberg, Handbook on the Toxicology of Metals, Academic, Amsterdam, 3rd edn, 2007 Search PubMed.
- C. Peyrot, C. Gagnon, F. Gagné, K. J. Willkinson, P. Turcotte and S. Sauvé, Comp. Biochem. Physiol., Part C: Toxicol. Pharmacol., 2009, 150, 246 CrossRef PubMed.
- C. Hogstrand and C. Haux, Comp. Biochem. Physiol., Part C: Toxicol. Pharmacol., 1991, 100, 137 CrossRef CAS.
- L. A. Ba, M. Döring, V. Jamier and C. Jacob, Org. Biomol. Chem., 2010, 8, 4203 CAS.
- C. K. Su and Y. C. Sun, J. Nanotechnol., 2013, 24, 165101 CrossRef PubMed.
- L. Yang, N. Nuraje, H. Bai and H. Matsui, J. Pept. Sci., 2008, 14, 203 CrossRef CAS PubMed.
- G. Prencipe, S. M. Tabakman, K. Welsher, Z. Liu, A. P. Goodwin, L. Zhang, J. Henry and H. Dai, J. Am. Chem. Soc., 2009, 131, 4783 CrossRef CAS PubMed.
- M. E. Akerman, W. C. W. Chan, P. Laakkonen, S. N. Bhatia and E. Ruoslahti, Proc. Natl. Acad. Sci. U. S. A., 2002, 99, 12617 CrossRef CAS PubMed.
- L. Thiele, J. E. Diederichs, R. Reszka, H. P. Merkle and E. Walter, Biomaterials, 2003, 24, 1409 CrossRef CAS.
- D. Dutta, S. K. Sundaram, J. G. Teeguarden, B. J. Riley, L. S. Fifield, J. M. Jacobs, S. R. Addleman, G. A. Kaysen, B. M. Moudgil and T. J. Weber, Toxicol. Sci., 2007, 100, 303 CrossRef CAS PubMed.
- S. Nagayama, K. Ogawara, Y. Fukuoka, K. Higaki and T. Kimura, Int. J. Pharm., 2007, 342, 215 CrossRef CAS PubMed.
- S. Patil, A. Sandberg, E. Heckert, W. Self and S. Seal, Biomaterials, 2007, 28, 4600 CrossRef CAS PubMed.
Footnote |
| † Electronic supplementary information (ESI) available: A figure showing the relationship between fish size and internalized cadmium. See DOI: 10.1039/c5en00122f |
| This journal is © The Royal Society of Chemistry 2015 |

