 Open Access Article
In situ silanization for continuous stationary phase gradients on particle packed LC columns
Anna V.
Forzano
 ,
Caitlin N.
Cain
 ,
Sarah C.
Rutan
 * and
Maryanne M.
Collinson
 *
*
Chemistry Department, Virginia Commonwealth University, 1001 W Main St, Richmond, VA 23284-2006, USA. E-mail: srutan@vcu.edu; mmcollinson@vcu.edu
First published on 3rd July 2019
Abstract
Mobile phase gradients are ubiquitous in liquid chromatography (LC); stationary phase gradients are not. Variation in the ligand density along the length of column can provide an important means to optimize separations. However, a major impediment relates to the development of methodologies to fabricate continuous gradient stationary phases, particularly on particle packed columns. For the first time, we demonstrate an in situ silanization approach based on the controlled rate infusion method to create a stationary phase gradient. This was accomplished by infusing a phenylbutyltrimethoxysilane solution through an in-house particle packed column for 1 h, with one end of the column being exposed longer than the other. Raman spectroscopy reveals a steep gradient over the first centimeter of the column followed by a plateau, indicating successful in situ modification. N2 sorption experiments confirm the organosilane does not block the pores of the silica. The reversed phase (RP) and hydrophilic interaction liquid chromatography (HILIC) nature of the gradient stationary phase were evaluated using hydrophobic and hydrophilic probe analytes. The stability of the retention factors (RSD < 6%) and the column-to-column reproducibility (4% < RSD < 9%) were satisfactory. Surprising differences were observed in the amount of modification and the peak shapes for the gradient versus uniform stationary phases, which are partially attributed the nature of the on-column modification procedure. This work serves as a proof-of-concept for the constructive fabrication of continuous stationary phase gradients on particle packed columns and will hopefully stimulate future developments.
Introduction
Chemical gradients are ubiquitous in liquid chromatography (LC) when referring to mobile phase composition profiles; however, they are much less explored when referring to stationary phase ligand composition. The benefits of varying the ligand concentration along the length of column were first observed in the early 1990s with serially coupled columns1–6 (i.e., a discontinuous stationary phase gradient); however, the creation of a gradient on a continuous stationary support for LC did not come about until 2007, when Fanali et al. filled a capillary with solutions of decreasing hydrophilicities and used thermal polymerization to produce a stationary phase with a continuous hydrophobic gradient.7 Since this work, the fabrication of continuous gradients in the stationary phase for LC has almost exclusively involved monoliths (polymer7–11 and silica11,12), likely due to challenges associated with the formation of a gradient in chemical functionality on particle packed columns. To our knowledge, only one report has appeared on a continuous stationary phase gradient on a particle packed column.13 In that work, the stationary phase gradient was created on a commercially modified C18 column via the time-dependent acid hydrolysis and hydrolytic cleavage of C18 ligands.13 For columns that have already been modified with an organic constituent, this is a viable approach for creating a stationary phase gradient on a packed column. However, there is still a need for the development of an in situ approach for the creation of a chemical gradient on a bare silica packed columns.The interest in stationary phase gradients stems from a chromatographer's desire to improve selectivity and resolution, and provide possible peak focusing when a stationary phase gradient is coupled with a mobile phase gradient.13,14 In contrast to discontinuous gradients, continuous gradients have the added benefit of novel selectivities that could arise from neighboring ligand effects, which can occur when two ligands are adjacent on a single chromatographic support.11,15 Compared to traditional mixed-mode chromatography, which has a fixed ratio between the moieties along the length of the column,16 the ligand ratio on a stationary phase gradient is not constant. Rather, the ligand ratio changes along the length of the column as dictated by the gradient shape or profile. As a result, the ligand ratio is not constant along the length of the column, and depending on the shape or profile of the gradient, unconventional selectivity could arise.11 In order to further investigate this separation paradigm, methods for the fabrication and detailed characterization of continuous stationary phase gradients are required.
In this work, we describe for the first time, an approach to fabricate and characterize a RP-HILIC stationary phase gradient on an in-house packed bare silica column using controlled rate infusion (CRI). This is a method developed by the Collinson group to form chemical gradients on planar substrates such as silicon wafers and thin layer chromatography plates using silane chemistry.17–21 Our research on the use of this methodology to form a stationary phase gradient on a particle packed column in situ first began with the optimization of the type and the concentration of silane, along with the infusion parameters. The finalized method involved infusing a phenylbutyltrimethoxysilane (PBTMOS) solution through a 5 cm long packed column containing particles that are 5 μm in diameter (dp) to generate a phenyl–butyl gradient stationary phase. Uniform phenyl–butyl and uniform bare silica columns were also prepared as references. The columns were characterized with scanning electron microscopy (SEM), nitrogen (N2) sorption, Raman spectroscopy, and LC to fully evaluate this in situ fabrication method. The prime objective of this study was to develop a stable and reproducible method to form continuous stationary phase gradients to further research on their chromatographic behavior.
Experimental
Chemicals and reagents
Spherisorb bare silica particles (dp = 5 μm, 80 Å, 220 m2 g−1) were purchased from Waters. PBTMOS (97%) and phenyltrimethoxysilane (PTMOS, 97%) were purchased from Alfa Aesar. Phosphoric acid (86%, ACS grade) and sodium acetate trihydrate crystal (99%) were purchased from J.T. Baker. Isopropanol (IPA, ACS grade), sodium phosphate monobasic (ACS grade), methanol (HPLC grade), toluene (ACS grade), hydrochloric acid (36.5–38% (w/w)), ammonium hydroxide (28–30% (w/w)), and benzoic acid (99.5%) were obtained from Fisher Scientific. Acetonitrile (ACN, UV grade) was purchased from Honeywell. Ethanol (200 proof, ACS grade) was purchased from Pharmco Aapers. Naphthalene (NAP, 99%), naphthol (NPOH, 98%), 2-aminopyridine (2-AP, 98%), chloroform (HPLC grade, 99.9%), uracil (98%), norepinephrine (NOR, 98%) and tyramine (TY) were purchased from Sigma Aldrich. Sodium hydroxide (97%, ACS grade) was purchased from Amresco. Nitrogen gas was purchased from Praxair. All water had a resistivity of 18.2 MΩ cm and was obtained from a Milli Q system (Millipore Sigma, MA, USA).Column packing
All columns used in this report were packed in-house. Stainless steel ferrules, reducing unions and stainless-steel tubing (0.25′′ × 0.65′′ wall) were obtained from Swagelok. The assembled column casing (50 × 4.6 mm) was attached to a Pack-in-a-Box dual head piston pump (Restek). The pushing solvent was 1![[thin space (1/6-em)]](https://www.rsc.org/images/entities/char_2009.gif) :
:![[thin space (1/6-em)]](https://www.rsc.org/images/entities/char_2009.gif) 1
1![[thin space (1/6-em)]](https://www.rsc.org/images/entities/char_2009.gif) :
:![[thin space (1/6-em)]](https://www.rsc.org/images/entities/char_2009.gif) 1 v/v/v toluene, ethanol, and IPA. The packing slurry was 7% w/v bare silica with 50
1 v/v/v toluene, ethanol, and IPA. The packing slurry was 7% w/v bare silica with 50![[thin space (1/6-em)]](https://www.rsc.org/images/entities/char_2009.gif) :
:![[thin space (1/6-em)]](https://www.rsc.org/images/entities/char_2009.gif) 50 v/v methanol
50 v/v methanol![[thin space (1/6-em)]](https://www.rsc.org/images/entities/char_2009.gif) :
:![[thin space (1/6-em)]](https://www.rsc.org/images/entities/char_2009.gif) chloroform. The slurry was sonicated for 3 to 5 minutes prior to pouring into the packing chamber. Columns were packed for 1 h at 9000 psi and immediately detached from the column packer. A flat spatula was used to scrape any excess silica from the open end of the column, and the column was capped with a reducing union. More information can be found about packing columns in an article by Wahab et al.22
chloroform. The slurry was sonicated for 3 to 5 minutes prior to pouring into the packing chamber. Columns were packed for 1 h at 9000 psi and immediately detached from the column packer. A flat spatula was used to scrape any excess silica from the open end of the column, and the column was capped with a reducing union. More information can be found about packing columns in an article by Wahab et al.22
To verify the columns were chromatographically efficient before modification with CRI, the columns were attached to an LC (see Chromatographic characterization), injected with toluene and uracil (20 μg mL−1 each), and the peak asymmetry factor (AS, see Data analysis) for uracil evaluated using 90% ACN as the mobile phase. The average AS for the columns used to create the phenyl butyl gradients was 1.9 ± 0.23. We recognize that the peak asymmetry of the columns prior to gradient modification is significantly higher than what would be expected for commercial columns. We choose to pack the columns in-house to ensure both the uniform and gradient columns were made from the same materials. Typically, AS should be smaller than ∼1.3 to have a minimal effect on a separation.23
Phenyl–butyl modification
Scheme 1 depicts the procedure used to form gradient (left) and uniform (right) phenyl–butyl columns. The PBTMOS solution was comprised of ethanol![[thin space (1/6-em)]](https://www.rsc.org/images/entities/char_2009.gif) :
:![[thin space (1/6-em)]](https://www.rsc.org/images/entities/char_2009.gif) PBTMOS
PBTMOS![[thin space (1/6-em)]](https://www.rsc.org/images/entities/char_2009.gif) :
:![[thin space (1/6-em)]](https://www.rsc.org/images/entities/char_2009.gif) 0.1 M HCl
0.1 M HCl![[thin space (1/6-em)]](https://www.rsc.org/images/entities/char_2009.gif) :
:![[thin space (1/6-em)]](https://www.rsc.org/images/entities/char_2009.gif) 0.2 M NaOH (906
0.2 M NaOH (906![[thin space (1/6-em)]](https://www.rsc.org/images/entities/char_2009.gif) :
:![[thin space (1/6-em)]](https://www.rsc.org/images/entities/char_2009.gif) 140
140![[thin space (1/6-em)]](https://www.rsc.org/images/entities/char_2009.gif) :
:![[thin space (1/6-em)]](https://www.rsc.org/images/entities/char_2009.gif) 200
200![[thin space (1/6-em)]](https://www.rsc.org/images/entities/char_2009.gif) :
:![[thin space (1/6-em)]](https://www.rsc.org/images/entities/char_2009.gif) 80, v/v/v/v). To prepare the solution, ethanol, PBTMOS, and 0.1 M HCl were mixed for three hours and 45 minutes. NaOH (0.2 M) was added and the solution was stirred for another 15 minutes, totaling 4 h of stirring or 4 h of acid-catalyzed hydrolysis. Prior to modification to form the uniform phenyl–butyl material, bare silica was sonicated with ethanol for 30 minutes. Particles were centrifuged for 5 minutes at 2000g to remove ethanol. PBTMOS solution was added to a glass vial to prepare a 60% (v/w) PBTMOS solution
80, v/v/v/v). To prepare the solution, ethanol, PBTMOS, and 0.1 M HCl were mixed for three hours and 45 minutes. NaOH (0.2 M) was added and the solution was stirred for another 15 minutes, totaling 4 h of stirring or 4 h of acid-catalyzed hydrolysis. Prior to modification to form the uniform phenyl–butyl material, bare silica was sonicated with ethanol for 30 minutes. Particles were centrifuged for 5 minutes at 2000g to remove ethanol. PBTMOS solution was added to a glass vial to prepare a 60% (v/w) PBTMOS solution![[thin space (1/6-em)]](https://www.rsc.org/images/entities/char_2009.gif) :
:![[thin space (1/6-em)]](https://www.rsc.org/images/entities/char_2009.gif) bare silica and the vial was placed on a rotisserie (LabQuake Vial Rotator, Barnstead Thermolyne) for 4 h. The particles were centrifuged for 5 minutes at 2000g to remove the PBTMOS solution and placed in a 40 °C oven overnight. The modified particles were heated at 160 °C for 1 h, allowed to cool and sonicated with ethanol for 15 minutes. The particles were centrifuged for 5 minutes at 2000g to remove ethanol and the particles were packed according to the procedure described earlier.
bare silica and the vial was placed on a rotisserie (LabQuake Vial Rotator, Barnstead Thermolyne) for 4 h. The particles were centrifuged for 5 minutes at 2000g to remove the PBTMOS solution and placed in a 40 °C oven overnight. The modified particles were heated at 160 °C for 1 h, allowed to cool and sonicated with ethanol for 15 minutes. The particles were centrifuged for 5 minutes at 2000g to remove ethanol and the particles were packed according to the procedure described earlier.
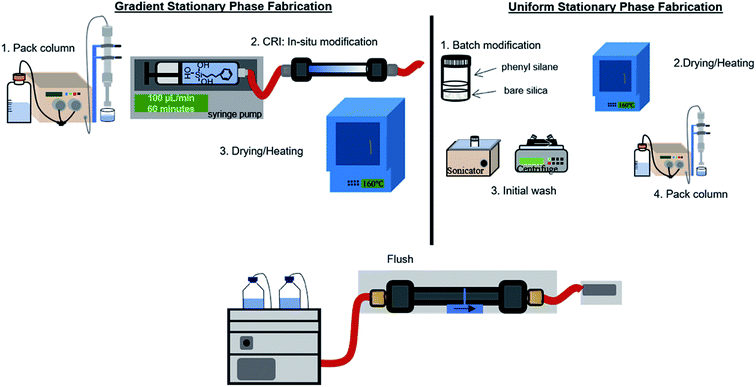 | ||
| Scheme 1 Procedure for the fabrication of gradient and uniform phenyl–butyl particle packed columns for LC. | ||
To prepare the gradient phenyl–butyl columns, a PBTMOS solution was prepared as described above. A bare silica column (50 × 4.6 mm, 5 μm, 80 Å) was flushed at 1 mL min−1 with ethanol for 60 column volumes (VM). A syringe pump (260D Syringe Pump with Controller, Teledyne) was used to infuse 6 mL of the PBTMOS solution at 100 μL−1 min for 1 h over the bare silica column, exposing the entrance of the column to the hydrolyzed silane 6 minutes longer than the exit of the column. The column was back flushed with N2 (g) for 3 minutes at 100 PSI to encourage drying and then placed in a 40 °C oven overnight. The column was heated to 160 °C for 1 h, allowed to cool, and back flushed using an LC pump (1100 series, Agilent Technologies) with 1000VM ethanol![[thin space (1/6-em)]](https://www.rsc.org/images/entities/char_2009.gif) :
:![[thin space (1/6-em)]](https://www.rsc.org/images/entities/char_2009.gif) toluene (1
toluene (1![[thin space (1/6-em)]](https://www.rsc.org/images/entities/char_2009.gif) :
:![[thin space (1/6-em)]](https://www.rsc.org/images/entities/char_2009.gif) 1, v/v), 120VM ACN, 120VM 10 mM sodium acetate salt solution (pH 7.4 ± 0.05), 120VM water, and 120VM ACN. This extensive washing method is necessary to remove any excess reagent on the column. The use of sodium acetate minimizes any electrostatic interactions between hydrolyzed PBTMOS and the unreacted surface silanol groups.24,25
1, v/v), 120VM ACN, 120VM 10 mM sodium acetate salt solution (pH 7.4 ± 0.05), 120VM water, and 120VM ACN. This extensive washing method is necessary to remove any excess reagent on the column. The use of sodium acetate minimizes any electrostatic interactions between hydrolyzed PBTMOS and the unreacted surface silanol groups.24,25
Physical and chemical characterization
Once the columns were fully characterized chromatographically (see Chromatographic characterization) the silica was unpacked from the column for chemical and physical characterization with Raman spectroscopy, gas sorption, and SEM imaging.Columns were flushed with 10VM of IPA prior to extrusion to fully wet the column bed. The entrance reducing union of the column was removed and the column was attached to an LC pump (1100 series, Agilent Technologies). The pump was set to flow IPA at 0.2 mL min−1. The particles were pushed out slowly and 0.5 cm slices of the bed were obtained, totaling 10 slices from each column. The particles were dried overnight in a 40 °C oven prior to any analysis.
Samples containing 80–90% (w/v) particles![[thin space (1/6-em)]](https://www.rsc.org/images/entities/char_2009.gif) :
:![[thin space (1/6-em)]](https://www.rsc.org/images/entities/char_2009.gif) ethanol were prepared from each slice of the column (every 0.5 cm), which totals ten samples to evaluate the phenyl–butyl modification on the surface of silica. The solution was pipetted on to glass slides and dried briefly. The glass slides were placed on a Raman microscope using a 10× objective (LABRam HR Evolution Confocal Raman Spectrometer, Horiba) and three points (∼300 μm apart) were collected from each sample. The acquisition parameters were: 532 nm laser (50% power), spectral range from 900–3200 cm−1, 5 second acquisition time, with 24 accumulations, 600 g mm−1 grating, 300 μm slit and 1000 μm pin hole. The laser spot size was ∼2.6 μm.
ethanol were prepared from each slice of the column (every 0.5 cm), which totals ten samples to evaluate the phenyl–butyl modification on the surface of silica. The solution was pipetted on to glass slides and dried briefly. The glass slides were placed on a Raman microscope using a 10× objective (LABRam HR Evolution Confocal Raman Spectrometer, Horiba) and three points (∼300 μm apart) were collected from each sample. The acquisition parameters were: 532 nm laser (50% power), spectral range from 900–3200 cm−1, 5 second acquisition time, with 24 accumulations, 600 g mm−1 grating, 300 μm slit and 1000 μm pin hole. The laser spot size was ∼2.6 μm.
Pore size distribution determination was performed by obtaining N2 adsorption and desorption isotherms of the uniform phenyl–butyl, uniform bare silica, gradient phenyl–butyl columns (Quantachrome NOVA 2200e Surface Area and Pore Analyzer, Anton Parr). Samples of dried particles (0.35–0.6 g) were weighed out from positions: 0, 2.5, and 5 cm along each column. The samples were degassed at 100 °C for at least 12 h.
Barrett–Joyner–Halenda (BJH)26 analysis was used to determine pore size distributions. The measurements were performed in duplicate and averaged.
SEM was used to investigate if the particle shapes or diameters were altered after gradient modification. A particle slurry (80–90% (w/v) particles![[thin space (1/6-em)]](https://www.rsc.org/images/entities/char_2009.gif) :
:![[thin space (1/6-em)]](https://www.rsc.org/images/entities/char_2009.gif) ethanol) was prepared using particles at the 0.5, 2.5 and 5 cm positions along each column. The solution was pipetted onto conductive carbon tape and dried. The particles were sputter coated with platinum for 90 seconds at 2.2 kV. Images were obtained with a SU-70 FE-SEM (Hitachi). Particle analysis was performed with ImageJ 1.52a software (National Institutes of Health), where 500 particles were measured22 for bare silica samples and gradient samples (at the high phenyl–butyl region) to confirm that there was no change in particle diameter after modification.
ethanol) was prepared using particles at the 0.5, 2.5 and 5 cm positions along each column. The solution was pipetted onto conductive carbon tape and dried. The particles were sputter coated with platinum for 90 seconds at 2.2 kV. Images were obtained with a SU-70 FE-SEM (Hitachi). Particle analysis was performed with ImageJ 1.52a software (National Institutes of Health), where 500 particles were measured22 for bare silica samples and gradient samples (at the high phenyl–butyl region) to confirm that there was no change in particle diameter after modification.
Chromatographic characterization
Chromatographic characterization of uniform phenyl–butyl, uniform bare silica, and gradient phenyl–butyl columns was performed for comparison purposes. The columns were attached to a LC-DAD (1260 Infinity, Agilent Technologies, CA, USA) and chromatographic runs were 1 μL injections performed at 1 mL min−1, with the column oven set to 40 °C. The DAD collected spectra from 190–400 nm, with a sampling interval of 2 nm. The mobile phase consisted of solvent A: 5 mM phosphate buffer (pH 2.5 ± 0.05) and solvent B: ACN.The stability of the uniform and gradient phenyl–butyl columns was evaluated through a sequence of 500 injections of NAP (20 μg mL−1) with 80![[thin space (1/6-em)]](https://www.rsc.org/images/entities/char_2009.gif) :
:![[thin space (1/6-em)]](https://www.rsc.org/images/entities/char_2009.gif) 20 A
20 A![[thin space (1/6-em)]](https://www.rsc.org/images/entities/char_2009.gif) :
:![[thin space (1/6-em)]](https://www.rsc.org/images/entities/char_2009.gif) B as the mobile phase.
B as the mobile phase.
Isocratic characterization of uniform phenyl–butyl, uniform bare silica, and gradient phenyl–butyl columns was performed at 2, 10, 20, 30, 40, 50, 60, 70, and 80% B. Mixtures of benzoic acid, 2-aminopyridine, and naphthol (each 20 μg mL−1) made in solvents matching the mobile phase compositions were used to probe the retention characteristics of the stationary phases. A mixture of naphthalene, naphthol, tyramine, norepinephrine, and 2-aminopyridine (each 20 μg mL−1) were made up in 70% ACN, and injected on the uniform and gradient phenyl–butyl and uniform bare silica columns at 70% ACN to better understand the asymmetry factor.
Data analysis
Chromatographic data were converted from Agilent *.D files to MATLAB *.mat files using ACD/Lab Spectrus Processor (Advanced Chemical Development, Inc., Toronto, Canada). MATLAB version R2017b (Mathworks, Inc, MA, USA) was used to resolve single analyte signals from the background and each other by performing multivariate curve resolution-alternating least squares (MCR-ALS) using an in-house built program.27 An in-depth description of MCR-ALS can be found in the literature.28 The pure chromatographic profile of each analyte produced from MCR-ALS was used to determine retention times and peak widths using statistical moment calculations, | (1) |
 | (2) |
 | (3) |
Background noise from fluorescence of the silica powder was observed in the Raman spectra. To subtract the fluorescence background, the raw data were smoothed with Savitzky–Golay filter that produced a smoothed baseline that was subtracted from the raw data.30 Numerical integration of the 999.4 cm−1 band was then carried out on the background subtracted data.
Results and discussion
Fabrication of stationary phase gradient columns
Constructive CRI (i.e., adding ligands to a substrate) is a cost-efficient and straightforward method to produce multicomponent chemical gradients on silica supports, by exposing one end of a substrate longer than another to a hydrolyzed organosilane solution.17–21,31,32 Adaption of constructive CRI to a particle packed column that is suitable for LC, however, has not been attainable until now. Compared to planar substrates and monolithic columns, the time-dependent modification of a traditional LC packed column in situ is much more challenging, not only because of the increased back pressure required for infusion into a packed column, but also because of the high surface area and microporosity of the silica powder. Additionally, porous particle columns have a lower permeability relative to monoliths,33 which could potentially cause stagnant modification solution and unintentional heterogeneous modification.The first step for gradient formation on a packed column involves optimization of the experimental parameters. In this work, the organoalkoxysilane (PTMOS vs. PBTMOS), the organoalkoxysilane solution (concentration (11 vs. 30% v/v), degree of hydrolysis (4, 12, 24 h)) and infusion parameters (infusion rate and volume (2 and 100 μL min−1; 0.6 and 6 mL)) were specifically optimized, as these parameters strongly affect the degree of modification and hence the retention factors, peak shape, reproducibility, and long term stability. Using the retention factor (k), % RSD of k, and peak shape for a nonpolar compound (naphthalene (kNAP) or naphthol (kNPOH)) with a 20% ACN mobile phase composition (n = 3 gradient columns) and a trial and error approach, the set of conditions that yielded columns with quantitatively reliable performances were found. The stationary phase gradients described herein were fabricated from a 6 mL PBTMOS sol (11% v/v) hydrolyzed for 4 h and infused at a flow rate of 100 mL min−1 for 1 h, as these yielded the best results in terms of retention factor, peak shape, stability, and reproducibility.
Characterization of phenyl–butyl gradient and uniformly modified stationary phases
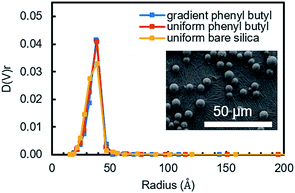
The as-synthesized uniform and gradient modified columns were characterized using a number of different physical and chemical characterization tools. To ensure the organosilane did not over-polymerize and block the pores in the silica powder, which will result in poor mass transfer, N2 sorption experiments were undertaken. Fig. 1 shows the pore size distribution obtained from the packing material extruded from a uniform and gradient (at the high phenyl–butyl region, 0.5–1.0 cm) phenyl–butyl column. A comparison was also made to bare silica. As can be seen in Fig. 1, the pore size distributions are almost identical indicating the pores of the modified silica powder are not obstructed. Using BJH theory, the pore diameters were 76.8 ± 0.5, 77.2 ± 0.4, and 77.2 ± 0.2 Å for each of the three columns (uniform bare silica, gradient phenyl–butyl, and uniform phenyl–butyl, respectively). The uniform (red) and gradient (blue) phenyl–butyl pore size distributions are slightly narrower than the uniform bare silica (yellow), likely due to the modification filling in some of the smaller pores.In addition to porosity measurements, SEM was also used to inspect the particles after modification to determine if particle diameter significantly changed after CRI. Over modification, which would be evident by a change in diameter, would broaden chromatographic peaks and decrease the efficiency.
SEM images were obtained for particles at the entrance of a gradient column (high degree of modification, Fig. 1 inset) and for a bare silica sample for comparison. Using ImageJ, the diameter of 500 particles per sample (n = 3 samples) were obtained and found to be equivalent to for bare silica (5.24 ± 0.17) and gradient particles (5.20 ± 0.09). Thus, it can be concluded that the chosen CRI parameters do not affect the diameter of the particles.
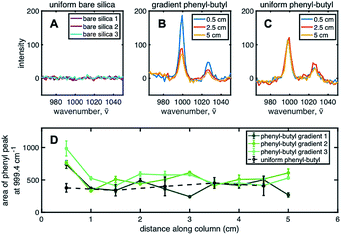
To chemically prove the existence of a stationary phase gradient, Raman spectroscopy was used on individual sections of the extruded column. The phenyl group shows a distinct stretching band near ∼1000 cm−1 due to strong in-phase ring stretching or breathing.34 To complete the analysis, ten points (or samples) along the length of the column, each ∼0.5 cm apart were used to define the gradient profile. Three spots, ∼300 μm apart, for each sample were irradiated with the 532 nm laser and averaged together to obtain spectra shown in Fig. 2B. Three Raman spectra for uniform bare silica, gradient phenyl–butyl, and uniform phenyl–butyl, respectively, are shown for comparison. The aromatic band can be clearly seen at 999.4 cm−1 on the modified silica (Fig. 2B and C), but not on bare silica (Fig. 2A), indicative of the presence of phenyl modification. Fig. 2B and C Raman spectra are from the entrance (0.5 cm, blue), middle (2.5 cm, red), and end (5.0 cm, yellow) of the gradient and uniform phenyl–butyl columns.
In Fig. 2C, for the uniform column, the three Raman spectra obtained from three different regions of the column are identical whereas in Fig. 2B, for the gradient column, the intensity is significantly larger at the entrance relative to the exit for all three columns. Quantitative assessment of the gradient profile was accomplished by measuring the area under the 999.4 cm−1 aromatic vibration. Fig. 2D shows the individual gradient profiles, where the area under the phenyl peak is plotted versus the distance along the column. A steep gradient can be noted along the first ∼20% of each of the three gradient columns. The phenyl–butyl modification associated with the first section of the gradient is significantly greater than the last section. Investigation of the total amount of phenyl–butyl deposited on each column was undertaken by summing the area of the 999.4 cm−1 peak for the three gradient columns, producing a % RSD of 15.2. This level of precision is deemed acceptable given the challenges associated with silane reactions because of their sensitivity to small variations in temperature, humidity, and silanol density.
Upon further examination of Fig. 2D, it can be seen that the area under the ∼1000 cm−1 band at the head of the gradient column is more than double that obtained on the uniform phenyl–butyl columns indicating that more phenyl groups are deposited on the surface of the particles during CRI versus ex situ batch modification. This is surprising given that the exposure time of the silica to the organosilane is 4× shorter during gradient formation. In other words, this represents an ∼200% increase in phenyl–butyl modification with an 75% reduction in reaction time.
Chromatographic characterization
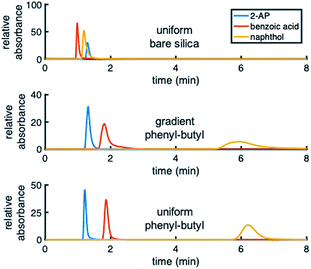
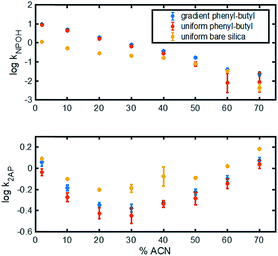
Different test mixtures were used to evaluate analyte retention, stability of modification, reproducibility between columns, and peak asymmetry (AS). The degree of modification of the stationary phase gradient columns was first evaluated by comparing chromatograms on uniform bare silica and phenyl–butyl columns to those on gradient phenyl–butyl columns (Fig. 3). The bare silica column produces a different elution order of 2-AP, benzoic acid and naphthol relative to the phenyl–butyl modified columns, indicating successful addition of phenyl–butyl to the silica. As expected, phenyl–butyl modified columns retain the relatively nonpolar probe analyte (naphthol) longer than the other more polar analytes, 2-AP and benzoic acid.In the top panel of Fig. 4, the retention factors of naphthol vs. mobile phase composition are plotted, and as can be seen, naphthol is more retained on both modified columns relative to the bare silica column. Also noteworthy in Fig. 4 (top) is the approximate linear relationship between log![[thin space (1/6-em)]](https://www.rsc.org/images/entities/char_2009.gif) k vs. % ACN for the gradient and uniform phenyl–butyl columns. Such plots can assist in the elucidation of the separation mechanisms present.35 The linear correlation between log
k vs. % ACN for the gradient and uniform phenyl–butyl columns. Such plots can assist in the elucidation of the separation mechanisms present.35 The linear correlation between log![[thin space (1/6-em)]](https://www.rsc.org/images/entities/char_2009.gif) kNPOH and % ACN with a negative slope in Fig. 4 (top) suggests RP behavior from the phenyl–butyl ligand. Fig. 4 (bottom) plots the relationship between the log of the retention factor of a more polar analyte, 2-AP, at various % ACN on uniform bare silica (yellow), gradient phenyl–butyl (blue) and uniform phenyl–butyl (red). A U-shaped plot can be noted for all three columns. The presence of a minimum, which in this case appears around 30–40% ACN, indicates there is a change in the separation mechanism. The dominant mechanism is no longer RP, but HILIC. Overall, the retention of the polar 2-AP is higher on the bare silica relative to the uniform and gradient phenyl–butyl, which is expected. The U-shape seen for both the uniform and gradient phenyl–butyl columns, also indicates that both columns have silanol groups available for HILIC interactions. Endcapping of the uniform phenyl–butyl was purposely not performed to ensure that the uniform phenyl–butyl was a true positive control relative to the gradient.
kNPOH and % ACN with a negative slope in Fig. 4 (top) suggests RP behavior from the phenyl–butyl ligand. Fig. 4 (bottom) plots the relationship between the log of the retention factor of a more polar analyte, 2-AP, at various % ACN on uniform bare silica (yellow), gradient phenyl–butyl (blue) and uniform phenyl–butyl (red). A U-shaped plot can be noted for all three columns. The presence of a minimum, which in this case appears around 30–40% ACN, indicates there is a change in the separation mechanism. The dominant mechanism is no longer RP, but HILIC. Overall, the retention of the polar 2-AP is higher on the bare silica relative to the uniform and gradient phenyl–butyl, which is expected. The U-shape seen for both the uniform and gradient phenyl–butyl columns, also indicates that both columns have silanol groups available for HILIC interactions. Endcapping of the uniform phenyl–butyl was purposely not performed to ensure that the uniform phenyl–butyl was a true positive control relative to the gradient.
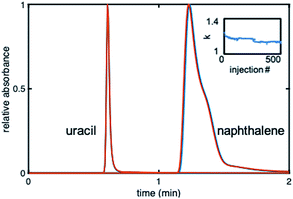
The stability of the gradient columns was assessed with 500 injections36 of uracil (dead time marker) and naphthalene (20 μg mL−1 each) at 40% ACN. Fig. 5 shows overlaid chromatograms for the 50th and 500th injection at 40% ACN. The kNAP value for the 500 injections was calculated using the first statistical moment from naphthalene and uracil peaks for each injection. The 500 kNAP values were plotted versus injection number to elucidate any trends. The retention factor drops by ∼5% for the first 50 injections, and then begins to level off (Fig. 5 inset).
It was thus established that 50 equilibration injections (or 166VM of mobile phase) are needed before retention on the gradient stabilizes. Using injections #50 and #500, the % RSDstability was calculated to be between 0.45 and 5.05% for n = 3 columns. It can therefore be concluded that the gradient columns were stable, since the % RSDstability for all three columns is under 7%, which is acceptable for the lifetime of a column.37 Further investigation of stability was accomplished by calculating the % kNAP loss for each column. The % kNAP loss was found to be 0.51–6.8% (n = 3 columns) for the gradient modified columns. The largest % kNAP loss was under 7%.37 Based on these results it can be concluded that this in situ modification method was successful for producing stable gradient columns.
The reproducibility of gradient column fabrication was also assessed chromatographically. Table 1 shows retention factors of a test mixture comprised of 2-AP, benzoic acid, and naphthol. The RSD values for k2-AP, kBA, and kNPOH for the gradient columns are all under 10%, which confirms the suitability of these CRI conditions for reproducibly modifying columns for LC applications.
| 2-AP | Benzoic acid | Naphthol | |
|---|---|---|---|
| Gradient 1 | 0.47 | 0.63 | 2.13 |
| Gradient 2 | 0.45 | 0.61 | 2.00 |
| Gradient 3 | 0.43 | 0.54 | 1.77 |
| % RSD | 4.64 | 8.23 | 9.15 |
Peak symmetry on gradient stationary phases
Upon examination of the chromatograms, it can be noted that the more hydrophobic analytes (e.g., naphthol, naphthalene) have peak shapes that are asymmetric, with AS factors well above 2. For example, naphthalene in Fig. 5 has an AS = 3.8. ± 0.6 (n = 3 columns) at 40% ACN. For naphthol in Fig. 3 (middle), AS = 4.4 ± 1.3 (n = 3 columns) at 2% ACN. These analytes have significantly better peak shape on the uniformly phenyl–butyl modified column (e.g., Fig. 3 (bottom) with AS,NAP = 2.12 ± 0.14 (n = 3 columns)). Overloading was ruled out as a cause by decreasing the concentration of naphthalene from 20 to 10 and 5 μg mL−1. In spite of the lower concentrations, the tail of the peak remained.Interestingly, the materials used to fabricate the uniform and gradient columns (e.g., bare silica and silane solution) are identical. Other than the spatial positions of the phenyl–butyl along the column, the only difference between the gradient and uniform columns relates to their method of modification. Gradients columns are made in situ via CRI, while the uniform columns are made ex situ in a batch mode (particles are modified first and then packed into the column). Before gradient modification, the particle packed silica columns have AS = 1.9 ± 0.2 (n = 3 columns) indicative that this observation is not related to the column packing.
To further demonstrate that the asymmetric peak shape is not the result of inefficient packing, a series of polar and nonpolar analytes (naphthol (NPOH), naphthalene (NAP), tyramine (TY), norepinephrine (NOR), and 2-AP) were injected on the gradient column and isocratically separated under a HILIC condition of 70% ACN, Fig. 6. From visual inspection of the chromatogram, it can be concluded that the peak shape of all the analytes (even retained ones) are significantly more symmetric (AS ≤ 2.2 ± 0.4 (n = 3 columns)) relative to those obtained under RP conditions, e.g., 2% ACN (see Fig. 3 (middle)).
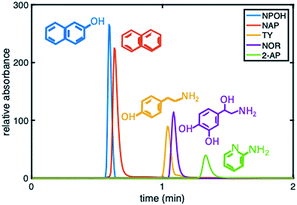 | ||
Fig. 6 Chromatogram depicting the separation of five probe compounds of varying polarity with a 30![[thin space (1/6-em)]](https://www.rsc.org/images/entities/char_2009.gif) : :![[thin space (1/6-em)]](https://www.rsc.org/images/entities/char_2009.gif) 70 5 mM phosphate buffer, pH 2.5 70 5 mM phosphate buffer, pH 2.5![[thin space (1/6-em)]](https://www.rsc.org/images/entities/char_2009.gif) : :![[thin space (1/6-em)]](https://www.rsc.org/images/entities/char_2009.gif) ACN on a phenyl–butyl gradient stationary phase. ACN on a phenyl–butyl gradient stationary phase. | ||
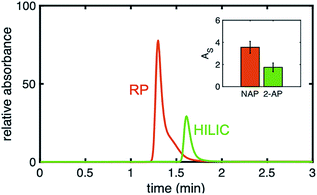
In Fig. 7, a direct comparison of the same gradient column using a nonpolar analyte, naphthol, under RP conditions and using a polar analyte, 2-AP under HILIC conditions is shown. Even though it is the same column, the injected analytes have very different peak symmetries (AS,NPOH = 3.6 ± 0.6, AS,2-AP = 2.2 ± 0.4), meaning when hydrophobic analytes interact with the phenyl–butyl gradients under RP conditions, unexpected peak shapes are produced. Again, this illustrates that column packing is not the cause of the asymmetric peaks.
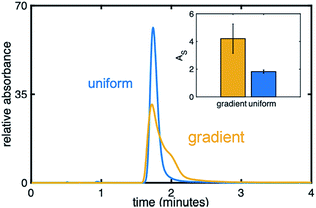
Fig. 8 compares an injection of naphthol on a uniform (blue) and gradient (yellow) phenyl–butyl column at 20% ACN, a RP condition, while the inset depicts AS values. The injection of naphthol on the gradient stationary phase gives rise to a significantly higher AS relative to that observed on the uniform phenyl–butyl columns even through naphthol has a similar retention time on both columns. The appearance of an extra shoulder on the chromatographic peak obtained using the phenyl–butyl gradient column indicates a small fraction of the analyte is more strongly retained than the rest of the population, suggesting the possible presence of strong adsorption sites. Such sites, and thus the observed asymmetric peaks, are not seen on the uniform phenyl–butyl columns. We also don't believe that tailing is caused by free silanol groups, as nonpolar compounds, such as naphthalene, also show significant peak asymmetries.
One possible explanation for the peak asymmetry observed for the hydrophobic analytes on the gradient columns can be related to the distribution of phenyl groups on the surface of the silica particles due to differences in the way the silica particles are modified. Ex situ modification of the silica powder is expected to lead to a more even distribution of phenyl groups on the silica particles; on-column modification may produce phase separated domains38,39 and thus the creation of strong adsorption sites.
For the uniformly modified column, the particles and phenyl–butyl silane are combined in a vial and placed on a rotisserie before being pressure-packed to create the column. For the gradient columns, modification is achieved in situ by flowing the silane through the packed bed followed by back flushing the residual silane out of the column with nitrogen. These important differences in exposure of the particles to the modifying silane may result in different orientations and densities of phenyl–butyl on the silica surface, particularly near the entrance. In fact, a higher density of phenyl groups is noted on the entrance of the gradient columns from the Raman experiments (Fig. 2D) as is the clustering of phenyl moieties near the entrance of the column. These peak broadening effects seen solely on the gradient columns demonstrate the interesting and complex behavior that chemical gradients can introduce, which warrants additional research. Future work includes creation of gradients with other ligands to investigate if this effect is unique to the phenyl–butyl ligand.
Conclusion
Simulation14 and experimental11,13 data have demonstrated that continuous stationary phase gradients can offer novel selectivity and the potential for peak focusing. However, the fabrication of such gradients on particle packed columns is a major challenge and thus a significant obstacle to furthering research on continuous stationary phase gradient columns. Overcoming this hurdle involves the creation of a method to produce these columns via in situ modification. In this report, a time-based in situ method for the formation of a continuous phenyl–butyl multifunctional gradient stationary phase is described. The type of silane, infusion parameters, and modification/drying procedures were optimized to fabricate stable (% RSD < 6) and reproducible (% RSD < 10) continuous stationary phase gradients on particle packed columns. The gradient profile was confirmed with Raman spectroscopy. While the shapes of the chromatographic peaks indicate complex interactions, it is noteworthy that there are limited reports of in situ modification of particle LC columns, indicating that in situ modification is highly complex. Establishing a method of fabrication leads to the possibility to study the chromatographic behavior (i.e., increased resolution and undiscovered selectivities) on these unprecedented stationary phases. This work represents the first step towards realizing this goal. Continuation of this work will begin with increasing the chromatographic performance of this method, potentially using capillary columns, as well as modelling the dependence of the shape/slope of the gradient profile as a function of the synthetic experimental conditions.Conflicts of interest
The authors declare that there are no conflicts of interest.Acknowledgements
We gratefully acknowledge support for this work by the U.S. National Science Foundation Grant CHE-1609449. The authors also acknowledge the Nanomaterials Core Characterization Facility at Virginia Commonwealth University for use of the Raman microscope and SEM and Drs. Lena Jeong, Daniel Cook, and Joseph Turner for their helpful conversations and insights.References
- Y. Mao and P. W. Carr, Adjusting Selectivity in Liquid Chromatography by Use of the Thermally Tuned Tandem Column Concept, Anal. Chem., 2000, 72(1), 110–118 CrossRef CAS PubMed.
- S. Nyiredy, Z. Szűcs and L. Szepesy, Stationary-Phase Optimized Selectivity LC (SOS-LC): Separation Examples and Practical Aspects, Chromatographia, 2006, 63(S13), S3–S9 CrossRef CAS.
- S. Nyiredy, Z. Szucs and L. Szepesy, Stationary Phase Optimized Selectivity Liquid Chromatography: Basic Possibilities of Serially Connected Columns Using the “PRISMA” Principle, J. Chromatogr. A, 2007, 1157(1–2), 122–130 CrossRef CAS PubMed.
- T. Alvarez-Segura, C. Ortiz-Bolsico, J. R. Torres-Lapasió and M. C. García-Álvarez-Coque, Serial versus Parallel Columns Using Isocratic Elution: A Comparison of Multi-Column Approaches in Mono-Dimensional Liquid Chromatography, J. Chromatogr. A, 2015, 1390, 95–102 CrossRef CAS PubMed.
- J. Haggarty, M. Oppermann, M. J. Dalby, R. J. Burchmore, K. Cook, S. Weidt and K. E. V. Burgess, Serially Coupling Hydrophobic Interaction and Reversed-Phase Chromatography with Simultaneous Gradients Provides Greater Coverage of the Metabolome, Metabolomics, 2015, 11(5), 1465–1470 CrossRef CAS PubMed.
- T. Alvarez-Segura, J. R. Torres-Lapasió, C. Ortiz-Bolsico and M. C. García-Alvarez-Coque, Stationary Phase Modulation in Liquid Chromatography through the Serial Coupling of Columns: A Review, Anal. Chim. Acta, 2016, 923, 1–23 CrossRef CAS PubMed.
- A. Maruška, A. Rocco, O. Kornyšova and S. Fanali, Synthesis and Evaluation of Polymeric Continuous Bed (Monolithic) Reversed-Phase Gradient Stationary Phases for Capillary Liquid Chromatography and Capillary Electrochromatography, J. Biochem. Biophys. Methods, 2007, 70(1), 47–55 CrossRef PubMed.
- S. Currivan, D. Connolly, E. Gillespie and B. Paull, Fabrication and Characterisation of Capillary Polymeric Monoliths Incorporating Continuous Stationary Phase Gradients, J. Sep. Sci., 2010, 33(4–5), 484–492 CrossRef CAS PubMed.
- S. Currivan, D. Connolly and B. Paull, Production of Novel Polymer Monolithic Columns, with Stationary Phase Gradients, Using Cyclic Olefin Co-Polymer (COC) Optical Filters, Analyst, 2012, 137(11), 2559 RSC.
- S. Currivan, D. Connolly and B. Paull, Stepped Gradients on Polymeric Monolithic Columns by Photoinitiated Grafting, J. Sep. Sci., 2015, 38(21), 3795–3802 CrossRef CAS PubMed.
- V. C. Dewoolkar, L. N. Jeong, D. W. Cook, K. M. Ashraf, S. C. Rutan and M. M. Collinson, Amine Gradient Stationary Phases on In-House Built Monolithic Columns for Liquid Chromatography, Anal. Chem., 2016, 88(11), 5941–5949 CrossRef CAS PubMed.
- D. N. Bassanese, A. Soliven, X. A. Conlan, R. A. Shalliker, N. W. Barnett and P. G. Stevenson, A Non-Destructive Test to Assess the Axial Heterogeneity of in situ Modified Monoliths for HPLC, Anal. Methods, 2015, 7(17), 7177–7185 RSC.
- C. N. Cain, A. V. Forzano, S. C. Rutan and M. Collinson, Destructive Stationary Phase Gradients for Reversed-Phase/Hydrophilic Interaction Liquid Chromatography, J. Chromatogr. A, 2018, 1570, 82–90 CrossRef CAS PubMed.
- L. N. Jeong and S. C. Rutan, Simulation of Elution Profiles in Liquid Chromatography – III. Stationary Phase Gradients, J. Chromatogr. A, 2018, 1564, 128–136 CrossRef CAS PubMed.
- L. N. Jeong, R. Sajulga, S. G. Forte, D. R. Stoll and S. C. Rutan, Simulation of Elution Profiles in Liquid Chromatography – I: Gradient Elution Conditions, and with Mismatched Injection and Mobile Phase Solvents, J. Chromatogr. A, 2016, 1457, 41–49 CrossRef CAS PubMed.
- L. Zhang, Q. Dai, X. Qiao, C. Yu, X. Qin and H. Yan, Mixed-Mode Chromatographic Stationary Phases: Recent Advancements and Its Applications for High-Performance Liquid Chromatography, TrAC, Trends Anal. Chem., 2016, 82, 143–163 CrossRef CAS.
- B. Kannan, D. Dong, D. A. Higgins and M. M. Collinson, Profile Control in Surface Amine Gradients Prepared by Controlled-Rate Infusion, Langmuir, 2011, 27(5), 1867–1873 CrossRef CAS PubMed.
- B. Kannan, M. A. Marin, K. Shrestha, D. A. Higgins and M. M. Collinson, Continuous Stationary Phase Gradients for Planar Chromatographic Media, J. Chromatogr. A, 2011, 1218(52), 9406–9413 CrossRef CAS PubMed.
- B. Kannan, D. A. Higgins and M. M. Collinson, Aminoalkoxysilane Reactivity in Surface Amine Gradients Prepared by Controlled-Rate Infusion, Langmuir, 2012, 28(46), 16091–16098 CrossRef CAS PubMed.
- S. L. Stegall, K. M. Ashraf, J. R. Moye, D. A. Higgins and M. M. Collinson, Separation of Transition and Heavy Metals Using Stationary Phase Gradients and Thin Layer Chromatography, J. Chromatogr. A, 2016, 1446, 141–148 CrossRef CAS PubMed.
- V. C. Dewoolkar, B. Kannan, K. M. Ashraf, D. A. Higgins and M. M. Collinson, Amine-Phenyl Multi-Component Gradient Stationary Phases, J. Chromatogr. A, 2015, 1410, 190–199 CrossRef CAS PubMed.
- M. F. Wahab, D. C. Patel, R. M. Wimalasinghe and D. W. Armstrong, Fundamental and Practical Insights on the Packing of Modern High-Efficiency Analytical and Capillary Columns, Anal. Chem., 2017, 89(16), 8177–8191 CrossRef CAS PubMed.
- L. R. Synder, J. J. Kirkland and J. W. Dolan, Introduction to Modern Liquid Chromatography, John Wiley and Sons, Inc, 3rd edn, 2010, ch. 2 Search PubMed.
- J. Nawrocki, The Silanol Group and Its Role in Liquid Chromatography, J. Chromatogr. A, 1997, 779(1–2), 29–71 CrossRef CAS.
- A. Méndez, E. Bosch, M. Rosés and U. D. Neue, Comparison of the Acidity of Residual Silanol Groups in Several Liquid Chromatography Columns, J. Chromatogr. A, 2003, 986(1), 33–44 CrossRef.
- E. P. Barrett, L. G. Joyner and P. P. Halenda, The Determination of Pore Volume and Area Distributions in Porous Substances. I. Computations from Nitrogen Isotherms, J. Am. Chem. Soc., 1951, 73(1), 373–380 CrossRef CAS.
- A. De Juan, J. Jaumot and R. Tauler, Multivariate Curve Resolution (MCR). Solving the Mixture Analysis Problem, Anal. Methods, 2014, 6(14), 4964–4976 RSC.
- S. C. Rutan, A. De Juan and R. Tauler, Compr. Chemom., ed. S.D. Brown, R. Tauler and B. Walczak, Elsevier, 2009, vol. 2 Search PubMed.
- M. F. Wahab, D. C. Patel and D. W. Armstrong, Total Peak Shape Analysis: Detection and Quantitation of Concurrent Fronting, Tailing, and Their Effect on Asymmetry Measurements, J. Chromatogr. A, 2017, 1509, 163–170 CrossRef CAS PubMed.
- M. U. A. Bromba and H. Ziegler, Application Hints for Savitzky–Golay Digital Smoothing Filters, Anal. Chem., 1981, 53(11), 1583–1586 CrossRef CAS.
- K. M. Ashraf, D. Giri, K. J. Wynne, D. A. Higgins and M. M. Collinson, Cooperative Effects in Aligned and Opposed Multicomponent Charge Gradients Containing Strongly Acidic, Weakly Acidic, and Basic Functional Groups, Langmuir, 2016, 32(16), 3836–3847 CrossRef CAS PubMed.
- M. M. Collinson and D. A. Higgins, Organosilane Chemical Gradients: Progress, Properties, and Promise, Langmuir, 2017, 33(48), 13719–13732 CrossRef CAS PubMed.
- T. Ikegami and N. Tanaka, Recent Progress in Monolithic Silica Columns for High-Speed and High-Selectivity Separations, Annu. Rev. Anal. Chem., 2016, 9(1), 317–342 CrossRef CAS PubMed.
- C. A. Doyle, T. J. Vickers, C. K. Mann and J. G. Dorsey, Characterization of Liquid Chromatographic Stationary Phases by Raman Spectroscopy Effect of Ligand Type, J. Chromatogr. A, 1997, 779(1), 91–112 CrossRef CAS PubMed.
- J. G. Dorsey and W. T. Cooper, Retention Mechanisms of Bonded-Phase Liquid Chromatography, Anal. Chem., 1994, 66(17), 857A–867A CrossRef CAS PubMed.
- C. Ye, G. Terfloth, Y. Li and A. Kord, A Systematic Stability Evaluation of Analytical RP-HPLC Columns, J. Pharm. Biomed. Anal., 2009, 50(3), 426–431 CrossRef CAS PubMed.
- S. J. Marin, B. A. Jones, W. D. Felix and J. Clark, Effect of High-Temperature on High-Performance Liquid Chromatography Column Stability and Performance under Temperature-Programmed Conditions, J. Chromatogr. A, 2004, 1030(1–2), 255–262 CrossRef CAS PubMed.
- E. A. Smith and M. J. Wirth, pH Dependence of Tailing in Reversed-Phase Chromatography of a Cationic Dye: Measurement of the Strong Adsorption Site Surface Density, J. Chromatogr. A, 2004, 1060(1–2 SPEC. ISS.), 127–134 CrossRef CAS PubMed.
- D. Giri, K. M. Ashraf, M. M. Collinson and D. A. Higgins, Single-Molecule Perspective on Mass Transport in Condensed Water Layers over Gradient Self-Assembled Monolayers, J. Phys. Chem. C, 2015, 119(17), 9418–9428 CrossRef CAS.
| This journal is © The Royal Society of Chemistry 2019 |

