DOI:
10.1039/C5RA14144C
(Paper)
RSC Adv., 2015,
5, 71278-71286
Mg–Fe mixed oxides as solid base catalysts for the transesterification of microalgae oil†
Received
17th July 2015
, Accepted 14th August 2015
First published on 14th August 2015
Abstract
The Mg–Fe layered double hydroxide (Mg–Fe LDH) precursors were prepared using an improved urea method and characterized by XRD, ICP-AES and SEM analyses, indicating that the pH played a crucial role in the precipitation. The precipitation of the Mg–Fe LDH precursors was obtained when adjusting the initial pH to 9.3 by adding NaOH solution and controlling the urea/Fe3+ molar ratio as 36 in the precipitation solution at 110 °C for 10 h, where the relative yield was 85.4%. The calcined Mg–Fe LDH (LDO) was determined by XRD and CO2-TPD analyses. The LDO with Mg/Fe molar ratio of 3 (LDO-3) was found to have the highest catalytic activity for the transesterification of microalgae oil due to its strongest basicity and highest crystallinity. Finally, the stability and the leaching of the catalytically active species as well as the reusability of the LDO-3 were confirmed by hot-filtration test and multiple reuses. The LDO-3 catalyst could be reused, but catalytic activity decreased after each run due to active species leaching although it retained high activity for the fourth use.
1 Introduction
With the need to reduce carbon emissions, and the dwindling reserves of crude oil, liquid fuels derived from plant material, biofuels, are an attractive source of energy.1 For example, vegetable oils are a renewable and potentially inexhaustible source of energy, and their content is close to diesel fuel. However, extensive use of vegetable oils may cause other significant problems such as starvation in developing countries. Meanwhile, in order to provide a significant proportion of transport fuel, the growth of these crops would compete for arable land with food crops. The vegetable oil fuels are not acceptable because they are more expensive than petroleum fuels.1–3 Any future production of biodiesel from microalgae is expected to use the same process due to their high triacylglycerides and rapid biomass production without use of substantial amounts of agricultural land.2,4 Biodiesel is produced from any fat or oil through a process called transesterification, and biodiesel from microalgae oil has been demonstrated in our previous works.5 Heterogeneous solid basic catalysts are a viable alternative to the traditional homogeneous basic catalysts, and are economically attractive and environmentally-friendly.6–8 Moreover, solid catalysts can be recycled for reutilization and avoid serious contamination problems. Therefore, recent research has focused on solid catalysts.9–11 In particular, hydrotalcites (LDH) are potentially interesting catalysts for the transesterification since they are recognized as adaptable solid base catalysts with high catalytic activity.12–15 The catalytic activity has been determined by not only the basicity of LDH but also the crystallinity. The higher the crystallinity is, the stronger the basicity is, the higher the catalytic activity is.16–18
It is found that the mixed oxides (LDO) obtained by calcination of the hydrotalcites are more effective catalysts with stronger basic properties compared to the LDH precursors in the transesterification reactions.5,19 LDO possess homogeneous interdispersion of the elements, high specific surface areas, and the most important, strong basic properties which make them of highly catalytic activity.14,15,20,21 The catalytic activity shows a correlation not only with the basicity which is dependent on the preparation method.19
LDH have been often synthesized by so-called co-precipitation method, but the drawback of the method is the instantaneous pH value which is certainly different to precipitate homogeneously no matter how fast the stirring speed is. So it is very difficult to obtain hydrotalcites with high crystallinity and narrow distribution of particle sizes and prepared controllably.22–24 Precipitation is carried out in a homogeneous solution using the temperature-controlled hydrolysis of urea, which lead to a slow increase in the pH value. A measly increase of the pH value results in well crystalline LDH with a rather narrow particle size distribution.25,26 Comparing with the Mg–Al LDO obtained by co-precipitation method, Mg–Al LDO obtained by urea method have higher basicity which possess higher catalytic activity in the oil transesterification.5,16,18 Moreover, the separation and recovery of Mg–Al LDO from the reaction products are still difficult. Magnetic solid base catalyst (Mg–Fe LDO) can be separated easily from the reagents by an external magnetic field, which effectively prevent catalyst loss and improve its recovery rate during separation process.27,28
The MgAlFe hydrotalcite catalysts via the co-precipitation method were reported for its use in the production of biodiesel, the highest ester conversion was 81% for the transesterification of soybean oil with methanol.29 It is interesting to understand the forming processes of the Mg–Fe LDH using urea method is in order to tailor them with higher catalytic activity for transesterification. However, in the preliminary experiment, we found that it was difficult to directly prepare the Mg–Fe LDH precursors only using urea as precipitator, for the pH could not be satisfactory to the nucleation of Mg–Fe LDH precursors during the precipitation process.
To investigate Mg–Fe LDH precursors formation process, a titration behavior of Mg(NO3)2(aq) and Fe(NO3)3(aq) mixed solution with a molar ratio of Mg to Fe as 3![[thin space (1/6-em)]](https://www.rsc.org/images/entities/char_2009.gif) :1 against NaOH solution was investigated respectively using co-precipitation method (see detailed information in Fig. S1†), where Mg–Fe LDH precursors are prepared by co-precipitation method according to literature.30 Each single metal salt solution yields one pH plateau corresponding to the precipitation of its respective hydroxides. The titration curve of the mixed-metal solution shows two distinct buffer regions or plateaus, and the transitions between the plateaus are generally very sharp. The nucleation of Mg–Fe LDH depends on the final pH value during the precipitation process, which the variable pH directly influence the success of the preparation of Mg–Fe LDH precursors. When the pH value is higher than 8.36, the XRD patterns of the precipitations have characteristic hydrotalcite layered structure (figure no shown), demonstrating that the pH in the solution should be up to 8.3 to gain the precipitation of Mg–Fe LDH precursors. According to the titration curve in Fig. S1,† we add NaOH solution in order to increase the initial pH in the reaction solution at initial stage of the preparation. It is found that Mg–Fe LDH precursors can be synthesized using urea method, by improving the urea method, i.e., adding NaOH solution to raise the initial pH in the reaction solution.
:1 against NaOH solution was investigated respectively using co-precipitation method (see detailed information in Fig. S1†), where Mg–Fe LDH precursors are prepared by co-precipitation method according to literature.30 Each single metal salt solution yields one pH plateau corresponding to the precipitation of its respective hydroxides. The titration curve of the mixed-metal solution shows two distinct buffer regions or plateaus, and the transitions between the plateaus are generally very sharp. The nucleation of Mg–Fe LDH depends on the final pH value during the precipitation process, which the variable pH directly influence the success of the preparation of Mg–Fe LDH precursors. When the pH value is higher than 8.36, the XRD patterns of the precipitations have characteristic hydrotalcite layered structure (figure no shown), demonstrating that the pH in the solution should be up to 8.3 to gain the precipitation of Mg–Fe LDH precursors. According to the titration curve in Fig. S1,† we add NaOH solution in order to increase the initial pH in the reaction solution at initial stage of the preparation. It is found that Mg–Fe LDH precursors can be synthesized using urea method, by improving the urea method, i.e., adding NaOH solution to raise the initial pH in the reaction solution.
In this paper, we reported an improved urea method for the synthesis of the Mg–Fe LDH precursors, and the effect of the key preparation parameters influencing the reactive precipitation was investigated. The calcined Mg–Fe hydrotalcites (Mg–Fe LDO) as catalysts were adopted for transesterification of microalgae oil to methanol, and the catalytic performance of the catalysts was studied. The physico-chemical properties of the precursors and catalysts were characterized by XRD, SEM, ICP-AES and CO2-TPD in order to clarify the relationship between the properties and catalytic performance. We expect that our work could be helpful for the development of high efficient and environmentally benign catalytic materials in the base-catalytic reactions.
2 Experimental
2.1 Materials
Refined microalgae oil (acid value 0.2 mg KOH per g per oil; water content 0.08 wt%) was from (Chlorella protothecoides CS-41) stored in our laboratory. All the reagents/reactants (urea, Mg(NO3)2·6H2O, Fe(NO3)3·9H2O, NaOH and methanol) were of analytical grade and solutions were prepared with deionized water.
2.2 Preparation of the Mg–Fe LDH precursors
The improved urea hydrolysis method was used to prepare Mg–Fe LDH. Mg(NO3)2·6H2O and Fe(NO3)3·9H2O (Mg2+ + Fe3+ = 0.30 mol L−1, Mg/Fe molar ratios of 1.0–5.0) were dissolved in deionized water and added into a three-neck flask. Urea (urea/Fe3+ molar ratios of 9.0–54.0) was dissolved in the above solution, and dripped simultaneously 1.0 mol L−1 NaOH solution under a shaker with 300 rpm to prepare the precipitation solution. The flask was soaked in an oil bath. The pH was measured all along the reaction process with an industrial pH electrode for high temperature (Mettler Toledo). The solutions were maintained at a specific temperature (70–130 °C) for certain time under stirring (300 rpm), and then were aged statically at 65 °C for another 18 h. The precipitates were collected by filtration and washed with deionized water to neutrality, and then dried at 80 °C for 10 h, which were denoted as LDH. For convenience, the Mg–Fe LDH precipitates with different Mg/Fe molar ratios of 2.0, 3.0 and 4.0 were designated as LDH-2, LDH-3 and LDH-4. Part of the LDH was calcined in a muffle furnace at 500 °C for 4 h, which was designated as LDO. The LDO as catalysts were used for the transesterification of microalgae oil to methanol. For convenience, the calcined LDH-2, LDH-3 and LDH-4 were correspondingly designated as LDO-2, LDO-3 and LDO-4, respectively.
The relative yield of the precipitate (Mg–Fe LDH) was the ratio of practical yield to theoretical yield. The yield was the mass of the precipitate produced after the preparation of Mg–Fe LDH.
2.3 Characterization
X-ray diffraction (XRD) patterns were collected on a Japan Rigaku D/max 2550PC (λ = 1.5405 Å) with CuKα radiation. The scan step was 0.02° (2θ) with a filament intensity of 30 mA and a voltage of 40 kV. The XRD data were matched with standard JCPDS data files. The morphology of the samples was observed via scanning electron microscope (SEM, Holland FEI Sirion-200) by the help of gold sputtering. The samples were dispersed in ethanol solution by an ultrasonic cleaner, and then the dispersing solution was dropped on carbon coated Cu grids. Coupled plasma atomic emission spectrometry (ICP-AES, USA Thermo Electron IRIS Intrepid II) was used to determine the contents of Na, Mg and Fe elements in the samples, where the samples were completely dissolved in the HCl solution. CO2-temperature programmed desorption was used to assess surface basicity of sample using an automated chemisorption analyzer (CO2-TPD, USA Quantachrome ChemBET Pulsar). 200 mg sample was exposed to a stream of 10% CO2–He mixture at 400 °C for 2 h. The sample was cooled to room temperature and flushed with pure CO2 for 1 h until saturation. The sample was heated from 50 to 800 °C at a heating rate of 10 °C min−1 under a He stream flowing at 60 mL min−1.
2.4 Transesterification reaction
Refined microalgae oil and an appropriate volume of methanol with catalysts (2.0 wt% of oil) were placed into a 500 mL three-angel necked flask equipped with reflux condenser and Teflon stirrer (300 rpm). Molar ratios of methanol to oil was taken at 3.0–9.0:1. The reaction mixture was blended at 20–80 °C for certain time. A little reaction mixed solution was withdrawn at defined time intervals in order to gain the ester conversion data. After reaction, the methanol was recovered by a rotary evaporator in vacuum at 45 °C. Subsequently, the catalyst was separated by an external magnetic field and the ester layer was separated from the glycerol layer in a separating funnel. The fine ester layer was dried over sodium sulfate and analyzed by gas chromatography on a Perkin-Elmer GC-200 chromatograph with FID detector, equipped with a stainless steel packed column (3 mm × 2 m Silar-9cp). The oven temperature program consisted of: start at 160 °C (2 min), ramp at 1.5 °C min−1 to 215 °C (10 min). Undecanoic acid methyl ester was used as the internal standard. The content of the methyl ester in the product (biodiesel) was calculated quantitatively by comparing the peak areas of fatty acid methyl esters to the peak area of the internal standard obtained from GC. The ester conversion (%) was the ratio of the content of methyl ester obtained actually and theoretically.
3 Results and discussion
3.1 Preparation of Mg–Fe LDH precursors
3.1.1 Effect of initial pH. The hydrolysis of urea had been used to promote the precipitation of Mg–Al LDH, which the urea was the precipitant.25 The tests were carried out to determine the pH variation in the mixed solution of Mg2+ and Fe3+ salts with urea (Mg2+/Fe3+ = 3, urea/Fe3+ = 36.0) at 110 °C for 10 h (Fig. 1) using urea as only precipitant, and the results were shown in Fig. 1. As in Fig. 1, the pH value in the mixed solution of Mg2+ and Fe3+ salts is 1.45, namely the initial pH value is 1.45, and the reaction pH rises significantly to reach a plateau as time prolongs. The pH curve shows a breaking point around 7.3 for 10 h and then keeps an equilibrium after 10 h. No Mg–Fe LDH precipitation in the reaction solutions can be detected by XRD (figure no shown), implying that there is no precipitation of Mg–Fe LDH in the solution because of low pH (pH < 8.3) at which Mg–Fe LDH precipitation can occur (Fig. S1†). The results indicate that it is difficult to prepare the Mg–Fe LDH using urea as the only precipitant. However, in our preliminary work, Mg–Fe LDH with high crystallinity were obtained by dropping NaOH solution to raise the initial pH under the same conditions of urea hydrolysis. Addition of NaOH enables the solution to keep at pH ≈ 9.3 during the preparation, resulting in the precipitation of Mg–Fe LDH. A method for synthesis of Mg–Fe LDH was developed in our laboratory, namely increased the initial pH to 8.3 in the precipitation solution by adding NaOH during urea hydrolysis, and the improved urea method was used for further researches.
 |
| | Fig. 1 The pH titration curve of the mixed solution for the precipitation of the Mg–Fe LDH using classical urea method under the conditions of Mg/Fe molar ratio of 3.0, 40 °C and urea/Fe3+ of 36, only suing urea as precipitator. | |
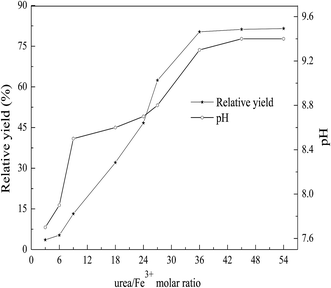
3.1.2 Effect of urea/Fe3+ molar ratio. Urea is decomposed to form NH3·H2O in precipitation solution when the reaction temperature is over 90 °C, which provides OH− for the reaction. Therefore, pH of the solution is likely controlled mainly by the amount of urea in urea hydrolysis.20 In the Mg–Fe LDH precipitation obtained using the improved urea method, the urea/Fe3+ molar ratio in the precipitation solution is important for the formation of hydrotalcite-type materials. Effects of urea/Fe3+ molar ratio on the relative yield of the LDH-3 and the variation of pH during the precipitation at 110 °C for 10 h are shown in Fig. 2, where the initial pH is adjusted to about 8.3. The relative yield undergoes a steep increase (urea/Fe3+ molar ratios ≤ 36) from 3.6 to 80.3%, follows by a plateau (about 81.5%). The pH value increases sharply from pH 7.7 to 9.3 with the increase of the urea/Fe3+ molar ratios. In urea/Fe3+ molar ratios > 36, the pH value is relatively constant, remaining at about 9.4 (Fig. 2). The results indicate that the pH is likely controlled by the amount of urea hydrolysis, namely urea/Fe3+ molar ratios. A similar result about Mg–Al LDH had also been reported by us.25
 |
| | Fig. 2 Effect of urea/Fe3+ molar ratio on the relative yield under the conditions of initial pH 9.3 and 110 °C for 10 h. | |
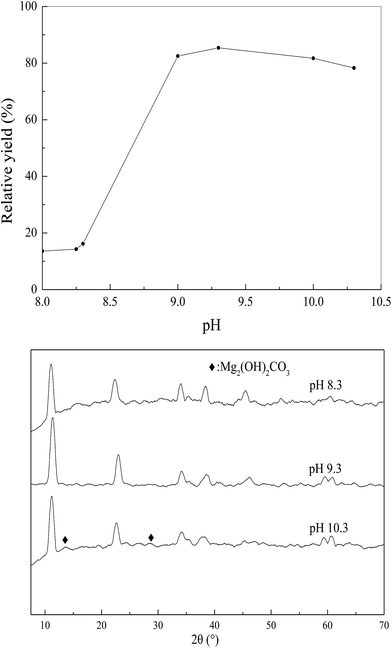
3.1.3 Effect of constant pH. Effect of constant pH on the relative yield of the Mg–Fe LDH samples was carried out using improved urea method (urea/Fe3+ molar ratio = 36) at 110 °C for 10 h (Fig. 3). The relative yield increases sharply with the rise of pH, and then reaches maximum (85.4%) at pH 9.3. For Mg–Fe LDH, the precipitation of pure Mg(OH)2 occurs at pH 9.5, and the pH close to the point of zero charge of Fe(OH)3, which favors the precipitation of the Mg–Fe LDH.31 The slight decrease of the relative yield at above 9.3 is probably due to formation of Mg2(OH)2CO3 during the precipitation leading to a decrease of Mg–Fe LDH yield.
 |
| | Fig. 3 Effect of precipitation pH on the relative yield under the conditions of urea/Fe3+ molar ratio of 36 and 110 °C for 10 h. | |
Typical XRD patterns of the LDH-3 samples at pH 8.3, 9.3 and 10.3 are shown in Fig. 3. The LDH structure is present in the three samples, indicating that the three samples are prepared successfully. The two reflections of (110) and (113) can be clearly distinguished from the two samples at pH 9.3 and 10.3, pointing out that the two samples are typical of highly crystalline layered double hydroxides structures.23 However, it is vague for the sample at pH 8.3, indicating that the sample at pH 8.3 has lower crystallinity. Moreover, the sharpness and intensity of XRD are considered to be proportional to the crystallinity.32,33 The sharpest reflections with the most stable baseline indicate the better-crystallized layered structure for the LDH-3, implying that the LDH-3 possesses the highest crystallinity. The sample at pH 10.3 shows the formation of Mg2(OH)2CO3 as a impurity phase with Mg–Fe LDH as the major phase. The lowest intensity and vague reflections of (110) and (113) are observed for the sample at pH 8.3, indicating that its poor crystallinity. So, the Mg–Fe LDH (LDH-3) with high crystallinity can be obtained with the improved urea method.
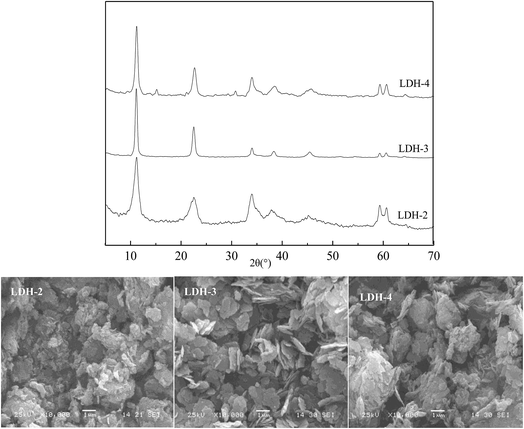
3.1.4 Effect of Mg/Fe molar ratio. The Mg–Fe LDH with different Mg/Fe molar ratios obtained at urea/NO3− molar ratio 4 and 110 °C for 10 h, and the LDH-2, LDH-3 and LDH-4 were characterized by XRD and SEM (Fig. 4). As seen in Fig. 4, the LDH-2, LDH-3 and LDH-4 samples have the typical layered double hydroxides structures. XRD pattern of the LDH-4 shows the presence of Mg2(OH)2CO3 as an impure phase, which is due to the increase of magnesium content. The LDH-2 and LDH-3 show the X-ray pattern of single phase Mg/Fe LDH compounds. Comparing to the LDH-2, sharper reflections with a more stable baseline of the LDH-3 indicate the better-crystallized layered structure for the LDH-3, implying that the LDH-3 possesses the highest crystallinity. The structural parameters are calculated from the XRD patterns in Table 1. The similarity in a value, average cation–cation distance in the brucite sheets indicating that the different Mg/Fe molar ratios do not change the microstructure of the brucite sheets. The crystallite size in a direction (da) of the LDH-3 is bigger than that of the other two samples, and the crystallite size in c direction (dc) follows a similar trend, implying that the LDH-3 possesses the biggest crystallite size. Besides, the Mg/Fe molar ratios of the samples were determined by ICP-AES. The Mg/Fe molar ratios for the LDH-2, LDH-3 and LDH-4 are 1.79, 2.67 and 3.64, respectively. And no Na element is detected by ICP-AES.
 |
| | Fig. 4 XRD patterns and SEM images of the Mg–Fe LDH with different Mg/Fe molar ratios. | |
Table 1 Structure parameters of the Mg–Fe LDH with different Mg/Fe molar ratiosa
| Parameter |
LDH-2 |
LDH-3 |
LDH-4 |
| FW: half-width of diffraction peak; da: crystallite size in a axis direction; dc: crystallite size in c axis direction. |
| d003 (nm) |
0.788 |
0.794 |
0.788 |
| d006 (nm) |
0.393 |
0.394 |
0.392 |
| d009 (nm) |
0.264 |
0.263 |
0.263 |
| d110 (nm) |
0.156 |
0.157 |
0.156 |
| FW003 (rad) |
0.76 |
0.464 |
0.551 |
| FW110 (rad) |
0.48 |
0.405 |
0.457 |
| a (nm) |
0.312 |
0.314 |
0.312 |
| c (nm) |
2.364 |
2.382 |
2.364 |
| dc (nm) |
10.401 |
17.035 |
14.347 |
| da (nm) |
18.859 |
22.354 |
19.814 |
In order to investigate the morphology of the Mg–Fe LDH, the samples are observed by SEM analyses in Fig. 4. The LDH-3 is expected to be a well-developed layered hexagonal structure with mono-dispersed and edge-rounded platelets. The LDH-2 forms thin flat crystals with various edges indicting the layered structure, where there is a tendency for platelets to aggregate in a clumpy manner. In contrast with the former two samples, the LDH-4 mainly consists of aggregates in blocks, possibly due to the formation of Mg2(OH)2CO3 impure phase. The results reveals by SEM are in agreement with the XRD analyses in Fig. 4.
3.1.5 Effect of precipitation temperature. To evaluate the effect of temperature on the preparation yield, a series of tests for the LDH-3 were carried out at urea/Fe3+ molar ratio 36 in the temperature range 70 to 130 °C for 10 h (Fig. 5A). The results show that the relative yield of Mg–Fe LDH is sensitive to temperature. The relative yield remains basically stable (about 15%) from 70 to 90 °C. It is known that heating below 90 °C, urea can not decompose so that it is difficult to keep the solution at pH 8.3 to form more Mg–Fe LDH precipitations. At 90–110 °C, the relative yield increases with an enhancement of the temperature, and then reaches a plateau (82.5%) at high temperatures (above 110 °C). At normal pressure, NH3 from decomposing urea reaches a vapor liquid equilibrium at 110 °C. At a high temperature (110 °C), it seems to result superfluous NH3 volatilization, and consequently keeps NH3 stable in the solution, i.e. pH stable (pH ≈ 9.3).
 |
| | Fig. 5 (A) Effect of precipitation temperature on the relative yield at urea/Fe3+ molar ratio of 36 for 10 h. (B) Effect of precipitation time on the relative yield under the conditions of urea/Fe3+ molar ratio of 36 and 110 °C for 10 h. | |
3.1.6 Effect of precipitation time. The effect of precipitation time on the LDH-3 was also investigated under the conditions of precipitation temperature 110 °C and urea/Fe3+ molar ratio 36 (Fig. 5B). The relative yield increases with the increase of the reaction time, then reaches a plateau representative of a nearly equilibrium after 10 h, where the relative yield is about 82.4%.
3.2 Characterizations of Mg–Fe LDO catalysts
3.2.1 XRD analyses. The XRD patterns of the LDO-2, LDO-3 and LDO-4 samples are shown in Fig. 6A. During calcination, the decomposition of the Mg–Fe LDH precursors result in a formation of mixed Mg–Fe oxides phases. As shown in Fig. 6A, all typical hydrotalcite reflections in the three samples disappear, and new oxide derivatives reflections are observed after calcination at 500 °C. All the XRD patterns of the mixed oxides (Mg–Fe LDO) exhibit the typical features of a mixed oxide of Mg(Fe)O type,34 where spinel-type phase is not detected. For all the samples, the crystallization of typical single periclase-type MgO phase (JCPDS 45-0946) are observed, where the positions of the reflections corresponding to the (111), (200) and (220) reflections which are of the mixed MgO-like oxide. Comparing to the LDO-2 and LDO-4, the LDH-3 demonstrates the highest crystallinity due to its sharpest reflections.34 The absence of the Fe oxides phase probably results from their amorphous structure. Therefore, it can be concluded that Fe3+ cations or/and iron oxides were well dispersed in the Mg(Fe)O phase without the formation of spinel species.15,35,36
 |
| | Fig. 6 (A) XRD patterns of the Mg–Fe LDO with different Mg/Fe molar ratios. (B) CO2-TPD patterns of the Mg–Fe LDO with different Mg/Fe molar ratios. | |
3.2.2 CO2-TPD analyses. Generally CO2-TPD measurements are used to identify the basicity and provide information about the kind and distribution of basic sites present in a material. CO2 adsorption is related to the heterogeneity of the basic sites on the Mg–Fe LDO. The CO2-TPD patterns of the Mg–Fe LDO at indicated temperatures are given in Fig. 6B, and the distribution of the quantity of basic sites and basicity are listed in Table 2. As revealed in Fig. 6B, the CO2-TPD profiles consist of three overlapping CO2 desorption reflections, reaching the maximum desorption rates at about 98 °C (weak basic sites), 165 °C (medium basic sites) and 510 °C (strong basic sites).37,38 Weak basic sites form on weak basic OH− groups, medium basic sites adsorb on Mg–O site pairs, and strong basic sites adsorb on strong basic surface O2− anions, namely the desorption reflection to CO2 species adsorbed on OH− groups (α-peak), Mg–O ion pairs (β-peak), and O2− anions (γ-peak).39–41 As shown in the Table 2, the total CO2 desorbed in the three samples are in the range of 460–580 μmol g−1, and the relative amount of strong basic sites (O2− anions) is the highest in each sample, representing 44–48% of the total evolved CO2. It is worth mentioning that the LDO-3 exhibits the highest total CO2 evolved amount (571.4 μmol g−1), thus, confirming the highest basicity of the LDO-3 catalyst. Based on the obtained results, the samples are arranged in an increasing order of their basicity as follows: LDO-3 > LDO-4 > LDO-2. At the same time, the LDO-3 also has the highest strong basic sites (270.8 μmol g−1) and medium basic sites (249.7 μmol g−1) (Table 2), implying that the LDH-3 has the largest amounts of Mg–O ion pairs and O2−. The similar results have also been observed which the Mg/Al LDO-3 had the maximum basic sites, especially the strong basic sites, and the total basicity comparing to that of the Mg/Al LDO-2 and Mg/Al LDO-4 in the literature.18,42 The enhancement of the basicity, especially the strong basic sites of the LDO-3 may cause by higher crystallinity comparing with the LDO-2 and LDO-4, which is consistent with previous research in the literature.16,43
Table 2 Basicity and basic sites of the Mg–Fe LDO with different Mg/Fe molar ratios
| Catalyst |
Weak |
Medium |
Strong |
Total evolved CO2 (μmol g−1) |
| αa (°C) (area, %) |
CO2 desorbed (μmol g−1) |
βa (°C) (area, %) |
CO2 desorbed (μmol g−1) |
γa (°C) (area, %) |
CO2 desorbed (μmol g−1) |
| α: α-peak center; β: β-peak center; γ: γ-peak center. |
| LDO-2 |
98.7 (11.6) |
53.5 |
164.0 (43.5) |
200.8 |
515.4 (44.9) |
207.3 |
461.6 |
| LDO-3 |
98.3 (8.9) |
50.9 |
165.3 (43.7) |
249.7 |
512.7 (47.4) |
270.8 |
571.4 |
| LDO-4 |
97.5 (10.7) |
58.8 |
167.2 (41.9) |
230.4 |
508.5 (47.4) |
260.7 |
549.9 |
3.3 Catalytic performances of Mg–Fe LDO
The Mg–Fe LDO with different Mg/Fe molar ratios were prepared in urea/NO3− molar ratio of 4 at 110 °C for 10 h, and had chosen for the catalytic test to determine its catalytic performances of producing biodiesel. The transesterification of microalgae oil to methanol was carried out with the catalysts.
3.3.1 Influence of Mg/Fe molar ratio and reaction time. The experimental results are illustrated in Fig. 7, which indicates that the catalytic activity is improved with the increase in Mg content when the Mg/Fe molar ratios is below 3.0, but when above 3.0, the catalytic activity drops. Clearly, such tendency is basically correlated to the crystallinities of the Mg–Fe LDH precursors and Mg–Fe LDO catalysts with various Mg/Fe ratios (Fig. 4 and 6A), especially related to basicity of the Mg–Fe LDO, which the LDO-3 with the highest activity shows the highest basicity and crystallinity. On the other hand, the reaction time beyond 1.5 h do not have much effect on the increase of the ester conversion of the Mg–Fe LDO with Mg/Fe molar ratios of 3 and 4, but the equilibrium time for the Mg–Fe LDO with Mg/Fe molar ratios of 1, 2 and 5 is extended to 2.0 h. In conclusion, the LDO-3 is used as catalyst for further researches on the transesterification for 1.5 h.
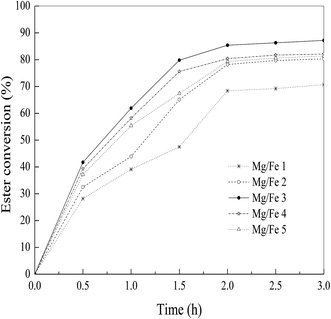 |
| | Fig. 7 Influence of Mg/Fe molar ratio on catalytic activity at 60 °C (methanol/oil molar ratio of 6.0). | |
3.3.2 Influence of methanol/oil molar ratio. The molar ratios of methanol to oil is one of the most important variables that affect ester formation. The catalytic activities of the LDO-3 at different molar ratios of methanol to oil are investigated (Fig. 8A). As shown in the Fig. 8A, by increasing the methanol/oil molar ratios, the ester conversion is increased considerably. The optimum molar ratio of methanol to oil is found to be 6.0. Beyond the molar ratios of 6.0, the excessively added methanol does not significantly enhance the ester conversion. Excessive methanol might cause the dilution effect resulting in less conversion.
 |
| | Fig. 8 (A) Influence of methanol/oil molar ratio on catalytic activity of the LDO-3 at 60 °C for 1.5 h. (B) Influence of reaction temperature on catalytic activity of the LDO-3 for 1.5 h (methanol/oil molar ratio 6.0). | |
3.3.3 Influence of reaction temperature. The effect of the reaction temperature on the catalytic activity was studied from 20 to 80 °C (Fig. 8B). Clearly, reaction temperature strongly affects the catalytic activity of the LDO-3 in the reaction. The ester conversion increases up to 88.5% by increasing the reaction temperature to 60 °C. Thus, the optimum temperature for the production of the methyl esters is found to be 60 °C, which is near the boiling point (about 65 °C) of anhydrous methanol. Commonly, the reaction is conducted at a temperature close to the boiling point of methanol at atmospheric pressure. The conversion fall to about 70.8% at 80 °C, probably because the molar ratios of methanol to oil decrease when methanol reactant volatilizes into gas phase at above 65 °C, the boiling point of pure methanol.44
3.3.4 Stability and leaching of the LDO-3. In heterogeneous catalysis, it is of the essence to check for the possible occurrence of any leaching. To assess the presence of soluble active palladium, the hot filtration test is applied which is also known as the split test, the solid catalysts are filtered out of the reaction and the filtrate is monitored for continued activity.45 In order to check the leaching of Fe species during transesterification reaction, an experiment which interrupted at 41.7% ester conversion after 0.5 h has performed under the similar reaction conditions. The terminated reaction medium is filtered, and the hot filtrate immediately transfer to another reactor at the same temperature for another 1.0 h, wherein part of the hot filtrate is adopted for the determination of Fe element by ICP-AES. After 1 h, the ester conversion of the hot filtrate (64.5%) is significantly higher than that of the regular reaction for 0.5 h (41.7%) (Fig. 9), implying the presence of the leached active Fe metal. On the other hand, ICP-AES analysis proves that a leaching of Fe appears in the hot filtrate, too. When the catalyst is no longer present, the hot filtrate continues to react, indicating that part of the Fe species is leaching from the surface of the catalyst and catalyzing the reaction.
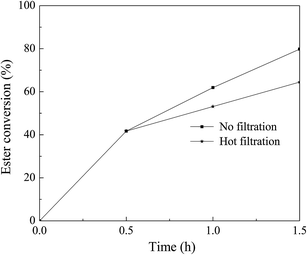 |
| | Fig. 9 Application of hot filtration to the LDO-3 catalyst for the transesterification. Hot filtration was applied at 0.5 h. | |
3.3.5 Reusability test of the catalyst. For practical applications of heterogeneous systems, the stability of the LDO-3 catalyst and its level of reusability are very important factors. To clarify this issue, a set of experiments were established using the recycled catalyst. We performed seven runs using of the catalyst after filtration, and then washing with methanol to remove the ester and glycerol attaching on the catalyst. The LDO-3 catalyst is reused for the next run under the same conditions, and the results are shown in Fig. 10. It is found that the catalyst become deactivated after each run, and the LDO-3 catalyst deactivates fully in the seventh recycle experiment due to the leaching of Fe species from the surface of the catalyst (Fig. 9). The ester conversion remains high (64.6%) in the fourth treatment cycle employing the LDO-3 catalyst. The results implied that the catalyst can be recovered and recycled.
 |
| | Fig. 10 Influence of reuse times on catalytic activity under the conditions of methanol/oil molar ratio 6.0 and 60 °C for 1.5 h. | |
4 Conclusions
In the paper, the improved urea method was presented to prepare the Mg–Fe LDH using urea and NaOH as the precipitant. The Mg–Fe LDH precursors were characterized with XRD, ICP-AES and SEM. The effects of precipitation conditions such as urea/Fe3+ molar ratios, precipitation pH and Mg/Fe molar ratios as well as precipitation temperature and time were studied in order to obtain good crystalline Mg–Fe LDH and high relative yield.
For the transesterification of microalgae oil to methanol, the LDO-3 was found to be as good as solid base catalyst. When the reaction was carried out with a methanol/oil molar ratio of 6.0, reaction temperature 60 °C, and reaction time 1.5 h, the ester conversion was about 88% for the LDO-3 catalyst. Combined with XRD and CO2-TPD analyses, the catalytic performance of the LDO-3 with the highest basicity and crystallinity had the highest catalytic activity for the transesterification of microalgae oil. Finally, both stability and reusability of the catalyst were addressed and proved, which indicated that the leaching of Fe species was the key for catalyst deactivation.
Acknowledgements
This work was financially supported by the Key Project of Hunan Provincial Natural Science Foundation of China (12JJ2008), Open Project of Hunan Provincial University Innovation Platform (12K048), and Xiangtan University Graduate Innovation Project (XJCX201405). The authors sincerely appreciate Mengchen Liao for her help with the English.
Notes and references
- D. P. Serrano, J. Dufour and D. Iribarren, Energy Environ. Sci., 2012, 5, 6126–6135 CAS.
- G. G. Zaimes and V. Khanna, RSC Adv., 2014, 4, 44980–44990 RSC.
- T. Issariyakul and A. K. Dalai, Energy Fuels, 2010, 24, 4652–4658 CrossRef CAS.
- K. Vijayaraghavan and K. Hemanathan, Energy Fuels, 2009, 23, 5448–5453 CrossRef CAS.
- H. Y. Zeng, S. Xu, M. C. Liao, Z. Q. Zhang and C. Zhao, Appl. Clay Sci., 2014, 91, 16–24 CrossRef PubMed.
- N. Kaur and A. Ali, RSC Adv., 2014, 4, 43671–43681 RSC.
- N. Kaur and A. Ali, RSC Adv., 2015, 5, 13285–13295 RSC.
- V. Mutreja, S. Singh, T. K. Minhas and A. Ali, RSC Adv., 2015, 5, 46890–46896 RSC.
- C. L. Chen, C. C. Huang, D. T. Tran and J. S. Chang, Bioresour. Technol., 2012, 113, 8–13 CrossRef CAS PubMed.
- M. Kaur and A. Ali, Eur. J. Lipid Sci. Technol., 2015, 117, 550–560 CrossRef CAS PubMed.
- D. Kumar and A. Ali, Fuel, 2015, 159, 845–853 CrossRef CAS PubMed.
- Z. Helwani, M. R. Othman, N. Aziz, J. Kim and W. J. N. Fernando, Appl. Catal., A, 2009, 363, 1–10 CrossRef CAS PubMed.
- T. F. Dossin, M. F. Reyniers, R. J. Berger and G. B. Marin, Appl. Catal., B, 2006, 67, 136–148 CrossRef CAS PubMed.
- Z. Fang, F. Zhang, H. Y. Zeng and F. Guo, Bioresour. Technol., 2011, 102, 8017–8021 CrossRef CAS PubMed.
- H. Y. Zeng, Z. Feng, X. Deng and Y. Q. Li, Fuel, 2008, 87, 3071–3076 CrossRef CAS PubMed.
- Z. Q. Zhang, M. C. Liao, H. Y. Zeng, S. Xu, L. H. Xu, X. J. Liu and J. Z. Du, Fuel Process. Technol., 2014, 128, 519–524 CrossRef CAS PubMed.
- X. Lei, F. Zhang, L. Yang, X. Guo, Y. Tian, S. Fu and X. Duan, AIChE J., 2007, 53, 932–940 CrossRef CAS PubMed.
- W. L. Xie, H. Peng and L. G. Chen, J. Mol. Catal. A: Chem., 2006, 246, 24–32 CrossRef CAS PubMed.
- M. Di Serio, M. Ledda, M. Cozzolino, G. Minutillo, R. Tesser and E. Santacesaria, Ind. Eng. Chem. Res., 2006, 45, 3009–3014 CrossRef CAS.
- K. Yamaguchi, K. Ebitani, T. Yoshida, H. Yoshida and K. Kaneda, J. Am. Chem. Soc., 1999, 121, 4526–4527 CrossRef CAS.
- H. Y. Zeng, Y. J. Wang, Z. Feng, K. Y. You, C. Zhao and J. W. Sun, Catal. Lett., 2010, 137, 94–103 CrossRef CAS.
- M. Adachi-Pagano, C. Forano and J. P. Besse, J. Mater. Chem., 2003, 13, 1988–1993 RSC.
- F. Cavani, F. Trifiro and A. Vaccari, Catal. Today, 1991, 11, 173–301 CrossRef CAS.
- M. Ogawa and H. Kaiho, Langmuir, 2002, 18, 4240–4242 CrossRef CAS.
- H. Y. Zeng, X. Deng, Y. J. Wang and K.
B. Liao, AIChE J., 2009, 55, 1229–1235 CrossRef CAS PubMed.
- J. T. Kloprogge, L. Hickey, R. Trujillano, M. J. Holgado, M. S. San-Roman, V. Rives, W. N. Martens and R. L. Frost, Cryst. Growth Des., 2006, 6, 1533–1536 CAS.
- J. Wang, J. You, Z. Li, P. Yang, X. Jing and M. Zhang, Nanoscale Res. Lett., 2008, 3, 338–342 CrossRef CAS.
- S. Tang, L. Wang, Y. Zhang, S. Li, S. Tian and B. Wang, Fuel Process. Technol., 2012, 95, 84–89 CrossRef CAS PubMed.
- S. H. Wang, Y. B. Wang, Y. M. Dai and J. M. Jehng, Appl. Catal., A, 2012, 439–440, 135–141 CrossRef CAS PubMed.
- P. S. Kumbhar, J. Sanchez-Valente, J. M. M. Millet and F. Figueras, J. Catal., 2000, 191, 467–473 CrossRef CAS.
- Z. Liu, R. Ma, M. Osada, N. Iyi, Y. Ebina, K. Takada and T. Sasaki, J. Am. Chem. Soc., 2006, 128, 4872–4880 CrossRef CAS PubMed.
- S. Kannan, A. Narayanan and C. S. Swamy, J. Mater. Sci., 1996, 31, 2353–2360 CrossRef CAS.
- U. Costantino, F. Marmottini, M. Nocchetti and R. Vivani, Eur. J. Inorg. Chem., 1998, 1998, 1439–1446 CrossRef.
- P. Guerrero-Urbaneja, C. García-Sancho, R. Moreno-Tost, J. Mérida-Robles, J. Santamaría-González, A. Jiménez-López and P. Maireles-Torres, Appl. Catal., A, 2014, 470, 199–207 CrossRef CAS PubMed.
- C. M. S. Polato, C. A. Henriques, A. C. C. Rodrigues and J. L. F. Monteiro, Catal. Today, 2008, 133, 534–540 CrossRef PubMed.
- G. L. Tian, M. Q. Zhao, B. Zhang, Q. Zhang, W. Zhang, J. Q. Huang and F. Wei, J. Mater. Chem. A, 2014, 2, 1686–1696 CAS.
- N. A. S. Amin, J. Mol. Catal. A: Chem., 2006, 259, 61–66 CrossRef PubMed.
- C. Murugan and H. C. Bajaj, Fuel Process. Technol., 2011, 92, 77–82 CrossRef CAS PubMed.
- J. I. Di Cosimo, C. R. Apesteguía, M. J. L. Ginés and E. Iglesia, J. Catal., 2000, 190, 261–275 CrossRef CAS.
- J. I. Di Cosimo, V. K. Díez and C. R. Apesteguía, Appl. Clay Sci., 1998, 13, 433–449 CrossRef CAS.
- S. Sankaranarayanan, C. A. Antonyraj and S. Kannan, Bioresour. Technol., 2012, 109, 57–62 CrossRef CAS PubMed.
- C. T. Fishel and R. Davis, Langmuir, 1994, 10, 159–165 CrossRef CAS.
- S. Wang, R. Bai, F. Mei and G. Li, Catal. Commun., 2009, 11, 202–205 CrossRef CAS PubMed.
- D. G. B. Boocock, S. K. Konar, V. Mao and H. Sidi, Biomass Bioenergy, 1996, 11, 43–50 CrossRef CAS.
- M. P. Kapoor, A. Bhaumik, S. Inagaki, K. Kuraoka and T. Yazawa, J. Mater. Chem. A, 2002, 12, 3078–3083 RSC.
Footnote |
| † Electronic supplementary information (ESI) available. See DOI: 10.1039/c5ra14144c |
|
| This journal is © The Royal Society of Chemistry 2015 |
Click here to see how this site uses Cookies. View our privacy policy here. 


