The electrical enhancement and reversible manipulation of near-infrared luminescence in Nd doped ferroelectric nanocomposites for optical switches
Er
Pan
,
Gongxun
Bai
 *,
Lei
Lei
 ,
Junjie
Zhang
and
Shiqing
Xu
*
College of Materials Science and Engineering, China Jiliang University, Hangzhou 310018, People's Republic of China. E-mail: baigongxun@126.com; shiqingxu75@163.com
First published on 5th March 2019
Abstract
Lanthanide ion doped ferroelectric oxides have unique ferroelectric and luminescence properties, which show great promise for future optoelectronic applications. Moreover, it is of great interest that the luminescence of ferroelectric materials can be effectively modulated by an external electric field. In this work, Nd3+ doped ferroelectric nanocomposites with near-infrared emission have been developed to study their optoelectronic properties and reversible tuning. At room temperature, the near-infrared emission has been enhanced over 4.6 times and the intensity can be controllably modulated by tuning the electric field. The mechanism behind the enhancement and reversible modulation has been investigated for designing luminescence memory or optoelectronic sensors. This work suggests a way for not only studying the luminescence properties of optical materials via polarization engineering, but also for potentially developing multifunctional materials for optoelectronic applications.
Introduction
The spectroscopic modification and reversible tuning of optical materials are great importance both for studying the fundamental physical processes and for a wide range of potential applications, such as non-contact ratiometric thermometry, fluorescent probes, multimode storage by optoelectronic materials, lighting phosphors, photocatalytic oxidation and bio-imaging and bio-separation.1–8 Up to now, a lot of studies have focused widely on modulating the emission spectra by chemical methods, such as changing the active doping ions and the composition of the host materials. However, the technique of chemical tuning is usually an irreversible and ex situ process. Normally, the emission tuning of luminescent ions is strongly related to the crystal field around the active doping ions.9,10 It is very difficult to segregate the single crystal field effect from the extrinsic effects that exist in diverse samples, including various defects and chemical inhomogeneities. Hence, it is of great interest to explore the modification of luminescence by some physical approaches, such as an electric field, a magnetic field, hydrostatic pressure, etc.11–13 These physical methods remind us that the interaction between the dopant and the dopant host can be controlled at the micro level through external stimulation, and then some interesting optical phenomena can occur. These approaches can help researchers not only to learn about the kinetic process of photon emission, but also to develop some novel optoelectronic applications, such as luminescent sensors and memory devices.Ferroelectric materials have excellent self-performance. When combined with other technologies, the newly fabricated ferroelectric materials have more extensive applications.14,15 It is very interesting to explore the symmetry changes of the ferroelectric crystal structure driven by various methods, and then to study the luminescence modification of the dopant.16,17 The ferroelectric materials can combine an electric field with the symmetry of the crystal structure, as a result of ferroelectric polarization. While the luminescence of lanthanide ions is sensitive to the symmetry of the crystal structure. These properties provide an opportunity for us to investigate multifunctional materials and controllable luminescence.18–20 Therefore, it is possible to combine the properties of a ferroelectric material with luminescent ions. For example, Hao's group realized effective upconversion luminescence enhancement in Yb3+/Er3+ doped ferroelectric barium titanate thin film via an electric field.21 The optical properties of the material can be greatly improved by embedding ferroelectric nanocrystals into a glass matrix, namely, ferroelectric nanocomposites. Physical properties, such as the electrical and optical properties of the ferroelectric nanocomposites, can be optimized by modulating the forms and states of the dispersed ferroelectric phase. Here nanocrystalline LiNbO3 embedded in transparent glass was chosen as the ferroelectric host. LiNbO3 is characterized by a high Curie temperature, high dielectric constant, low dielectric loss, and high resistivity at room temperature. It also shows a high efficiency of nonlinear optics, especially in the generation of second harmonic light, which is widely used as a waveguide modulator and optical switch.
On the other hand, materials doped with lanthanide ions have a wide range of applications in optical telecommunication, the lighting industry, solid lasers, medical imaging and biological analysis.22,23 A commonly employed strategy to study luminescent reactions and mechanisms is to introduce luminescent centers into different host substrates or ligand environments. In particular, the crystal symmetry of the main nanocomposites can effectively modulate the luminescence of the lanthanide ions. Here, lanthanide Nd3+ was used as a spectral probe to investigate crystal field effects because of its highly hypersensitive transitions. Moreover, Nd3+ ions can produce near-infrared (NIR) emission around 900, 1064 and 1326 nm. The Nd3+ doped materials possess vast prospects in biomedicine, high-power lasers and optical communication and so on.24,25 Therefore, a kind of transparent Nd3+-doped ferroelectric nanocomposite has been developed in this work. The optoelectronic properties and tuning of the luminescence by an electric field have been tried to study the luminescence–electronic coupling. A methodical study was employed to investigate the potential mechanisms for the NIR luminescence response of an Nd3+-doped LiNbO3 composite with an external electric field. Furthermore, it is intended to study the potential physical processes of the luminescence modulation in an external electric field. The reversibility of the ligand field around the Nd3+ ions under the electric field was also explored at room temperature.
Experimental
A transparent multicomponent glass matrix was selected and prepared based on a standard phase diagram of the Li2O–Nb2O5–SiO2 system. The optimized composition of the doping matrix was Li2O–Nb2O5–SiO2–Al2O3 = 35/25/(40 − x)/x (in mol%). Nd2O3 powder was used for Nd3+-doping at the level of 1 mol%. In a typical synthesis, ∼40 g of the raw oxide materials (99.99% purity) was uniformly mixed and melted in a corundum crucible at 1500 °C for 45 min in air. In order to avoid glass crystallization from the melting-quenching method, the melt was poured onto a cold steel plate and pressed with another brass plate. This operation allows the glass to cool quickly and the thickness of the as-produced sample was pressed to ∼1 mm thickness. After that, the samples were isothermally annealed at 450 °C, for 180 min, to release the residual stress in order to prevent breakage in subsequent experiments. The as-quenched samples went through two steps of heat treatment, with preliminary nucleation at a temperature of 580 °C for 2 h and then crystallization at 680 °C for 0, 60, 120, 180 and 240 min, respectively. The samples were labeled LNG-0, LNG-60, LNG-120, LNG-180 and LNG-240, respectively. After the heat treatment, the sample LNG-180 was divided into the required number of small pieces. And then the pieces were coated with silver paste for the ferroelectric and optical measurements.The density of the prepared sample was measured by the Archimedes’ principle. The characteristic temperatures of glass-transition and crystallization temperatures were obtained by a differential scanning calorimeter using a NETZSCH DTA 404 PC instrument with a heating rate of 10 K min−1. To identify the precipitated crystals, the fabricated samples were crushed into powders and investigated by X-ray diffraction (XRD, D2 PHASER, BRUKER) equipped with Cu/Kα radiation. The transmission and absorption spectra were collected using a PerkinElmer Lambda 900 UV-VIS-NIR spectrophotometer in the range of 200–1900 nm. The luminescence spectra were obtained using a Triax 320 type spectrometer equipped with an 808 nm laser diode (LD). The luminescence decay curves were recorded with an 808 nm pulse laser. Polarization–electric field (P–E) curves were measured under a frequency of 10 Hz by using a ferroelectric test system (Radiant Precision Premier II Technology) in a silicon oil bath to avoid electrical discharges. The microstructures in both the glass and the glass–ceramic composite were characterized by transmission electron microscopy (TEM, FEI Tecnai G2 F20 S-WTINE). All the measurements were carried out at room temperature.
Results and discussion
The precursor sample was transparent, and no resulting surface crystallites were observed after annealing. According to the DTA results, the precursor samples were heat treated at 680 °C for 0, 60, 120, 180 and 240 min, respectively. Fig. 1(a) shows the XRD patterns of the prepared samples. The amorphous matrix of the precursor sample is clearly shown with only a broad band. The broad-band curve indicates the nonexistence of grains in the precursor glass. After the heat treatment, the broad band is replaced by a well-defined peak, which proves the existence of crystal phase precipitation in the matrix. It is obvious that all the diffraction peaks ranging from 10 to 80 degrees have good counterparts in the standard pattern of JCPDS file card: 20-0631. All the diffraction peaks can be assigned to LiNbO3 nanocrystals in the glass matrix. Compared with the standard data, the peak position of the prepared samples shifts to a smaller angle. As the Nd3+ (0.0983 nm) ionic radius is larger than the Li+ (0.076 nm)/Nb5+ (0.064 nm) ionic radius, cell distortion occurs when Nd3+ ions are substituted for Li+/Nb5+ ions in the crystal lattice. The peak shift indicates that Nd3+ ions have entered the LiNbO3 phase. The peak intensity increases with the heat treatment time, which suggests that the diameter of the crystal grains grows. The average grain size can be estimated by the Scherrer formula. The crystal grain diameter in the LNG-180 sample was calculated to be about 6 nm by the Scherrer formula, and the diameter of the crystal grains enlarged with heat treatment time. The samples after heat treatment still showed excellent diaphaneity. The transmission spectra of the fabricated samples are shown in Fig. 2(b). It can be concluded that the samples still maintain good transparency after heat treatment, and the NIR transmittance can remain above 65%. There are five distinct downward peaks at 524, 585, 745, 808 and 876 nm, which can be assigned to the absorption transitions of Nd3+: 4I9/2 → 2K13/2 + 4G7/2 + 4G9/2, 4I9/2 → 4G5/2 + 2G7/2, 4I9/2 → 4F7/2 + 4S3/2, 4I9/2 → 4F5/2 + 2H9/2 and 4I9/2 → 4F3/2, respectively. The nanocrystal dispersion, Fresnel scattering and absorption cause the main loss of the sample. It is deduced that the transmittance curve decreases slightly due to the increase in LiNbO3 grains. In addition, the non-uniformity of the glass sample may be responsible for the lower transmittance of the LNG-120 sample at 800 nm. The morphology and structure in the nanocomposite samples were investigated by TEM and high resolution TEM image analysis. As can be seen in the TEM photograph shown in Fig. 1(c), the distribution of nanocrystal grains in the glass matrix is almost uniform. The size of the nanocrystal grains is in line with the XRD result. Fig. 1(d) shows a high resolution TEM image and d-spacing structure. The measured d-spacing value is 3.75 Å, which is consistent with the plane of the hexagonal LiNbO3 crystal, d(012) = 3.75 Å.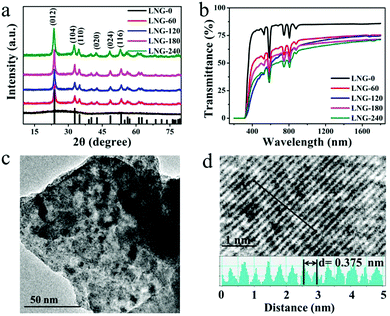 | ||
| Fig. 1 (a) The XRD patterns of the samples. (b) The transmission spectra of the samples. (c) The TEM image of LNG-180. (d) The high resolution TEM image of the lattice fringe. | ||
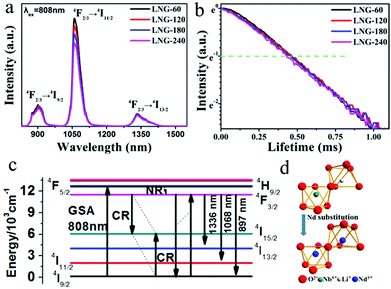
The NIR emissions of the Nd3+ in optical materials have been paid a lot of attention because of their wide applications in the field of laser technology. Fig. 2(a) shows the NIR fluorescence spectra of the Nd doped nanocomposites with no observable Stark splitting by 808 nm pumping. The three NIR emission bands and the related transitions are labeled. With an increase in the heat treatment time, the emission intensity around 1068 nm from Nd3+: 4F3/2 → 4I11/2 is slightly weakened. The decrease in luminescence intensity may be due to the clustering of Nd3+ ions, which are responsible for concentration quenching. In the present case, the Nd3+–Nd3+ ion separation (Ri) in the sample without heat treatment was found to be approximately 11.5 Å. In theory, the relaxation rate caused by concentration quenching varies with R(i). After heat treatment, the LiNbO3 crystal phase has been formed and Nd3+ has split into the residual glassy phase by reducing the inter-ionic separation to less than the 11.5 Å of the precursor glasses. This fact leads to a slight decrease in the intensity of luminescence. As the heat treatment process of the samples proceeds, the emission peaks take shape as in the microcrystalline phase and become sharper. Considering the transmission decreases with increasing the grain size in Fig. 1(b), optical losses such as Fresnel scattering may also cause the slight decrease in NIR emission. The decay curve at 1069 nm of the samples with excitation at 808 nm LD is shown in Fig. 2(b) at room temperature. The measured curve shows an exponential decay, and the excited state lifetime can be estimated from these decay curves. The lifetimes calculated from the fitted decay curves are 0.51, 0.5, 0.48, 0.47 ms, respectively. It can be seen that the excited state (4F3/2 → 4I11/2) lifetime decreases slightly with an increase in duration of heat treatment. This result indicates that Nd3+ ions are clustered in the process of forming the nanocrystalline phase. The volume of the crystals of the samples becomes larger after an extended heat treatment time, which causes concentration quenching in the 4f level electronic transition. Further investigations are underway to inspect the concentration effects and the limiting concentrations formed by clusters in this host. As revealed in Fig. 2(c), the infrared fluorescence spectra (λex = 808 nm) in Fig. 2(a) of the samples demonstrated emissions peaks at 897, 1068 and 1336 nm based on 4F3/2 → 4I9/2, 4F3/2 → 4I11/2 and 4F3/2 → 4I13/2 electronic transitions. In Fig. 2(c), GSA, CR, NR, and R represent absorption, cross-relaxation, energy migration, non-radiative transition, and radiation transition, respectively. In perovskite crystals, Li+ and Nb5+ occupy a symmetric octahedral position at point C3 or nearly C3v. According to previous reports, rare earth ions can enter the sites of both Li+ and Nb5+ in the lattices of LiNbO3,26 and some rare earth ions are more likely to replace the position of Li+ as it enters the crystal.27 However, there is an obvious difference in ionic radius and charge that will cause remarkable distortion of the lattice structure. The 3D unit cell model of the crystal is characterized in Fig. 2(d) for a deeper understanding of the structure of LiNbO3. Each crystal lattice is represented by a different color in the figure. The blue atoms represent the Nd3+ ions mixed into the LiNbO3 crystal lattice. Considering the study of the Nd3+ doped LiNbO3 crystal,26Fig. 2(d) clearly displays that the Nd3+ ions can replace Li+ and Nb5+. From the point of view of its ferroelectric structure, below the Curie temperature, the position of each layer shows a slight displacement, from the position of the oxygen layer (Li+) or the oxygen layer (Nb5+), caused by internal spontaneous polarization.28
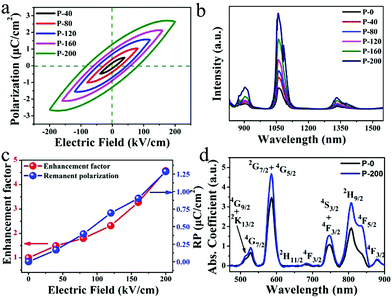
The above results confirmed that Nd doped ferroelectric LiNbO3 nanocrystals formed in the glass matrix. The doping concentration and grain size seem to have little effect on the NIR emission. Considering the ferroelectric properties of the prepared composites, the NIR luminescence of Nd3+ is studied with an electric field. The fabricated samples are loaded with an electric field and the results are presented in Fig. 3. P-i (i = 0, 40, 80, 120, 160 and 200) designate that the sample is loaded with electric fields of 0, 40, 80, 120, 160 and 200 kV cm−1, respectively. The P–E loops in Fig. 3(a) clearly show different polarization performances in samples loaded with elevated electric fields. After polarization with different electric fields, the P-i samples possess dissimilar remanent polarization. The breakdown electric field of the sample in this article is 232 kV cm−1. Fig. 3(b) shows the effects of an electric field on the luminescence of LNG samples under excitation at 808 nm LD. It is remarkable that the luminescence intensity is enhanced with an increment in the electric field, which is related to the remnant polarization shown in Fig. 3(a). The luminescence peak at 1068 nm is significantly enhanced, with a maximum increase of 4.6 times compared to the sample without electric polarization. Nd can be employed as a spectral probe, suggesting that its ligand field is modified by an electric field. Fig. 3(c) clearly illustrates the positive relationship between the remnant polarization and luminescent intensity at 1068 nm, which was induced by the electric field. This good positive correlation provides reliable evidence for this study. There is an almost linear correlation between electric field and NIR luminescence. Thus, the change in luminescence can reflect the strength of the electric field. Fig. 3(d) shows the absorption spectra of P-0 and P-200 samples ranging from 470 to 900 nm at room temperature. It can be found that the Nd3+ ions have multiple energy levels, and the absorption spectra are in accordance with the electric dipole transitions from the Nd3+: 4I9/2 ground state to diverse excited states. The absorption spectra have a strong absorption peak at 808 nm, demonstrating that the excitation by the 808 nm laser is reasonable. The absorption coefficients of P-0 and P-200 are 1.937 and 3.203 cm−1, respectively, at 808 nm, which have increased by 62.6%. This phenomenon implies that the electrically polarized samples can absorb the excitation photons more effectively, and then generate NIR photons more effectively.
To understand the mechanism of electrical enhancement in NIR emission, the crystal structures of the polarized samples have been recorded. The diffraction peaks around 24° of the crystal plane (012) in the P-i samples are shown in Fig. 4(a), indicating LiNbO3 ferroelectric nanocrystals with varying degrees of remnant polarization. The 2θ of the plane (012) diffraction peaks in P-0 and P-200 were 23.7 and 23.84, respectively. According to the Bragg equation, the interplanar (012) spacing of LiNbO3 is reduced by 0.022 Å after loading with 200 kV cm−1. This result confirms that the crystal structure changes. It is known that the ferroelectric crystal lattice will change due to polarization under an electric field. After applying an electric field, the remnant polarization induces changes in the crystal structure around Nd3+, and thus the NIR emission is modulated. For the purpose of understanding the influence of remnant polarization on luminescence emissions, a schematic diagram in Fig. 4(b) shows the alteration of the ligand field around the Nd3+. After applying the electric field, the ions are polarized, leaving their original position relative to the oxygen layer.
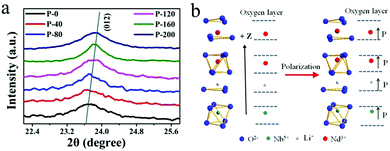 | ||
| Fig. 4 (a) XRD pattern of the (012) crystal plane in the P-i sample. (b) The positions of the atoms corresponding to the oxygen layer after polarization. | ||
Consequently, different remnant polarizations are retained in the crystal lattice. Referring to Fig. 3(a), the formation of ordered ferroelectric domains induces a reduction in lattice symmetry which can be confirmed by the XRD pattern of Fig. 4(a). The formation of ferroelectric domains causes the lattice to be distorted under a strong electric field and these distortions induce a distortion of structural symmetry. Generally, the domains of the ferroelectric materials exhibit orientation polarization under or after loading with an electric field. Orientation polarization also affects the physical properties, including the luminescence. The ligand field of Nd3+ ions is modified by the distortion of the crystal lattice and orientation polarization. Then the uneven crystal field can make a mixture of opposite-parity states in the 4f configuration level, which would induce the intensification of the 4f–4f transitions from the 4I9/2 level to the excited state. The slight migration of the Nd3+ ion position in the lattice by polarization causes the electric dipole transition probabilities to undergo a gradual increase, and thus the luminescence intensity can be effectively modulated.
Based on the external electric field induced modulation of luminescence, the sample was repeatedly loaded with electric fields of 150 and −50 kV cm−1, respectively. The results of polarized NIR fluorescence are recorded for designing memory devices. Fig. 5(a) shows the modification of the luminescence intensity in accordance with the alteration caused by imposing voltage pulses with E = −50 kV cm−1 for the ‘OFF’ state and E = 150 kV cm−1 for the ‘ON’ state, respectively. When an electric field of 150 kV cm−1 is applied, the ferroelectric nanocrystal lattice distortion causes enhanced luminescence of the dopant Nd. When the reverse voltage of −50 kV cm−1 is loaded, the lattice distortion is reduced to cause decreased luminescence. After the voltage was loaded multiple times, the sample maintained this characteristic and the luminescence modulation was stable. As shown in Fig. 5(b), the samples maintained good nonvolatility and reversibility in the five tests performed after each loading of the electric field. This nonvolatile and reversible feature opens up significant avenues for reliable optical switches and information storage materials.29 Such an electric control of luminescence in a reversible way can be used in optical switches. Moreover, compared with the complicated detection in MRAM and the destructive reading in FeRAM, lanthanide Nd doped ferroelectric nanocomposites have the advantages of fast electric field writing and convenient optical reading. And rare earth ions have rich luminescent levels (e.g., Nd3+: 4F3/2 → 4I9/2, 4F3/2 → 4I11/2 and 4F3/2 → 4I13/2), which can achieve multiple detection to ensure the reliability of data. As we have reported above, it can be concluded that luminescence emissions of Nd3+ doped LNG can be effectively modulated by an electric field, and the luminescence emission is modulated reproducibly. Ferroelectric oxide doped luminescent ions possess unique luminescence and inherent ferroelectric properties. Nonvolatile and reversible modulation in optical properties can be achieved without changing the composition. Thereby the developed ferroelectric oxides with luminescent ions have great potential in luminescence memory, optical switches and optoelectronic devices.
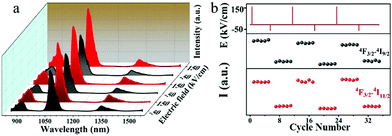 | ||
| Fig. 5 (a) Reversible luminescence modulation of the sample when regularly loaded with electric fields. (b) Nonvolatile luminescence tuning after repeated external pulsed electric field testing. | ||
Conclusions
In conclusion, we explored the electric-induced enhancement and reversible modulation of NIR luminescence using well-fabricated Nd doped ferroelectric nanocomposites at room temperature. The developed sample simultaneously possesses NIR luminescence and ferroelectric properties. Taking advantage of electric polarization, the NIR emission is effectively enhanced by 4.6 times due to the modulated crystallographic symmetry around Nd3+. More importantly, unlike chemical methods, this modulation is reversible and nonvolatile in a solid sample, which is promising for luminescence memory. XRD results and absorption and photoluminescence spectra have verified this electric-luminescence coupling phenomenon. And the results are not only applicable to the Nd3+ doped ferroelectric samples explored in this experiment. This will also stimulate the study of novel optoelectronic materials and devices, such as luminescent memory, photoelectric modulators, and optical switch devices.Conflicts of interest
There are no conflicts to declare.Acknowledgements
This work was supported by the Chinese National Natural Science Foundation (No. 61705214, 61605192 and 61775205); and the Zhejiang Provincial Natural Science Foundation of China (No. LD18F050001).Notes and references
- Y. Wang, K. Zheng, S. Song, D. Fan, H. Zhang and X. Liu, Chem. Soc. Rev., 2018, 47, 6473–6485 RSC.
- M. Chen, H. Hu, Y. Tan, N. Yao, Q. Zhong, B. Sun, M. Cao, Q. Zhang and Y. Yin, Nano Energy, 2018, 53, 559–566 CrossRef CAS.
- Q. Zhang and Y. Yin, Sci. Bull., 2018, 63, 525–526 CrossRef CAS.
- Y. Zhang, W. Jie, P. Chen, W. Liu and J. Hao, Adv. Mater., 2018, 30, 1707007 CrossRef PubMed.
- H. Zhang, D. Peng, W. Wang, L. Dong and C. Pan, J. Phys. Chem. C, 2015, 119, 28136–28142 CrossRef CAS.
- Z. Xia and Q. Liu, Prog. Mater. Sci., 2016, 84, 59–117 CrossRef CAS.
- S. Lv, B. Shanmugavelu, Y. Wang, Q. Mao, Y. Zhao, Y. Yu, J. Hao, Q. Zhang, J. Qiu and S. Zhou, Adv. Opt. Mater., 2018, 1800881 CrossRef.
- D. Peng, Q. Ju, X. Chen, R. Ma, B. Chen, G. Bai, J. Hao, X. Qiao, X. Fan and F. Wang, Chem. Mater., 2015, 27, 3115–3120 CrossRef CAS.
- S. Shi, L. D. Sun, Y. X. Xue, H. Dong, K. Wu, S. C. Guo, B. T. Wu and C. H. Yan, Nano Lett., 2018, 18, 2964–2969 CrossRef CAS PubMed.
- G. Bai, M.-K. Tsang and J. Hao, Adv. Opt. Mater., 2015, 3, 431–462 CrossRef CAS.
- Y. Liu, D. Wang, J. Shi, Q. Peng and Y. Li, Angew. Chem., Int. Ed., 2013, 52, 4366–4369 CrossRef CAS PubMed.
- X. Wang, H. Zhang, R. Yu, L. Dong, D. Peng, A. Zhang, Y. Zhang, H. Liu, C. Pan and Z. L. Wang, Adv. Mater., 2015, 27, 2324–2331 CrossRef CAS PubMed.
- H. Sun, X. Wu, D. F. Peng and K. W. Kwok, ACS Appl. Mater. Interfaces, 2017, 9, 34042–34049 CrossRef CAS PubMed.
- J. Wu, N. Qin and D. Bao, Nano Energy, 2018, 45, 44–51 CrossRef CAS.
- J. Wu, Q. Xu, E. Lin, B. Yuan, N. Qin, S. K. Thatikonda and D. Bao, ACS Appl. Mater. Interfaces, 2018, 10, 17842–17849 CrossRef CAS PubMed.
- Y. Yu, Z. Fang, C. Ma, H. Inoue, G. Yang, S. Zheng, D. Chen, Z. Yang, A. Masuno, J. Orava, S. Zhou and J. Qiu, NPG Asia Mater., 2016, 8, e318–e318 CrossRef CAS.
- R. Zhang, Z. Song, L. He, Z. Xia and Q. Liu, J. Alloys Compd., 2017, 729, 663–670 CrossRef CAS.
- D. K. Khatua, A. Kalaskar and R. Ranjan, Phys. Rev. Lett., 2016, 116, 117601 CrossRef PubMed.
- Q. Yao, F. Wang, F. Xu, C. M. Leung, T. Wang, Y. Tang, X. Ye, Y. Xie, D. Sun and W. Shi, ACS Appl. Mater. Interfaces, 2015, 7, 5066–5075 CrossRef CAS PubMed.
- G. Bai, M.-K. Tsang and J. Hao, Adv. Funct. Mater., 2016, 26, 6330–6350 CrossRef CAS.
- J. Hao, Y. Zhang and X. Wei, Angew. Chem., Int. Ed., 2011, 123, 7008–7012 CrossRef.
- W. Lu, Z. Gao, X. Liu, X. Tian, Q. Wu, C. Li, Y. Sun, Y. Liu and X. Tao, J. Am. Chem. Soc., 2018, 140, 13089–13096 CrossRef CAS PubMed.
- H. Vigouroux, E. Fargin, S. Gomez, B. Le Garrec, G. Mountrichas, E. Kamitsos, F. Adamietz, M. Dussauze and V. Rodriguez, Adv. Funct. Mater., 2012, 22, 3985–3993 CrossRef CAS.
- Z. Wu, G. Bai, Q. Hu, D. Guo, C. Sun, L. Ji, M. Lei, L. Li, P. Li, J. Hao and W. Tang, Appl. Phys. Lett., 2015, 106, 171910 CrossRef.
- G. Gao, D. Busko, S. Kauffmannweiss, A. Turshatov, I. A. Howard and B. S. Richards, J. Mater. Chem. C, 2018, 6, 4163–4170 RSC.
- L. Rebouta, J. C. Soares, M. F. D. Silva, J. A. Sanz-García, E. Dieguez and F. Agulló-López, J. Mater. Res., 1992, 7, 130–135 CrossRef CAS.
- D. Tu, C.-N. Xu, A. Yoshida, M. Fujihala, J. Hirotsu and X.-G. Zheng, Adv. Mater., 2017, 29, 1606914 CrossRef PubMed.
- M. P. Fernandes Graça and M. A. Valente, MRS Bull., 2017, 42, 213–219 CrossRef.
- M. Zheng, H. Sun, M. K. Chan and K. W. Kwok, Nano Energy, 2019, 55, 22–28 CrossRef CAS.
| This journal is © The Royal Society of Chemistry 2019 |

