 Open Access Article
Creative Commons Attribution 3.0 Unported Licence
Rapid isotopic analysis of uranium, plutonium, and americium in post-detonation debris simulants by RIMS†
Michael R.
Savina
 *,
Danielle Ziva
Shulaker
 ,
Brett H.
Isselhardt
 and
Gregory A.
Brennecka

Lawrence Livermore National Laboratory, Nuclear and Chemical Sciences Division, USA. E-mail: savina1@llnl.gov
First published on 3rd May 2023
Abstract
We demonstrate rapid isotopic analysis of trace U, Pu, and Am in solid basalt matrices using resonance ionization mass spectrometry (RIMS). The samples were intended to mimic post-detonation debris from a nuclear explosion, in which material from the device is intimately mixed with entrained material from the environment. Complete isotopic analysis of materials containing ppm to ppb levels of the actinides was done without separating them from the host matrix, and consumed <100 ng of sample. Measured isotopic compositions of U, Pu, and Am were accurate to ≤10% for most isotope ratios except 238Pu, which was compromised by low concentration and excesses of 238U up to 34![[thin space (1/6-em)]](https://www.rsc.org/images/entities/char_2009.gif) 000
000![[thin space (1/6-em)]](https://www.rsc.org/images/entities/char_2009.gif) :
:![[thin space (1/6-em)]](https://www.rsc.org/images/entities/char_2009.gif) 1. A new method called “blinking” that takes advantage of the singular ability of RIMS to quantify backgrounds from all sources rapidly and accurately was developed for the analysis of 238Pu. Using the blinking method we accurately measured the 238Pu/239Pu ratio on a sample containing 1.4 × 10⁶ atoms of 238Pu at a concentration of 0.1 ppb in the host material.
1. A new method called “blinking” that takes advantage of the singular ability of RIMS to quantify backgrounds from all sources rapidly and accurately was developed for the analysis of 238Pu. Using the blinking method we accurately measured the 238Pu/239Pu ratio on a sample containing 1.4 × 10⁶ atoms of 238Pu at a concentration of 0.1 ppb in the host material.
Introduction
Mass spectrometry is at present the most accurate and precise method to determine actinide isotopic compositions, however the inability to discriminate against isobars means that time-consuming dissolution and chemical purification is required prior to instrumental analysis for many elements. For example U, Pu, and Am must be separated from one another to break the isobaric pairs 238Pu/238U and 241Am/241Pu. Further, 238U blanks in the separation process are nearly always too high to allow direct analysis of 238Pu, so that a combination of alpha spectrometry and mass spectrometry must be used to determine the 238Pu/239Pu ratio.1–3Several forms of mass spectrometry can discriminate against isobars at some level. For example, because U, Pu, and Am all have different volatilities, thermal ionization mass spectrometry (TIMS) can be used to separate them as long as the level of isobaric interference is not too high. Continuous heating of samples containing Am, Pu, and U can in principle separate 241Am from 241Pu in many practical samples since the relative amounts of these two isobars is generally within an order of magnitude of one another.4,5 The continuous heating method is also capable of measuring the 238Pu/239Pu ratio in relatively pure actinide samples in which the 238U/238Pu ratio is up to ∼300.4 Solutions of mixed actinides can be analyzed for 238Pu in inductively coupled mass spectrometers equipped with collision cells to convert 238U to 238UOx while leaving Pu in the atomic form. This method has been successfully applied to measure the 238Pu/239Pu ratio in samples with 238U/238Pu ratios as high as 4000.6,7 Importantly however, none of these capabilities has so far been demonstrated on samples representative of post-detonation debris, in which the actinides are present as trace elements (≤ppm) in an environmental matrix and the 238U/238Pu is significantly higher than 4000.
Resonance ionization mass spectrometry (RIMS) has been used to measure isotope ratios in mixed actinide samples without chemical purification, and has demonstrated the ability to measure 241Pu and 238Pu in both pure standard materials and spent nuclear fuel, including spent fuel particles from the Chernobyl Exclusion Zone that have significant environmental exposure.8–13 While spent fuel is significantly more challenging than pure standard materials, its Pu and Am concentrations are of order percent. Furthermore, spent fuel contains at most a few percent of non-actinides (excluding oxygen), and these are restricted to fission products, whereas post-detonation debris is overwhelmingly light elements (≤Fe) from the immediate environment of the explosion.
In this work we report RIMS analyses of samples intended to mimic the challenge associated with debris produced by a nuclear device, namely the accurate determination of actinide isotopic compositions at trace levels in environmental matrices. We apply a previously developed RIMS method12 for the simultaneous determination of U, Pu, and Am isotopic compositions in solid samples of basalt geostandards spiked with trace amounts of U, Pu, and Am. In addition, we introduce a new method we call “blinking” for the measurement of 238Pu/239Pu that allows for accurate quantification and correction of backgrounds associated with 238U and other background counts arising from light elements in the matrix. We successfully applied this method to materials with sub-ppb levels of 238Pu that have 238U/238Pu ratios up to 3.4 × 10⁴.
Experimental
Standards
Isotopic standards were used to correct the data for instrumental fractionation. Plutonium isotopic standards CRM 126 and CRM 137 were electrodeposited from acid solutions onto Ta metal stubs and dried. In addition, spent fuel from a pressurized water reactor was electrodeposited onto a Ta stub and used as a standard for U, Pu and Am. The fuel from a Belgian pressurized water reactor (hereafter BR-3) was purified using an established procedure involving lanthanum fluoride co-precipitation, followed by anion exchange chromatography.14 The purified fractions were analyzed for U, Am, and 239–242Pu by inductively-coupled plasma isotope dilution mass spectrometry (ID-ICP-MS). The Pu fraction was further analyzed for 238Pu using a combination of ID-ICP-MS and alpha spectrometry. The isotope ratios for all materials in this work were decay-corrected to their various reference dates.Samples
Solutions of actinide standards mixed at trace levels with basalt matrices were prepared as test samples. First, a 1 mL aliquot of 15 mg of the geostandard BHVO-2 (USGS Hawaiian basalt) was prepared by removing the natural uranium following the Weyer et al. (2008) procedure.15 The uranium-free matrix was admixed with 35 ng of U isotopic standard CRM U500 and 10 ng of Pu isotopic standard CRM 137 in 6 N HCl. Four additional samples were prepared using 5 mg of the geostandard BCR-2 (USGS Columbia River basalt) in 1 mL aliquots of 6 N HCl. No chemical separations were performed to remove natural U prior to actinide addition. These were designated BCR-2A, B, C, and D. Actinide isotopic standards CRM U630 (U), monoisotopic 237Np, CRM 137 (Pu), and IRMM-0243 (Am)16 solutions were added to the BCR-2x solutions in the quantities shown in Table 1. This suite of sample solutions was used in the development of other analytical methods in addition to the RIMS work presented here. We did not analyze for Np by RIMS, however its presence allowed us to estimate the ability of RIMS to discriminate against it. One-microliter aliquots of these solutions were pipetted onto Ti metal stubs and dried with a hot air gun, to give ∼5 μg of the BCR-2x samples and 15 μg of the BHVO sample. Titanium was used as a substrate for the samples rather than Ta because it gave the best results in terms of background noise and signal levels per unit desorbing laser power (see Discussion section). The concentrations of actinides in the dried materials are given in Table 2.| Sample | Matrix (mg) | U (ng) | Np (ng) | Pu (ng) | Am (ng) |
|---|---|---|---|---|---|
| BHVO-2 | 15 | 35 | — | 10 | — |
| BCR-2A | 5 | 604 | 0.6 | 5.7 | 0.4 |
| BCR-2B | 5 | 124 | 0.11 | 1.16 | 0.08 |
| BCR-2C | 5 | 29.2 | 0.03 | 0.27 | 0.02 |
| BCR-2D | 5 | 1190 | 1.1 | 11.1 | 0.75 |
| Sample | U | Np | Pu | Am |
|---|---|---|---|---|
| BHVO-2 | 2.3 | 0.1 | 0.65 | 0.02 |
| BCR-2A | 123 | 0.12 | 1.1 | 0.11 |
| BCR-2B | 26 | 0.022 | 0.23 | 0.023 |
| BCR-2C | 7.5 | 0.006 | 0.053 | 0.006 |
| BCR-2D | 228 | 0.22 | 2.1 | 0.217 |
Measurements
All RIMS measurements were made on the LION instrument at Lawrence Livermore National Laboratory. The RIMS technique and the LION instrument have been described in detail elsewhere.17–19 Two different analytical procedures were used in this work, one for simultaneous U, Pu, and Am analysis which was used for all isotopes except 238Pu, and one specifically for measuring the 238Pu/239Pu ratio.The procedure for simultaneous U, Pu, and Am analysis was described in ref. 12. In brief, a pulsed Nd:YAG laser (1064 nm, 7 ns full width at half-maximum, 1000 Hz) focused to an elliptical 150 × 300 μm spot volatilized material from the samples. The sample was held at a potential of −200 V so that positive ions created by the laser pulse were accelerated back onto the sample. After a delay of 1.5 μs, neutral gas-phase atoms of U and Am were resonantly ionized with pulses from two tunable Ti:sapphire lasers aligned colinearly ∼1 mm above the sample surface, and the target potential was raised to 3 kV to accelerate the U and Am photoions into a time-of-flight mass spectrometer. After a further delay of 0.4 μs three lasers tuned to sequentially excite and ionize Pu were pulsed. The delayed ionization resulted in delayed arrival of Pu on the detector and resolved the isobars at m/z 238 and 241.
Laser parameters used in the simultaneous procedure are given in Table 3. The U RIS scheme is one-color (i.e. it uses only one laser), and requires 7.2 MW cm−2 to achieve 95% ionization. The irradiance was 6.8 MW cm−2 for this study, corresponding to >90% ionization. The laser parameters for the Pu three-color RIS scheme were similarly set to achieve >90% ionization. The efficiency of the Am two-color scheme was not determined. Note that these ionization efficiencies refer only to the ground-state neutral atoms overlapped by the laser beams; actinide atoms bound in molecules in the gas phase (e.g., UOx) or neutral atoms electronically excited by the laser desorption process will not be ionized. Our previous studies on U show that these ground-state neutral loss channels are the major factors in determining the overall detection efficiency of the technique, which for U detection from solid uranium dioxide ranges from 0.4% to 6.6% depending on how the sample is treated to affect chemical reduction of the sample surface prior to analysis.20,21
| Lasera | Wavelength (nm) | Power (W) | Diameterbc(mm) | Pulse widthb (ns) | Irradiance (MW cm−2) |
|---|---|---|---|---|---|
| a The pulse repetition rate for all lasers was 1 kHz. Roman numerals refer to the step in the ionization process. b Full width at half maximum. c Average of major and minor axes; ellipticities ranged from 1.0 to 1.3. | |||||
| U & Am(II) | 396.263 | 0.640 | 1.34 | 12.0 | 6.8 |
| Pu(I) | 420.766 | 0.0035 | 1.29 | 10.8b | 0.044 |
| Pu(II) | 847.272 | 0.082 | 1.50 | 15.5 | 0.54 |
| Pu(III) | 767.530 | 0.850 | 1.56 | 8.8 | 9.1 |
| Am(I) | 426.676 | 0.042 | 1.17 | 34.0 | 0.21 |
The procedure for measuring the 238Pu/239Pu ratio by “blinking” two lasers is new. Here a fourth laser tuned to be 0.2 nm off resonance in the second step was added to the Pu RIS scheme. The on- and off-resonance second step lasers were operated at 500 Hz and interleaved so that every even laser shot was on resonance and every odd shot was off resonance. The off-resonance spectra were subtracted from the on-resonance spectra to produce the final result. The pulse widths and M2 values (focusability) of the two second-step lasers were slightly different, so the powers were adjusted such that the irradiances were equal within 1%. The laser parameters for the blinking scheme are given in Table 4. The on-resonance Pu laser tunings here are slightly different than those used in the simultaneous scheme. In the simultaneous scheme the lasers are tuned to the midpoint of the Pu isotopic resonances to minimize fractionation due to isotope shifts.22 In the blinking scheme the lasers are tuned to the 239Pu isotopic resonances, which are close enough to the 238Pu resonances such that both are well within the bandwidth of the lasers. The isotope shifts between 238Pu and 239Pu are 2, 5, and 0 pm for the three steps in the RIS scheme; the laser bandwidths were ∼10 pm (FWHM) for the first step and ∼20 pm for the second and third steps. This results in efficient ionization of 238Pu and 239Pu but less efficient ionization of the heavier Pu isotopes 241Pu and 242Pu since their resonances are at the edges of the laser bandwidths. Another difference from the simultaneous procedure is that the laser irradiances are lowered to minimize backgrounds caused by photofragmentation of molecules.
| Lasera | Wavelength (nm) | Power (mW) | Repetition rate (Hz) | Diameterb,c (mm) | Pulse widthb (ns) | Irradiance (MW cm−2) |
|---|---|---|---|---|---|---|
| a Roman numerals refer to the step in the ionization process; ON and OFF refer to on resonance and off resonance. b Full width at half maximum. c Average of major and minor axes; ellipticities ranged from 1.1 to 1.4. | ||||||
| Pu(I) | 420.762 | 6.4 | 1000 | 1.2 | 22.7 | 0.024 |
| Pu(II) ON | 847.284 | 40 | 500 | 1.6 | 13.3 | 0.306 |
| Pu(II) OFF | 847.484 | 29 | 500 | 1.4 | 12.5 | 0.309 |
| Pu(III) | 767.530 | 390 | 1000 | 1.4 | 11.7 | 2.2 |
Results
Simultaneous actinide analysis
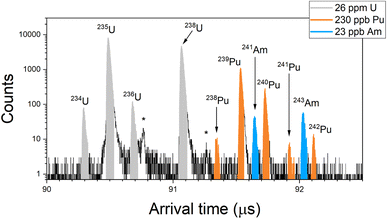
Fig. 1 shows a RIMS spectrum obtained from the BCR-2B solution (26 ppm total U, 230 ppb total Pu, 23 ppb total Am) in the simultaneous mode. The colored regions indicate peaks due to U, Pu, and Am, and show baseline resolution for the isobars at m/z 238 and 241. Nonetheless there are still non-resonant contributions to these peaks. Non-resonant production of U+ is evident in the peak at 90.76 μs (marked with a star in Fig. 1), which is due to 235U ions created by the pulse-delayed Pu lasers. This could be due either to direct ionization of 235U atoms or photofragmentation of U-bearing molecules such as 235UOx. The intensity of this peak compared to that of the resonant 235U implies a relative sensitivity factor (RSF) of 0.2% for the non-resonant processes compared to resonant U ionization, however this can vary by a factor of two to three for these materials owing to differences in the desorbing laser power. (Samples with lower actinide content require higher laser power to achieve count rates comparable to those with higher actinide content.) The non-resonant 235U peak was previously used to correct the U interference on 238Pu in spent fuel samples.12 In present case the implied amount of non-resonant interference is ∼1.5× the expected 238Pu resonant signal which, together with the variability, renders this method untenable for accurate quantification.Likewise, a small peak at 91.27 μs (also starred in Fig. 1) is due to non-resonant production of 239Pu by the U and Am lasers. The RSF is 0.5% compared to resonant Pu, which is far too low for non-resonant 238Pu to have any significant impact on 238U, nor for non-resonant 241Pu to contribute significantly to 241Am. In the spectrum of Fig. 1 the Pu interference on 238U is 1 × 10⁻⁵, and on 241Am it is 4 × 10⁻⁴.
The spectrum of Fig. 1 shows no peak above background at m/z 237 even though the sample contained 237Np. Given the relative amounts here it is unlikely that off-resonant ionization would result in a noticeable peak (Table 2). Even at an RSF of one compared to U, which is >100× higher than we expect based on the measured RSFs given above, an off-resonant peak Np would only be roughly the size of the 241Pu peak in this spectrum.
Fig. 1 also shows background ion counts that appear more or less uniformly distributed across the spectrum. This is not seen in analyses of purified actinide materials (i.e. standards). Some of this background is secondary ions created by the laser desorption pulse. Though the sample is negatively biased to attract these ions back to the sample, fast-moving or late-emitted ions can still be accelerated into the drift tube and reach the detector. These can have a continuous distribution of energies and times-of-birth, and therefore a continuous distribution of arrival times.
Another source of this distributed background is late fragmentation of molecules that causes low-mass ionic fragments to appear at long arrival times. In general, for every actinide atom in the sample there are from ∼106 to ∼1010 atoms of lighter elements. (The atom fraction of U in the most concentrated sample is ∼10−6, the atom fraction of Am in the least concentrated sample is ∼5 × 10⁻¹¹.) Therefore, even if laser spectroscopic discrimination against photofragmentation is high, some level of non-resonant ion production would be expected. SIMION modeling of the LION instrument (which is beyond the scope of this work and is not included here) indicates that late fragmentation of SiOx molecules can result in Si+ ions with arrival times >90 μs, which is in the actinide region of the ToF spectrum. Such events are rare; however given the large excess of light elements in the sample even low probability events would explain the background noise. For simultaneous actinide spectra such as Fig. 1, we applied corrections by measuring the background in gaps between peaks. Uncertainties due to the background correction are included in the reported data. (See ESI† for a derivation of uncertainty.)
Fig. 2 is a picture of one of the dried samples of BCR-2B after multiple analyses, and shows desorption laser spots. The spectrum of Fig. 1 and the isotope data below were collected from a single desorption laser spot. The overall detection efficiency can be estimated as follows. The laser spots are ∼0.15 × 0.3 mm and the overall sample is ∼2.5 mm in diameter, therefore each laser spot covers (0.15 × 0.3/2.52) ≈ 0.7% of the sample. Given the number of actinide atoms in sample BCR-2B and the number of ions detected in the spectrum of Fig. 1, we estimate detection efficiencies of order 10−4 for U and 10−3 for Pu and Am. We have not measured our Pu or Am efficiencies on other materials, however the U efficiency is much less than expected based on previous work, in which detection efficiencies of at least 4 × 10⁻³ were observed on solid uranium dioxide.20 Strictly speaking, a quantitative comparison is not possible since the desorption mechanism is different (laser vs. ion gun), so the reasons for the discrepancy are unclear. In previous work we showed that the dominant factor in determining the U useful yield is the strong tendency for U to form gas-phase UOx molecules upon desorption rather than the ground state neutral atoms that are necessary for RIMS. However even in uranium dioxide (i.e. a highly oxidized form of U) the useful yield for untreated samples is a factor of 40 higher than observed here.17,20 The chemical form of the U in these samples is unknown since it is present as a trace constituent in a basalt matrix deposited from HCl. Nonetheless, despite the lower-than-expected efficiency (and excepting 238Pu), the current method was successful in measuring U, Pu, and Am isotopic compositions simultaneously on an analysis spot containing ∼1 pg of total U, 10 fg of total Pu, and 0.1 fg of total Am directly from a solid.
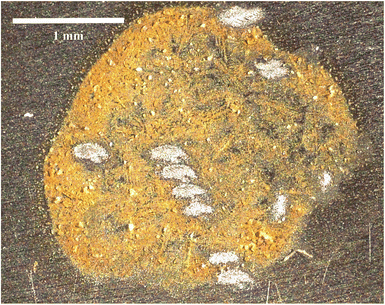 | ||
| Fig. 2 Optical micrograph of sample BCR-2B deposited on a Ti metal substrate. The desorption laser spots from multiple analyses are clearly visible. | ||
238Pu analysis
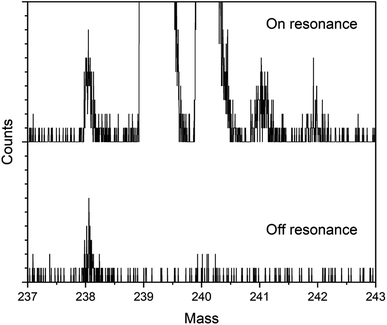
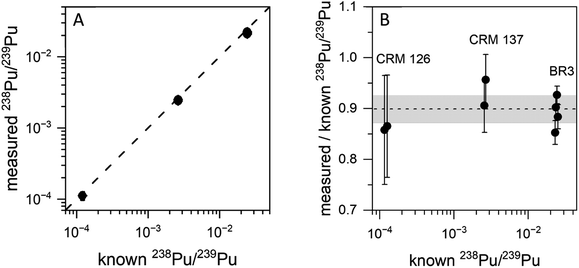
Fig. 3 shows on- and off-resonance spectra from the blinking scheme applied to sample BCR-2B. Here the 238Pu concentration is 0.47 ppb and the 238U/238Pu ratio is 2.2 × 10⁴. The off-resonance spectrum shows excellent extinction of 239–242Pu. The residual at m/z 238 is comprised primarily of off-resonance generation of 238U ions that appear at m/z 238, as well as background noise from late-fragmenting molecules that is distributed more or less evenly across the spectrum. In this case the on-resonance signal at m/z 238 was 169 counts, while the off-resonance signal was 79 counts. This implies an on-resonance discrimination factor of ∼2.5 × 10⁴ for this sample. That is, when tuned on resonance, the detection efficiency for 238Pu in this sample matrix is ∼2.5 × 10⁴ times higher for 238Pu than for 238U.The blinking scheme was applied to the three materials with known 238Pu/239Pu ratios (CRM 126, CRM 137, and spent fuel BR3) to ascertain its accuracy and precision. Fig. 4 shows the measured vs. known 238Pu/239Pu ratio for the three standard materials, as well as the instrumental fractionation (the measured ratio divided by the known ratio) as a function of the known 238Pu/239Pu ratio. Fractionations were consistent for all samples across two days. The weighted average of the eight measurements was 0.899(14), with a mean square weighted deviation of 1.2, indicating that there is no statistical difference between the measurements. This is significant since the three materials contain varying amounts of 238U. The two CRM standards contain only trace amounts of 238U, primarily from decay of 242Pu (t1/2 = 3.75 × 10⁵ year), which results in a 238U/238Pu ratio of less than one. However, the BR3 sample has a 238U/238Pu ratio of 7400. The statistical indistinguishability of the measured 238Pu/239Pu ratio across the three materials validates the high discrimination against 238U. In practice, we measured the BR3 sample each day as a standard and used the result to normalize the 238Pu/239Pu measurements on the “unknown” BCR-2x and BHVO samples.
The detection efficiency for 238Pu analysis by the blinking method was estimated in the same way as for the simultaneous method above using the spectra in Fig. 3. The 238Pu efficiency was 2.2 × 10⁻³. The 239Pu efficiency was in agreement: 2 × 10⁻³. The amount of 238Pu consumed for analysis was 18 attograms (45![[thin space (1/6-em)]](https://www.rsc.org/images/entities/char_2009.gif) 000 atoms).
000 atoms).
Actinide isotopic compositions
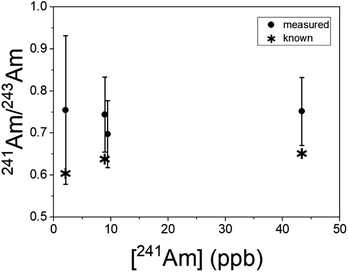
Uranium isotopic results on actinide-spiked BCR-2x and BHVO-2 samples are shown in Fig. 5. Because the BCR sample contains natural U,23 the isotopic composition of each sample varies as a function of the spike concentration. (Known isotope ratios for all samples are given in the ESI.†) For purposes of comparison, Fig. 5 shows the ratios as deviations from the known ratios (rather than the measured ratios themselves) vs. the concentration of the minor isotope in the dried sample. While 234U/238U and 236U/238U are consistent with the calculated ratios within uncertainty, the 235U/238U ratios are significantly lower. We hypothesize that this is due to natural U in the Ti substrate, and indeed natural U is present in RIMS spectra obtained from the bare Ti metal. The contribution of substrate U to the RIMS spectrum is variable because the sample thickness and desorbing laser power vary from spot to spot and sample to sample. Because the sample surface coverage was not continuous (see Fig. 2) the desorption laser hits varying amounts of bare substrate from sample to sample. Further, the amount of U leached into the deposited material from the Ti substrate likely varies from sample to sample since it depends on the time and temperature required to dry each sample, which were not controlled. Nonetheless, despite variable contamination from the Ti substrate, the ratios are almost all consistent with the known values at ≤10%, even for isotopes present at tens to hundreds of ppb in the solid matrix.Americium results for the BCR-2x samples are shown in Fig. 6. (The BHVO sample was not spiked with Am.) The actual 241Am/243Am ratios varied slightly from sample to sample due to slightly differing admixtures of CRM 137 and IRMM-0243. At the time of these analyses CRM 137 contained 3% 241Am (atom fraction) from decay of 241Pu, so this is taken into account in calculating the actual 241Am/243Am ratios in the samples. The calculated ratios are marked with asterisks in Fig. 6. The measured ratios all agree with the calculated values at ∼1σ, though they are systematically higher by 10–15% for the more concentrated samples and 25% for the least concentrated one. This is not due to non-resonant ionization of 241Pu. The 241Pu/241Am ratio in these samples is 0.1, therefore a 10% interference on 241Am would require equal ionization efficiency of Am and Pu by the Am + U lasers. As shown above, the interference on 241Am is 4 × 10⁻⁴. The excess of 241Am in Fig. 6 could be due to improper normalization, since the spent fuel we used as a standard was not certified.
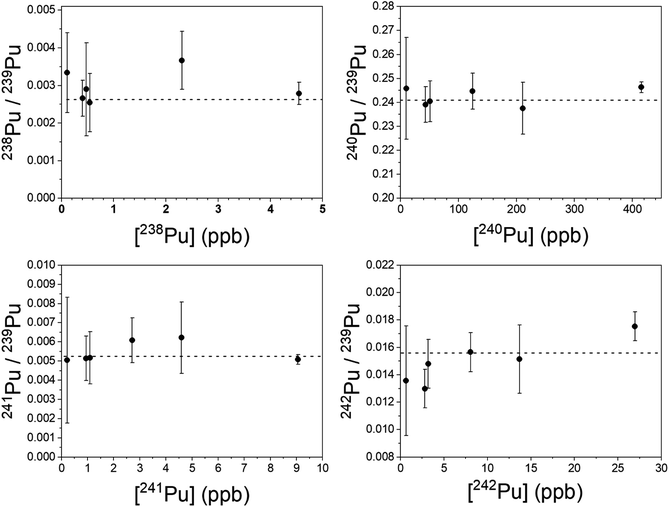
Plutonium results are shown in Fig. 7. The simultaneous method was used to measure 240–242Pu/239Pu; the blinking method was used for 238Pu/239Pu. All measured ratios are in excellent agreement with the certified values, even at sub-ppb concentrations of the individual isotopes. In particular, both 241Pu and 238Pu are free of interference. The 241Am/241Pu ratio in the samples is 10, yet the 241Pu is detected without interference using the simultaneous method. The weighted average of the measured 241Pu/239Pu ratios in Fig. 7 is 0.00515(22) vs. the certified value of 0.00525(8).
It was necessary to analyze more than one spot on each sample to obtain enough counts of 238Pu at a high enough signal-to-noise ratio to be viable. The desorbing laser power needed to be raised as material was consumed, however above a certain power the ubiquitous background noise became too high to proceed. Nonetheless, the measured 238Pu/239Pu ratio is accurate down to a 238Pu concentration of 0.11 ppb with a 238U/238Pu excess of 3.4 × 10⁴. The 238U/238Pu ratio in all samples ranged from 1.9 × 10⁴ to 3.4 × 10⁴.
Discussion
In the analyses reported here we did not attempt to increase detection efficiency by methods sometimes used in RIMS such as Ti overcoating24,25 or Ar+ pre-sputtering.20 We investigated the effect of substrate chemistry by drying samples on Al, Ta, Ti, Zr, Lu, Dy, and Er, all of which have the potential to react with oxygen and thereby promote volatilization of, for example, U atoms rather than UOx molecules. Of these, Ti and Al gave the best results in terms of background noise and signal levels per unit desorbing laser power. Solutions pipetted onto Lu, Dy and Er, which in theory should reduce actinides,26 did not dry completely even after heating to 150–200 °C for 24 hours and produced viscous, unworkable samples. Future studies will involve spiking solutions with reducing metals to see if it improves detection efficiency.The ability to measure isotope ratios accurately in samples deposited from solution also allows for the possibility of measuring elemental concentrations by spiking with known amounts of isotopic tracers. In particular, a highly enriched 244Pu spike would enable Pu elemental concentrations to be measured in samples with extremely low concentrations of total Pu.27
The material and time requirements for 238Pu/239Pu ratio analysis via blinking are considerably less than the combined radiochemical/mass spectrometric method. The least concentrated sample we analyzed (BCR-2C) contained a total of 1.4 × 10⁶ atoms of 238Pu, though we consumed only a fraction of them. From this we obtained 90 counts in 90 minutes, which was sufficient to yield a precision of 30% RSD and establish the 238Pu/239Pu ratio as non-zero at 3σ confidence. Alpha spectrometry on the same sample would require six days to accumulate 90 counts (assuming 50% counting efficiency). Obviously one could use more sample and reduce the α-spec counting time, however the very minimal sample and time requirements for RIMS could be advantageous in other analytical scenarios in addition to the rapid screening of post-detonation debris as described here. Spent nuclear fuel, in which the 238Pu/239Pu ratio may be diagnostic of irradiation conditions in the reactor,12 is generally highly radioactive, so the ability to analyze very small quantities can minimize the hazard involved in handling the material. Further, the blinking method can in principle be applied to any trace isotopic analysis in solids. RIMS is already capable of trace isotopic analysis of, e.g.41Ca;28 the addition of blinking could drive detection limits even lower.
The blinking scheme proved successful even when applied to sub-ppb levels of 238Pu and large excesses of 238U. The scheme currently requires four lasers, which incurs cost and complexity. We are currently developing “self-blinking” lasers, i.e. lasers that switch between on- and off-resonance wavelengths rapidly (i.e. ≥1 kHz). This will enable interleaving on- and off-resonance spectra with a single laser. This will simplify our analysis by requiring only three lasers, however such self-blinking lasers could be used in any RIS scheme and could be applied to any element, not just Pu. The advantage of the current three-color Pu scheme is that the power of the blue (420 nm) laser can be kept low, which helps to mitigate non-resonant background. One- and two-color schemes are simpler and cheaper but require blue lasers with much more power to achieve efficient ionization. Future work in our lab will investigate the trade-offs involved in employing such schemes.
Conclusions
We have demonstrated rapid actinide isotopic analysis on microgram quantities of solid materials derived from solutions intended to mimic post-detonation debris. The actinide concentrations ranged from ∼200 ppm total U to 20 ppb total Am in basalt matrices. Two methods were used. In the first U, Pu, and Am isotopic compositions were measured simultaneously, which succeeded in measuring all but 238Pu. A new “blinking” method was developed specifically for 238Pu analysis in which off-resonant backgrounds were measured concurrently with the resonant Pu signal to correct for interference from copious 238U and other sources. The new blinking method can in principle be applied in conjunction with simultaneous actinide analysis by employing new lasers under development in our laboratory.Conflicts of interest
There are no conflicts to declare.Acknowledgements
This work was performed under the auspices of the U.S. Department of Energy by Lawrence Livermore National Laboratory under Contract DE-AC52-07NA27344. This work was supported by the National Nuclear Security Agency Office of Defense Nuclear Nonproliferation Research and Development. LLNL-JRNL-846363.References
- F. Esaka, et al. , Talanta, 2017, 165, 122–127 CrossRef CAS PubMed.
- Z. Mácsik and T. Shinonaga, Appl. Radiat. Isot., 2010, 68(12), 2147–2152 CrossRef PubMed.
- Y. Xu, et al. , Talanta, 2014, 119, 590–595 CrossRef CAS PubMed.
- C.-G. Lee, J. Park and S. H. Lim, Nucl. Eng. Technol., 2018, 50(1), 140–144 CrossRef CAS.
- C.-G. Lee, et al. , Int. J. Mass Spectrom., 2012, 314, 57–62 CrossRef CAS.
- L. Y. D. Tiong and S. Tan, J. Radioanal. Nucl. Chem., 2019, 322(2), 399–406 CrossRef CAS.
- A. Gourgiotis, et al. , J. Anal. At. Spectrom., 2010, 25(12), 1939–1945 RSC.
- H. Bosco, et al. , Sci. Adv., 2021, 7(44), eabj1175 CrossRef CAS PubMed.
- N. Kneip, et al. , Hyperfine Interact., 2020, 241(1), 45 CrossRef.
- S. Raeder, et al. , Anal. Bioanal. Chem., 2012, 404(8), 2163–2172 CrossRef CAS PubMed.
- M. Raiwa, et al. , Spectrochim. Acta, Part B, 2022, 106377 CrossRef CAS.
- M. R. Savina, B. H. Isselhardt and R. Trappitsch, Anal. Chem., 2021, 93(27), 9505–9512 CrossRef CAS PubMed.
- K. Knight, et al., Proceedings of the 52nd Annual Meeting of the Institute for Nuclear Materials Management, 2011, pp. 1–7 Search PubMed.
- W. J. Oldham, et al. , J. Radioanal. Nucl. Chem., 2013, 296(2), 889–892 CrossRef CAS.
- S. Weyer, et al. , Geochim. Cosmochim. Acta, 2008, 72(2), 345–359 CrossRef CAS.
- R. Jakopič, et al. , J. Radioanal. Nucl. Chem., 2021, 327(1), 495–504 CrossRef.
- M. R. Savina, et al. , Anal. Chem., 2017, 89, 6224–6231 CrossRef CAS PubMed.
- T. Stephan, et al. , Int. J. Mass Spectrom., 2016, 407, 1–15 CrossRef CAS.
- R. Trappitsch, M. R. Savina and B. H. Isselhardt, J. Anal. At. Spectrom., 2018, 33, 1962–1969 RSC.
- M. R. Savina, et al. , Anal. Chem., 2018, 90(17), 10551–10558 CrossRef CAS PubMed.
- M. R. Savina, R. Trappitsch and B. H. Isselhardt, Spectrochim. Acta, Part B, 2018, 149, 214–221 CrossRef CAS.
- C. Gruning, et al. , Int. J. Mass Spectrom., 2004, 235(2), 171 CrossRef CAS.
- K. A. Matthews, et al. , Geostand. Geoanal. Res., 2011, 35(2), 227–234 CrossRef CAS.
- B. Eichler, et al. , Radiochim. Acta, 1997, 79, 221–223 CrossRef CAS.
- A. Ofan, et al. , New Astron. Rev., 2006, 50(7–8), 640–643 CrossRef CAS.
- J. H. Bartlett and A. Castro, Spectrochim. Acta, Part B, 2019, 155, 61–66 CrossRef CAS.
- R. M. Essex, et al. , J. Radioanal. Nucl. Chem., 2020, 324(1), 257–270 CrossRef CAS PubMed.
- K. Wendt, et al. , Hyperfine Interact., 2000, 127(1–4), 519–522 CrossRef CAS.
Footnote |
| † Electronic supplementary information (ESI) available. See DOI: https://doi.org/10.1039/d3ja00096f |
| This journal is © The Royal Society of Chemistry 2023 |

