 Open Access Article
Creative Commons Attribution 3.0 Unported Licence
Precise determination of 204Pb-based isotopic ratios in environmental samples by quadrupole inductively coupled plasma mass spectrometry†
Marco
Grotti
 *,
Maria Alessia
Vecchio
 ,
Dalia
Gobbato
,
Matilde
Mataloni
and
Francisco
Ardini
,
Dalia
Gobbato
,
Matilde
Mataloni
and
Francisco
Ardini
Department of Chemistry and Industrial Chemistry, University of Genoa, Via Dodecaneso 31, 16146 Genoa, Italy. E-mail: grotti@unige.it
First published on 17th March 2023
Abstract
The measurement of 204Pb-based isotopic ratios by quadrupole ICP-MS has been investigated. After multivariate optimization of the main operating conditions (sample uptake rate, spray chamber temperature, quadrupole voltages), the isotopic ratios were measured with an internal precision of ∼0.4% (% RSD, n = 12) at the Pb concentration of 1 μg L−1 and ∼0.2% at 10 μg L−1, close to the values usually reported for the measurement of major isotopes by quadrupole ICP-MS. The external precision was ∼0.3% (% RSD, n = 35) and the bias, after the correction of the isobaric overlapping of 204Hg on 204Pb, was lower than 2‰. The applicability of the developed method in the environmental field was demonstrated by the analysis of a time series of 84 atmospheric particulate samples collected from the Arctic and characterized by low Pb concentration, obtaining data in good agreement with the isotopic composition of airborne particulate deposited in central Greenland.
Introduction
In environmental science, the determination of lead isotope ratios can provide unique information on the geographical sources of both natural and anthropogenic inputs, the relative contributions of these sources over time and the corresponding transport routes.1,2 In fact, lead has four stable isotopes, 204Pb, 206Pb, 207Pb and 208Pb, and the last three are the stable end products of the decay chains of 238U, 235U and 232Th, respectively. Therefore, the relative abundance of lead isotopes in ores depends on the abundance of their parent nuclide during the ore formation, as well as on the age of the rock. Consequently, there are relatively large differences in the isotopic ratios for crustal and ore lead deriving from various locations,3 and the precise measurement of lead isotope ratios is hence an efficient way to investigate sources and processes of this pollutant in various environmental contexts.4–6Nowadays, thermal ionization mass spectrometry (TIMS) and multi-collector inductively coupled plasma mass spectrometry (MC-ICP-MS) constitute the state of art of isotopic analysis, achieving the best precision (RSD values down to 0.001%) and allowing the measurement of small isotope ratio variations for various elements.7,8 On the other hand, these techniques are expensive and labour intensive, usually requiring the analyte isolation from the matrix and the application of a suitable technique for the correction of the mass bias.8,9 Therefore, when the natural variation of the isotope ratios is relatively wide and the polyatomic interferences do not affect the measurement, such as for lead, quadrupole ICP-MS is an attractive alternative.8 In fact, the instrumentation is cheaper and easier to handle, and the sample throughput is more adequate to analyse a large set of samples, such as those derived from the field activity of environmental studies.
Due to the lower instrumental sensitivity, the quadrupole ICP-MS is typically applied to measure the more abundant isotopes (206Pb, 207Pb and 208Pb), and the data are plotted in various three-isotope plots, such as 208Pb/207Pb versus206Pb/207Pb and 208Pb/206Pb versus207Pb/206Pb. However, different lead sources could be co-linear in some of these plots (e.g.206Pb/208Pb versus206Pb/207Pb), and these diagrams could hence be unable to distinguish more than two sources, leading to questionable interpretations.10,11 A more efficient discrimination of lead isotope data for multiple source mixing could be obtained from plots involving 206Pb/204Pb, 207Pb/204Pb and 208Pb/204Pb, which require the measurement of the less abundant (1.4%), non-radiogenic 204Pb isotope.
In this work, the measurement of 204Pb-based isotopic ratios by quadrupole ICP-MS has been re-considered. In fact, last-generation instruments with enhanced interface and ion optics efficiency have significantly increased the sensitivity, making it possible to improve the precision, which is mostly limited by ion counting statistics. After a careful optimization of the operating conditions following the experimental design approach,12,13 the determination of lead isotope ratios was characterized in terms of accuracy (trueness and precision) and minimum detectable concentration. The applicability of the developed method was finally demonstrated by the analysis of 84 atmospheric particulate samples collected from the Arctic and characterized by low analytical concentration and limited amount of sample. To the best of our knowledge, these are the first 20XPb/204Pb data in the field obtained by quadrupole ICP-MS.
Experimental
Instrumentation and operating conditions
The ICP-MS system used was a PerkinElmer (Waltham, MA, USA) NexION 2000. Instrumental characteristics and operating parameters are reported in Table 1. The sample introduction system consisted of a Meinhard (Golden, CO, USA) Type CT R+ glass nebulizer jointed to a glass cyclonic spray chamber, whose temperature was controlled by the PC3× Peltier heater/cooler system. The sample uptake rate and the spray chamber temperature were concomitantly optimized by a Doehlert design14 (Table S1†), where runs 1–7 were randomly performed in duplicate and both sensitivity at m/z = 208 and oxides formation (CeO+/Ce+) were taken as the response. The nebulizer gas flow rate was about 1.10 L min−1, adjusted daily for maximum sensitivity, while keeping the oxides and double-charge (Ce2+/Ce+) formation lower than 2.5%. The quadrupole ion deflector (QID) voltage and the torch XY alignment were also optimized daily to maximize the sensitivity. The reaction/collision cell was used under standard conditions (i.e. without reaction/collision gas). The cell rod offset (CRO), the cell entrance/exit voltage (formerly cell path voltage, CPV) and the quadrupole rod offset (QRO) were optimized by a central composite design (Table S2†), taking the sensitivity at m/z = 208 as the response. Finally, the acquisition parameters (dwell time and number of sweeps) were optimized to achieve the best precision in the measurement of the lead isotope ratios, within a suitable analysis time. The detector dead time was measured according to the method by Nelms et al.,15 finding a value of 47 ns.| a RPq = q/0.95; RPa = a/1.9, where a and q are Matheiu stability diagram parameters. | |
|---|---|
| Instrument | PerkinElmer NexION 2000 |
| Sample introduction system | |
| Nebulizer | Meinhard type CT R+ |
| Spray chamber | Glass cyclonic with PC3× Peltier heater/cooler |
| Spray chamber temperature | Studied: from 4 to 80 °C; optimal: 25 °C |
| Nebulizer gas flow rate | 1.10 L min−1 (adjusted daily) |
| Sample uptake rate | Studied: 100–300 μL min−1; optimal: 300 μL min−1 |
| Plasma source | Free-running ICP (nominal 34 MHz) with Lumicoil® |
| RF Power | 1600 W |
| Plasma gas flow rate | 15.0 L min−1 |
| Auxiliary gas flow rate | 1.20 L min−1 |
| Interface | Triple-cone interface |
| Sampler | 1.1 mm diameter Ni |
| Skimmer | 0.9 mm diameter Ni |
| Hyper skimmer | 1.0 mm diameter Al |
| Ion optics | Quadrupole ion deflector (QID) |
| QID voltage | −9.5 V (adjusted daily) |
| Reaction cell | Universal cell technology |
| Cell condition | Vented (no gas) |
| Cell rod offset (CRO) | Studied: from −20 to +4 V; optimal: −15 V |
| Cell entrance/exit voltage | Studied: from −30 to +2 V; optimal: −5 V |
| Quadrupole rod offset (QRO) | Studied: from −10 to +4 V; optimal: −3 V |
| RPaa | 0 |
| RPqa | 0.25 |
| Detector | Dual analog/digital discrete dynode |
| Analog stage voltage | −1637 V |
| Pulse stage voltage | 900 V |
| Signal measurement | |
| Acquisition mode | Peak-hopping |
| Sweeps | Studied: 20–1000; optimal: 500 |
| Dwell time | Studied: 1–50 ms; optimal: 2 ms |
| Readings/replicate | 10 |
| Replicates | 12 |
| Isotopes | 202Hg, 204Pb, 206Pb, 207Pb, 208Pb |
Reagents and standards
Ultrapure water was supplied by the four-column ion-exchange system Milli-Q, fed by the reverse osmosis system Elix 3, both from Millipore (Burlington, MA, USA). Ultrapure-grade Normatom® 67% nitric acid from VWR International (Radnor, PA, USA) and suprapure-grade 30% hydrogen peroxide from Merck (Darmstadt, Germany) were used for sample preparation. Standard solutions for daily-performance check and tuning were supplied by PerkinElmer.Standard reference materials
The lead isotopic standard SRM 981 from NIST (Gaithersburg, MD, USA) was used to optimize the instrumental parameters, to correct for the instrumental mass bias and to determine the detector dead time. The stock solution was prepared by dissolving 0.6 g (±0.1 mg) of the lead wire with 10 mL of HNO3 in an acid-cleaned 50 mL volumetric flask and filling to the mark with ultrapure water. Finally, the stock solution was transferred into an acid-cleaned 50 mL PP graduated conical test tube and stored at 4 °C. Daily standards (0.1–15 μg L−1) were prepared by serial dilution of the stock solution with 1% HNO3. The certified values for 204Pb/206Pb, 207Pb/206Pb, 208Pb/206Pb are 0.059042 ± 0.000037, 0.91464 ± 0.00033, 2.1681 ± 0.0008, respectively.The lichen reference material CRM 482 from IRMM (Geel, Belgium) with reference values for lead isotopes ratios by MC-ICP-MS16 was used for the method validation. The sample was digested as described in the paper cited above and diluted to a final lead concentration of 1 or 10 μg L−1.
Sample collection and analysis
Details about the sample collection and analysis are reported elsewhere.17,18 Briefly, the sampling of PM10 (particles with aerodynamic equivalent diameter lower than 10 μm) was carried from October 2018 to November 2020 at Ny-Ålesund (Svalbard Islands, Norwegian Arctic), with a 7 day resolution. The sampling device was a TCR Tecora (Monza, Italy) ECHO PM sampler, employed 90 mm hydrophilic PTFE membrane filters by Advantec MFS (Dublin, CA, USA) and operated at the constant flow rate of 200 L min−1.A quarter of each filter was solubilized with 2 mL of HNO3 and 0.5 mL of H2O2, using the microwave digestion system MARS-5 (CEM, Matthews, NC, USA). After the digestion, the samples were diluted to 10 mL with ultrapure water and analyzed by ICP-MS.
Data processing
Data from the optimization study were processed using the open-source software R,19 with the additional package CAT.20Results and discussion
Multivariate optimization of the operating conditions
Several instrumental parameters may affect the sample introduction efficiency and the ion transmission, likely in an inter-related way, ultimately determining the signal intensity and, according to Poisson statistics, the precision of the isotopic ratio determination.8 In order to achieve the sensitivity required for the precise measurement of the 204Pb-based isotopic ratios, the multivariate effect of the operating conditions on the analytical signal was investigated using the empirical modelling and experimental design approach.12,13The quadrupoles' parameters CRO, QRO and CPV were optimized by a central composite design and the obtained response surfaces are shown in Fig. 1 (the model coefficients and their significance are reported in Table S3†). From their study, the optimal conditions to maximize the ion transmission were deduced: CRO = −15 V, QRO = −3 V and CPV = −5 V. Under these conditions, the sensitivity at m/z = 208 was >80 Mcps ppm−1 and the precision for the measurement of 204Pb-based isotopic ratios was 0.2–0.3% at the Pb concentration of 10 μg L−1.
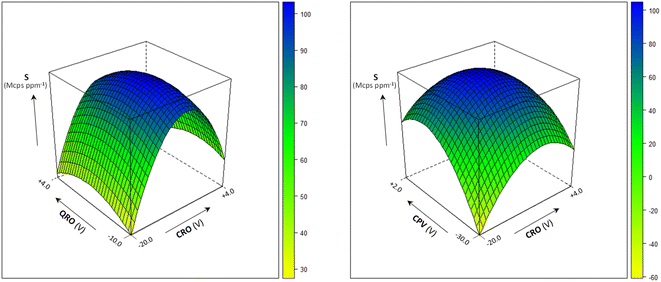 | ||
| Fig. 1 Multivariate effect of the quadrupoles' parameters CRO, QRO and CPV on sensitivity (S) at m/z = 208. Sample uptake rate: 300 μL min−1; spray chamber temperature: 25 °C. | ||
The combined effect of the sample uptake rate (UR) and the spray chamber temperature (T) on sensitivity at m/z = 208 and the oxides formation is shown in Fig. 2 (the model coefficients and their significance are reported in Table S4†). Sensitivity improved by increasing both UR and T, likely due to the increase in the amount of sample delivered to the ICP source. On the other hand, extreme values of these variables also lead to an excessive oxide formation (9%), which indicates a degradation in the atomization efficiency of ICP. In addition, polyatomic interferences by OsO+ on Pb isotopes would be emphasized. Therefore, UR = 300 μL min−1 and T = 25 °C were selected as the optimal values. The precision obtained under these conditions for the measurement of the 204Pb-based isotopic ratios is shown in Fig. 3, and compared to other UR/T combinations, at two concentration levels. It was confirmed that the optimized conditions compete favourably with the other settings, allowing the achievement of RSD values < 0.5% at 1 μg L−1 and < 0.2% at 10 μg L−1.
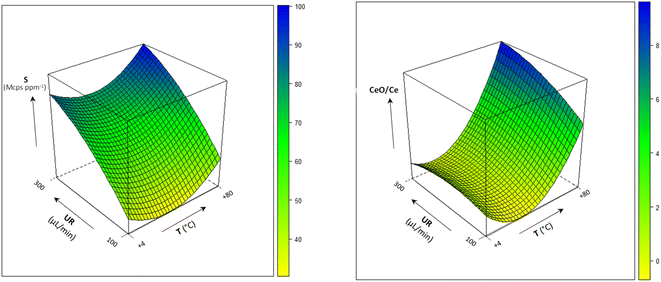 | ||
| Fig. 2 Multivariate effect of the sample uptake rate (UR) and spray chamber temperature (T) on sensitivity (S) at m/z = 208 and oxides formation (CRO: −15 V; QRO: −3 V; CPV: −5 V). | ||
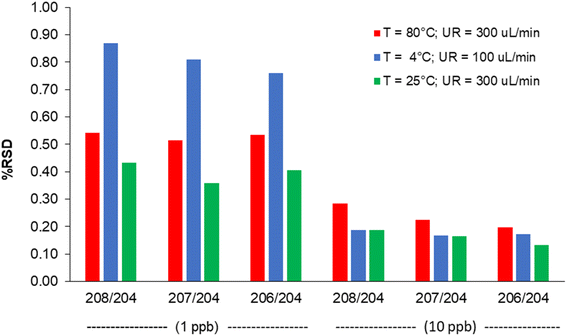 | ||
| Fig. 3 Internal precision (% RSD, n = 12) obtained at different sample uptake rate (UR) and spray chamber temperature (T) values, at two concentration levels. | ||
Selection of the acquisition parameters
Since the isotope ratio precision depends on the total number of counts collected during each replicate measurement, another way to improve this figure is the increase of the acquisition time for replicate.8 However, the use of prolonged measurements also decreases the sample throughput and increases the sample consumption, which can be limiting factors in the analysis of environmental samples. In order to choose the appropriate compromise, the precision of the 204Pb-based isotopic ratios as a function of the integration time was evaluated, along with the corresponding analysis time. The results for 208Pb/204Pb are displayed in Fig. 4 (similar results were obtained for 207Pb/204Pb and 206Pb/204Pb). It can be seen that a sharp decrease of RSD-values can be obtained by increasing the integration time up to 10 s, whereas marginal improvement in precision is observed hereafter. Therefore, an integration time of 10 s was selected to achieve a good precision in a suitable analysis time (∼10 minutes). This integration time can be obtained as a product of the dwell time by the number of sweeps. In order to maximize the peak hopping rate, a large number of sweeps was selected (500), along with a dwell time of 2 ms and 10 readings/replicate. In this way, instrumental drift and ICP noise are compensated for to the largest possible extent.8 For the same reason, the settling time was set at its minimum value (200 μs).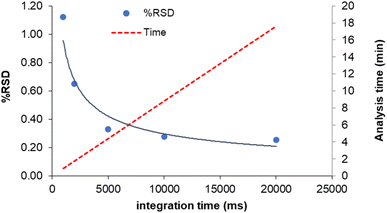 | ||
| Fig. 4 Effect of the integration time on internal precision (% RSD, n = 12) and analysis time (c = 5 μg L−1). | ||
Correction of the isobaric interference of 204Hg
A major problem for the accurate measurement of the 204Pb-based isotopic ratios is due to the isobaric interference of 204Hg on 204Pb. In order to correct for this spectral overlapping, the following equation was applied:| I(204Pb) = I(204) − 0.230074 × I(202Hg) | (1) |
The efficiency of this correction was tested by the analysis of the lichen reference material CRM 482. This sample is characterized by a Hg![[thin space (1/6-em)]](https://www.rsc.org/images/entities/char_2009.gif) :
:![[thin space (1/6-em)]](https://www.rsc.org/images/entities/char_2009.gif) Pb ratio of 1
Pb ratio of 1![[thin space (1/6-em)]](https://www.rsc.org/images/entities/char_2009.gif) :
:![[thin space (1/6-em)]](https://www.rsc.org/images/entities/char_2009.gif) 85, which is significantly higher than the natural Hg
85, which is significantly higher than the natural Hg![[thin space (1/6-em)]](https://www.rsc.org/images/entities/char_2009.gif) :
:![[thin space (1/6-em)]](https://www.rsc.org/images/entities/char_2009.gif) Pb ratio (1
Pb ratio (1![[thin space (1/6-em)]](https://www.rsc.org/images/entities/char_2009.gif) :
:![[thin space (1/6-em)]](https://www.rsc.org/images/entities/char_2009.gif) 304 in the upper continental crust according to Wedepohl21). The bias in the measurement of 208Pb/204Pb, 207Pb/204Pb and 206Pb/204Pb decreased from −12.3, −13.6 and −12.7‰ to 1.5, 0.6 and 1.5‰, respectively. To further investigate the correction at different Hg
304 in the upper continental crust according to Wedepohl21). The bias in the measurement of 208Pb/204Pb, 207Pb/204Pb and 206Pb/204Pb decreased from −12.3, −13.6 and −12.7‰ to 1.5, 0.6 and 1.5‰, respectively. To further investigate the correction at different Hg![[thin space (1/6-em)]](https://www.rsc.org/images/entities/char_2009.gif) :
:![[thin space (1/6-em)]](https://www.rsc.org/images/entities/char_2009.gif) Pb ratios, a SRM 981 solution (C = 10 μg L−1) was analysed before and after the addition of increasing concentrations of Hg. The results showed that no relevant bias (<2‰) in the values occurs with Hg
Pb ratios, a SRM 981 solution (C = 10 μg L−1) was analysed before and after the addition of increasing concentrations of Hg. The results showed that no relevant bias (<2‰) in the values occurs with Hg![[thin space (1/6-em)]](https://www.rsc.org/images/entities/char_2009.gif) :
:![[thin space (1/6-em)]](https://www.rsc.org/images/entities/char_2009.gif) Pb ranging from 1
Pb ranging from 1![[thin space (1/6-em)]](https://www.rsc.org/images/entities/char_2009.gif) :
:![[thin space (1/6-em)]](https://www.rsc.org/images/entities/char_2009.gif) 100 to 1
100 to 1![[thin space (1/6-em)]](https://www.rsc.org/images/entities/char_2009.gif) :
:![[thin space (1/6-em)]](https://www.rsc.org/images/entities/char_2009.gif) 1.
1.
Analytical figures of merit
The internal precision values of the 204Pb-based isotopic ratios at increasing lead concentration are reported in Table 2 and compared to those obtained for 208Pb/206Pb and 207Pb/206Pb. Choosing a threshold of 0.5% as lowest useful precision, a concentration limit of 1.0 μg L−1 of lead was fixed for the measurement of the 204Pb-based isotopic ratios, whereas the ratios involving the major isotopes can be measured down to 0.5 μg L−1. At these concentrations, the impact of the blank (C = 0.014 μg L−1; 208Pb/206Pb = 2.1052 ± 0.007; 207Pb/206Pb = 0.8674 ± 0.005; 208Pb/204Pb = 31.88 ± 0.69; 207Pb/204Pb = 13.26 ± 0.22; 206Pb/204Pb = 15.18 ± 0.27) on the isotopic values of SRM 981, computed by a simple linear mixing model, was found to be negligible (<2‰). The accuracy (trueness and precision) of the method was assessed by 35 analyses of the certified reference material CRM 482 (final Pb concentration = 1 μg L−1), performed during 11 analytical sessions. The mean values were in good agreement with the reference data, with a bias lower than 2‰ and an (external) precision better than 0.34% for 20XPb/204Pb and 0.15% for 20XPb/206Pb (Table 3).| C (μg L−1) | 208Pb/206Pb | 207Pb/206Pb | 208Pb/204Pb | 207Pb/204Pb | 206Pb/204Pb |
|---|---|---|---|---|---|
| 0.1 | 0.42 | 0.32 | 1.07 | 1.38 | 1.18 |
| 0.5 | 0.27 | 0.13 | 0.84 | 0.80 | 0.90 |
| 1 | 0.14 | 0.18 | 0.37 | 0.41 | 0.42 |
| 2 | 0.14 | 0.18 | 0.37 | 0.29 | 0.26 |
| 5 | 0.14 | 0.09 | 0.24 | 0.36 | 0.25 |
| 10 | 0.08 | 0.10 | 0.21 | 0.15 | 0.24 |
| 15 | 0.11 | 0.09 | 0.16 | 0.13 | 0.13 |
| 208Pb/206Pb | 207Pb/206Pb | 208Pb/204Pb | 207Pb/204Pb | 206Pb/204Pb | |
|---|---|---|---|---|---|
| Found | 2.1295 | 0.8845 | 37.47 | 15.553 | 17.580 |
| SD | 0.0032 | 0.0010 | 0.11 | 0.053 | 0.059 |
| RSD (%) | 0.15 | 0.12 | 0.30 | 0.34 | 0.34 |
| Reference | 2.12879 | 0.88411 | 37.490 | 15.5701 | 17.6111 |
| Bias (‰) | 0.32 | 0.45 | −0.46 | −1.11 | −1.77 |
Uncertainty estimation
The uncertainty sources and their contribution to the total uncertainty were assessed according to the GUM guideline,22 as previously described.23 In the measurement of the 204Pb-based isotopic ratios, the uncertainty sources are related to the dead time measurement, mass bias correction by the bracketing standard method and the correction of the isobaric interference of 204Hg on 204Pb. Particularly, the dead time-dependent uncertainty is a function of the internal precision, the standard deviation of the dead time and the standard deviation of the 204Pb signal intensity, which is in turn affected by the standard deviation of the 202Hg signal intensity used for the correction (eqn (1)).The uncertainty associated with the mass bias correction is related to the internal precision of the isotope ratio measurements of the bracketing standards and the sample, and to the uncertainty in the certified ratios. The total extended uncertainty is finally obtained by computing the square root sum of squares of every single contribution and multiplying by the coverage factor k = 2. The uncertainty was calculated by 12 isotope ratio measurements of CRM 482 at the concentration of 10 μg L−1, obtaining 0.095, 0.037 and 0.042 for 208Pb/204Pb, 207Pb/204Pb and 206Pb/204Pb, respectively, in good agreement with both the dispersion of the measured ratios (0.101, 0.041 and 0.046) and the mean uncertainties obtained for the analysis of 84 atmospheric particulate samples (0.101, 0.040 and 0.048).
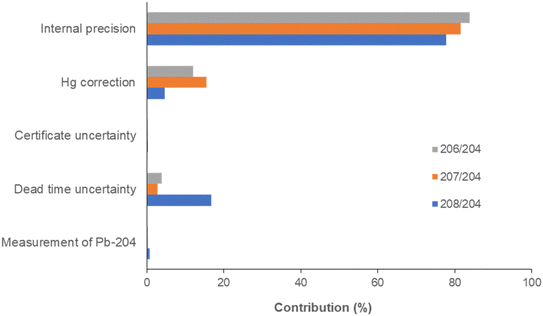
Percentage contributions of each term to the total uncertainty are shown in Fig. 5. The internal precision was by far the most important contribution, accounting for 78–84% of the total uncertainty. The uncertainty due to the correction of the isobaric interference of 204Hg on 204Pb contributed 5–15%, whereas dead time uncertainty showed an effect only for the measurement of 208Pb/204Pb (17%). The remaining contributions were negligible.
Application to airborne particulate samples from the Arctic
The developed method was finally applied to the isotopic analysis of a time series of PM10 samples collected in the context of the Italian Arctic Research Programme. After acid dissolution, the lead concentration was 5.0 ± 1.5 μg L−1 (mean ± 95% confidence interval, n = 84), corresponding to a concentration in the atmosphere of 0.143 ± 0.041 ng m−3. The 208Pb/204Pb, 207Pb/204Pb and 207Pb/204Pb ratios were 38.31 ± 0.06, 15.69 ± 0.02 and 18.24 ± 0.04 (mean ± 95% confidence interval, n = 84), in good agreement with the lead isotopic composition of airborne particulate deposited in central Greenland obtained by Bory and co-workers using TIMS (38.14 ± 0.06, 15.66 ± 0.06 and 18.29 ± 0.08, respectively, as mean ± 95% confidence interval, n = 34).24 The isotopic data are displayed in Fig. 6 and compared with the isotopic signatures of both natural (Pb isotopic composition of the upper continental crust)25 and anthropogenic potential source areas in the northern hemisphere.26–28 It can be seen that the Arctic PM10 samples are much less radiogenic than the isotopic composition of the natural end-member, confirming the significant contribution of anthropogenic sources, as previously reported.17,18,29 Although a thorough discussion of these sources is out of the scope of this paper, it is worth noting that, in the 208Pb/204Pb versus206Pb/204Pb plot, the samples are spread following two distinct directions, thus suggesting a provenience from Asia/Russia for the most of samples and a contribution from USA/Canada for the remaining ones. As emphasised in the introduction, this discrimination of multiple sources was possible thanks to the use of 204Pb-based isotopic values, since the isotopic signature of these sources in the 208Pb/206Pb versus207Pb/206Pb plot lay on a straight line (r2 = 0.96).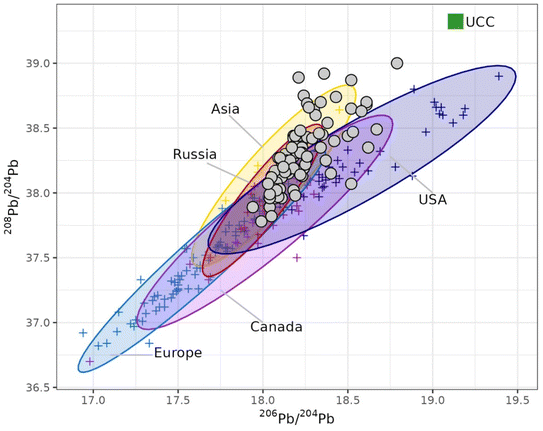 | ||
| Fig. 6 Lead isotopic composition of PM10 samples collected at Ny-Ålesund (Svalbard Islands, Norwegian Arctic) in 2018–2020 and potential source areas (PSA).23–26 UCC = upper continental crust; filled circles = Arctic samples; crosses = PSA data. | ||
Conclusion
After multivariate optimization of the main operating conditions to maximize the sensitivity, the determination of 204Pb-based isotopic ratios by quadrupole ICP-MS at the part-per-billion concentration level has been achieved. The internal precision was ∼0.4% at 1 μg L−1 and ∼0.2% at 10 μg L−1, close to the values usually reported for the measurement of major isotopes by quadrupole ICP-MS. Repeated analyses of digests from the lichen reference material CRM 482 with Pb concentration of 1 μg L−1 showed an external precision better than 0.34% (% RSD, n = 35) and differences from the reference values lower than 2‰, provided that the isobaric interference due to 204Hg on 204Pb is corrected for. Finally, the application of the developed method to a time series of PM10 samples provided self-consisting results in good agreement with literature data. Moreover, the isotopic signature was able to discriminate among the potential sources of atmospheric particulate reaching the Arctic. Therefore, the method is proposed as an alternative to high-priced analytical techniques for the analysis of large numbers of environmental samples.Author contributions
Conceptualization: Marco Grotti, Maria Alessia Vecchio, Francisco Ardini. Methodology: Marco Grotti, Maria Alessia Vecchio, Francisco Ardini. Investigation: Maria Alessia Vecchio, Dalia Gobbato, Matilde Mataloni. Validation: Marco Grotti, Maria Alessia Vecchio, Francisco Ardini. Resources: Marco Grotti, Francisco Ardini. Visualization: Marco Grotti, Dalia Gobbato, Matilde Mataloni. Writing – original draft: Marco Grotti. Writing – review and editing: Marco Grotti, Maria Alessia Vecchio, Dalia Gobbato, Matilde Mataloni, Francisco Ardini. Supervision: Marco Grotti, Maria Alessia Vecchio, Francisco Ardini. Funding acquisition: Marco Grotti, Francisco Ardini. All authors have read and agreed to the published version of the manuscript.Conflicts of interest
There are no conflicts to declare.Acknowledgements
This study was financially supported by the Italian National Program for Research in Antarctica (projects PNRA14_00091 and PNRA16_00252) and the Italian Arctic Research Program (project PRA2021-0020 BETHA-NyÅ). The purchase of NexION 2000 was supported by P.O.R. FESR Liguria 2014–2020 (project Blue-Lab Net).References
- F. E. Grousset and P. E. Biscaye, Chem. Geol., 2005, 222, 149–167 CrossRef CAS.
- M. Komárek, V. Ettler, V. Chrastný and M. Mihaljevič, Environ. Int., 2008, 34, 562–577 CrossRef PubMed.
- D. F. Sangster, P. M. Outridge and W. J. Davis, Environ. Rev., 2000, 8, 115–147 CrossRef CAS.
- D. Weiss, W. Shotyk and O. Kempf, Sci. Nat., 1999, 86, 262–275 CrossRef CAS.
- A. H. Cheng and Y. Hu, Environ. Pollut., 2010, 158, 1134–1146 CrossRef PubMed.
- F. Ardini, A. Bazzano and M. Grotti, Environ. Chem., 2020, 17, 213–239 CrossRef CAS.
- D. H. Smith, Inorganic Mass Spectrometry – Fundamentals and Applications, ed. C. M. Barshick, D. Duckworth and D. H. Smith, Marcel Dekker, New York, 2000, ch. 1, pp. 1–30 Search PubMed.
- F. Vanhaecke, L. Balcaen and D. Malinovsky, J. Anal. At. Spectrom., 2009, 24, 863–886 RSC.
- V. Balaram, W. Rahaman and P. Roy, Geo Geo, 2022, 1, 100019 Search PubMed.
- R. M. Ellam, Sci. Total Environ., 2010, 408, 3490–3492 CrossRef CAS PubMed.
- B. Gulson, G. D. Kamenov, W. Manton and M. Rabinowitz, Int. J. Environ. Res. Public Health, 2018, 15, 723 CrossRef PubMed.
- G. E. P. Box, W. G. Hunter and J. S. Hunter, Statistics for Experimenters, Wiley, New York, 1978 Search PubMed.
- B. Benedetti, V. Caponigro and F. Ardini, Crit. Rev. Anal. Chem., 2022, 52, 1015–1028 CrossRef CAS PubMed.
- D. H. Doehlert, J. Appl. Stat., 1970, 19, 231–239 CrossRef.
- S. M. Nelms, C. R. Quétel, T. Prohaska, J. Vogl and P. D. P. Taylor, J. Anal. At. Spectrom., 2001, 16, 333–338 RSC.
- C. Cloquet, J. Carignan and G. Libourel, Atmos. Environ., 2006, 40, 574–587 CrossRef CAS.
- A. Bazzano, D. Cappelletti, R. Udisti and M. Grotti, Atmos. Environ., 2016, 139, 11–19 CrossRef CAS.
- A. Bazzano, S. Bertinetti, F. Ardini, D. Cappelletti and M. Grotti, Atmosphere, 2021, 12, 388 CrossRef CAS.
- R. R Core Team, A language and environment for statistical computing, R Foundation for Statistical Computing, Wien, Austria, 2014. https://www.R-project.org, (last access 19th December 2022) Search PubMed.
- R. Leardi, C. Melzi and G. Polotti, CAT (Chemometric Agile Tool), freely downloadable from http://gruppochemiometria.it/index.php/software, (last access 19th December 2022).
- K. H. Wedepohl, Geochim. Cosmochim. Acta, 1995, 59, 1217–1232 CrossRef CAS.
- BIPM, IEC, IFCC, ISO, IUPAC, IUPAP and OIML, Guide to expression of uncertainty in measurement, 2nd edn, 1995, ISBN 92-67-10188-9.
- A. Bazzano and M. Grotti, J. Anal. At. Spectrom., 2014, 29, 926–933 RSC.
- A. J. M. Bory, W. Abouchami, S. J. G. Galer, A. Svensson, J. N. Christensen and P. E. Biscaye, Environ. Sci. Technol., 2014, 48, 1451–1457 CrossRef CAS PubMed.
- R. Millot R, C. J. Allègre, J. Gaillardet and S. Roy, Chem. Geol., 2004, 203, 75–90 CrossRef.
- A. Bollhöfer and K. J. R. Rosman, Geochim. Cosmochim. Acta, 2001, 65, 1727–1740 CrossRef.
- A. Bollhöfer and K. J. R. Rosman, Geochim. Cosmochim. Acta, 2002, 66, 1375–1386 CrossRef.
- H. Mukai, T. Machida, A. Tanaka, Y. P. Vera and M. Uematsu, Atmos. Environ., 2001, 35, 2783–2793 CrossRef CAS.
- A. Bazzano, F. Ardini, S. Becagli, R. Traversi, R. Udisti, D. Cappelletti and M. Grotti, Atmos. Environ., 2015, 113, 20–26 CrossRef CAS.
Footnote |
| † Electronic supplementary information (ESI) available. See DOI: https://doi.org/10.1039/d2ja00424k |
| This journal is © The Royal Society of Chemistry 2023 |

