 Open Access Article
Dos and don’ts in screening water splitting electrocatalysts
Sengeni
Anantharaj
 *ab and
Suguru
Noda
 ab
ab
aDepartment of Applied Chemistry, School of Advanced Science and Engineering, Waseda University, 3-4-1 Okubo, Shinjuku-ku, Tokyo 169-8555, Japan. E-mail: ananth@aoni.waseda.jp; anantharaj1402@gmail.com
bWaseda Research Institute for Science and Engineering, Waseda University, 3-4-1 Okubo, Shinjuku-ku, Tokyo 169-8555, Japan
First published on 22nd June 2022
Abstract
Examining water splitting electrocatalysts accurately is just as important as developing new and high-performance materials. The recent evolution of materials science and the ability that mankind achieved in controlling and directing the growth of materials at the nanoscale have led to an exponential burst in the number of catalysts being reported every day for all energy conversion reactions including water electrolysis. Unfortunately, as with every evolution, the recent boom in materials science and the recently increased widespread interest in applied electrochemistry among researchers of all scientific backgrounds have led to the accumulation of misinterpreted data in the literature and misguiding beginners. In this perspective, a clear-cut guideline is provided on what and what not to do while characterizing various types of electrocatalysts used in water electrosplitting.
Introduction
Water electrosplitting is one of the most promising ways of producing green hydrogen in large quantities when powered by renewables.1–4 The efficiency of hydrogen production via water electrosplitting depends on various factors including catalysts, pH, and cell design.5–9 The poor conductivity of pure water is addressed by acidifying or alkalizing the same to have an extremely low or high pH (e.g. 0.5 M H2SO4 and 1.0 M KOH).10–12 As a result, it has become inevitable to use materials that are stable under such harsh pH conditions.13–18 However, in other options where salt water, seawater, and buffered near-neutral waters are used, this issue can be avoided at the expense of bringing other kinetic complexities such as reactant switching and mass-transfer limitation into the picture which further call for modification and improvement of evaluation perspectives and tools.19–21 In water electrosplitting, the cathodic half-cell reaction is what produces hydrogen and is known familiarly as hydrogen evolution reaction (HER).22–26 On the other hand, the anodic reaction responsible for completing the whole redox process of water splitting and maintaining charge neutrality is the oxygen evolution reaction (OER) which is, according to the principle of commercialization, not as important as HER.2,27–31 However, the efficiency of OER is what determines the overall efficiency of a water electrolyzer.32–36 The HER is a simpler adsorption–discharge–desorption reaction involving protons/water and a H2 molecule.1,37–39 The OER on the other hand is a complex multi-step reaction with a range of intermediates involving the self-oxidation and reduction of electrocatalysts.2,40–44 Typically, for a molecule of O2 to be evolved, four protons and four electrons are to be transferred while also forming an O–O bond.4,31 As a result of this kinetic complexity, OER catalyzing materials require a lot more energy in terms of overpotential than the ones catalyzing HER.45 Even though HER is a simpler discharge reaction of protons in acid, it becomes a difficult one to catalyze in alkali. It is mainly because of the unavailability of free protons in highly alkaline solutions. As a result, the catalyst which catalyzes HER in alkali has to couple concurrent water dissociation with the conventional Volmer step.1,7 As a result, the kinetic complexity of HER is much higher in alkaline solution when compared to the one occurring in acidic solution.46 In earlier days, a greater portion of attention was on water electrosplitting under acidic conditions as Pt could catalyze HER efficiently in such an environment.47 Unfortunately, for OER under acidic conditions, the number of known stable catalysts is very limited and often it requires the presence of Ru and Ir which are two of the rarest elements.48,49 This is what made the developments achieved later in the field of alkaline water electrolysis with abundant materials as OER catalysts.7,34,50 As of today, NiFeOOH and its variations are the state-of-the-art for OER in alkaline solutions.34,51–53 Similarly, to counter the poor HER kinetics on Pt, Ru, Ir, and Rh, several strategies have been employed. Among them, engineering electrolytes with Lewis acid cations and heterostructuring Pt, Ru, etc.,1,54,55 with metal hydroxides, chalcogenides, and pnictides were shown to facilitate the concurrent water dissociation step coupled with the adsorption and discharge step of HER in alkali. All these achievements were possible undoubtedly because of the recent developments in the area of materials science with which we are now able to tailor, control, and design a variety of catalysts at the nanoscale to have a very high specific surface area, and optimal electronic characteristics, and pack huge loadings of catalysts in a confined space with no issues of masking and increasing dead mass.16,44,56–58However, insufficient experience in proper electrochemical screening methods and the subsequent analysis and interpretation of electrochemical characterization data has led to the accumulation of misevaluated, misinterpreted, and misanalyzed results in the literature recently.59–63 In the screening stage, an electrocatalyst is to be tested for its activity, stability, and selectivity to find its appropriateness for any given energy conversion reaction.23 For doing so, most exclusively electroanalytical tools of voltammetry origin are used. In addition to that, electrochemical impedance spectroscopy (EIS) and its variations are also used for addressing advanced issues or to bring out key information required to justify an activity trend for a given set of electrocatalysts.64–67 This requires an explicit knowledge of the fundamentals of electrochemistry and of the best practices of employing these electroanalytical tools followed by proper analysis of the results obtained. As a result of continuously witnessing unknowingly done misevaluation, misanalysis, and misinterpretation, we have been advising the research community of the issues and remedies in various aspects of screening of electrocatalysts used in water electrolysis.61,64–69 In that series, we dedicated this perspective to give an explicit account of the dos and don’ts in the screening of various types of catalysts for water splitting electrocatalysis. The information provided in this perspective is the opinions and the views of the authors, and the readers are solicited to act at their own discretion after being educated with the same.
Methods and parameters of evaluation: an overview
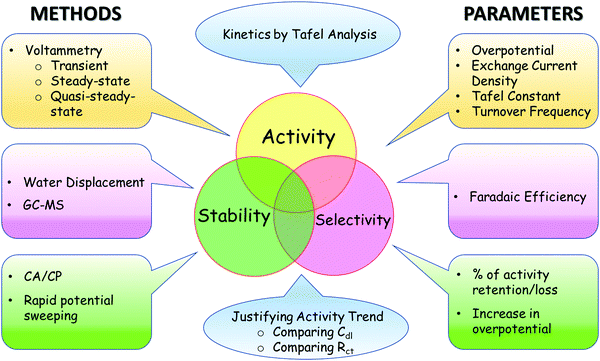
In order to certify an electrocatalyst as suitable for a particular reaction of interest, it is essential to ensure that its activity, selectivity, and stability are assessed as accurately as possible. An ideal water splitting electrocatalyst is said to have high activity, high stability, and high selectivity.23,59Scheme 1 depicts a range of evaluation parameters along with respective electroanalytical methods by which they are acquired. In brief, the activity of an electrocatalyst can be expressed in terms of overpotentials (at a fixed current density normalized using different conventions), exchange current density, Tafel constant, and turnover frequency (TOF) using a range of transient, steady-state, and quasi-steady-state voltammetric techniques. Stability on the other hand is mainly tested by subjecting the catalyst under study to perform the desired reaction at a constant applied potential or current density and the change in current or overpotential is monitored with respect to time. After several hours to a few days, the percentage loss or retention of activity (calculated from the decrease in current density or increase in overpotential) is used to denote its stability. The lower the loss or the higher the retention the better the stability. Chronoamperometry or chronopotentiometry is the most commonly used technique. Besides, potential sweeping at a rapid rate is also used to test the electrochemical stability of the catalyst over a range of potential within which the catalyst is subjected to experience several redox cycles. After thousands of cycles of such potential sweeping, the increase in onset potential and overpotential at a fixed current density is used as the marker of stability.In principle, a smaller increase in the overpotential implies better stability. Unlike the activity and stability, selectivity cannot be assessed solely with electroanalytical methods all the time as quantification of H2 or O2 formed is essential to compare the experimental yield and theoretical yield. Such quantification can be precisely made using gas chromatography-mass spectrometry (GC-MS) by sampling the electrolyte solution at regular intervals. However, when the catalysts operate at high current densities, most of the gaseous products formed escape from the solution and may not be detected from the sampled electrolyte. To avoid this, gas outlets are directly channeled to the sampling duct of GC-MS. Besides GC-MS, differential electrochemical mass spectrometry (DEMS) can also be used for precise quantification of products in real-time, and in turn, can be used to calculate the selectivity almost instantaneously. When no such sophisticated analytical tools are available, the conventional water displacement method can always serve the purpose. However, to ensure precise naked eye reading of volumes of gases that are displaced water from the inverted graded cylinder, longer operations at a given potential are necessary. Apart from all these techniques, a rotating ring-disk electrode (RRDE) set-up can also be used to determine the faradaic efficiency of OER instantaneously. However, changing collection efficiency and surface poisoning of the ring electrode can significantly affect the reproducibility of the measured faradaic efficiency. Besides the parameters of activity, stability, and selectivity, it is also important to analyze the kinetics, interrogate the mechanism, and justify the observed activity trend. To do this, performing Tafel analysis and comparing double-layer capacitance (Cdl) and charge transfer resistance (Rct) are the commonly followed practices. All these parameters used in the screening of water splitting electrocatalysts and the practices followed in employing the respective techniques are elaborated while also detailing the guidelines on the dos and don’ts in the forthcoming sections.
Systematic use of electroanalytical techniques in screening water splitting electrocatalysts
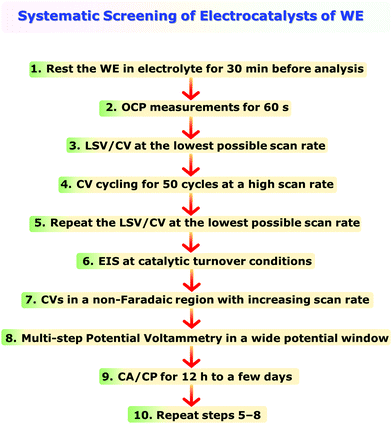
One of the main issues that beginners face in assessing an electrocatalyst for water electrolysis or any other energy conversion reaction is being unaware of the systematic use of the electroanalytical tools. It is also quite common to witness reports where more than one modified electrode is used for different types of electroanalytical techniques used for the same catalyst in order to obtain the activity, selectivity, and stability markers introduced above.However, in electrochemistry, it is almost impossible to reproduce exactly the same surface area, wettability, active sites, and electrochemical accessibility with each modified electrode even though the catalyst used is the same. This is not only a problem of modified electrodes, but self-supported electrodes prepared following various methods also cannot have such high reproducibility in surface area, wettability, active sites, and electrochemical accessibility. Hence, it is essential to perform all the essential experiments with the same electrode. However, because of the non-systematic practices followed in employing the electroanalytical techniques, completing all the essential electrochemical experiments with a single working electrode is almost impossible. To avoid this issue, a systematic approach of employing electroanalytical techniques is recommended here in Scheme 2. Step 1 in Scheme 2 is something not everyone does. Keeping the working electrode submerged in the electrolyte is inevitable to ensure complete wetting and avoid the issues that may arise due to incomplete wetting. When wetting is incomplete, the ongoing wetting gradually increases the electrochemical accessibility and improves the activity over a period of time until the wetting is complete. This will severely influence the results and interpretations to be made from them. Hence, ensuring complete wetting prior to the analysis is essential and should not be unheeded. Performing OCP measurements for 60 s will help us to ensure that the connections in the circuit are valid and the fluctuation in OCP (should be in the range of a few millivolts) is not too high indicating complete wetting. Step 3, LSV/CV at the lowest possible scan rate, is to determine activity and harvest other relevant information. To ensure that the activity and other information obtained in step 3 are reliable and stable, it is essential to look for the electrochemical activation of the catalyst which can have a significant influence on the results. This can be done following step 4 in which the catalyst is subjected to rapid CV cycling at a relatively high scan rate (100 mV s−1 for example) for 50 cycles initially during which the change in overpotential for a fixed current density should be monitored as a function of cycle number. A fully activated catalyst will show no more change in the overpotential. If the change is witnessed to be continuing beyond 50 cycles, one can increase the cycle number beyond until a stable activity is achieved. Regardless of whether there was activation or not in step 4, repeating step 3 here as step 5 is important to show that the catalyst is stable even after such harsh high scan rate CV cycling and the results obtained in step 3 are reliable. Steps 6 and 7 are to shed light on the origin of activity and compare the trend with other electrodes that will be screened consecutively. Step 8 is to be performed to construct a sampled-current voltammogram (SCV) which has a very high accuracy in determining activity as LSV/CV suffers from double-layer charging, the effect of scan rates used, and other issues commonly encountered with it. Step 9 is to show that the catalyst of choice is exceptionally stable under the benchmarking operation conditions. The final step (i.e., step 10) is repeating steps 5–8 to provide all the information after stability studies. Since selectivity is to be performed only for the best catalyst of the study, it can be done separately after finding out which catalytic electrode is relatively better. Following this recommendation will certainly minimize experimental difficulties and errors, and can save invaluable time.
Assessing activity
Among the three parameters of evaluation, activity is expressed in more than one way. Primarily, there are apparent and intrinsic activity markers in which the former changes with the loading and surface area of the catalyst while the latter remains unchanged irrespective of the loading or the surface area changes of the catalyst.23,68 In general, intrinsic activity markers are essential to design an efficient electrocatalytic system on a practical scale of operation with high apparent activity. Unfortunately, in almost all the studies reported recently in the area of electrocatalytic water splitting, only apparent activity markers have been used by overlooking the importance of intrinsic activity markers.Dos in the determination of TOF and specific activity:
• Determine the exact number of electrocatalytically accessible sites (ECAS)
• Convert the same into the real surface area
• Normalize the activity by the real surface area
• Normalize the real surface area normalized activity by Faradic efficiency and that will result in the precisely determined specific activity
• From the specific activity determined above, a range of TOF values can be calculated with the knowledge of ECAS obtained in the first step
• Report a range of TOF values at different overpotentials in the catalytic turnover region to show the trend over a wider potential window
Don’ts in the determination of TOF and specific activity if one desires to ensure higher accuracy:
• Never use geometrical area or mass normalized apparent activity
• Do not use the activity that was not normalized with faradaic efficiency
• Never assume that all the loaded atoms are available for catalysis unless there is not a single way to determine it precisely
• Do not report a set of TOF values calculated at a single overpotential for all the studied catalysts as it would not give an elaborate idea of the activity trend over a range of overpotentials
Fig. 1a–d is an example for an appropriately calculated specific activity and TOF following the protocols mentioned above.68Fig. 1a and b shows the oxidation peaks of the NiO catalyst with increasing loading that were used to calculate ECAS to further determine relative specific activity and TOF.
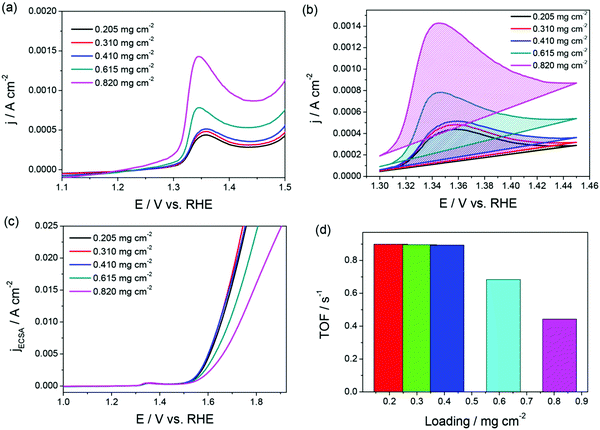 | ||
| Fig. 1 (a and b) LSVs of NiO/GC showing the oxidation of NiO to NiOOH with increasing loading. (c and d) Relative specific activity and TOF of the same showing loading independence until the surface coverage exceeded 100%. Reproduced from ref. 68 (Copyright 2019, American Chemical Society). | ||
Note that the specific activity in Fig. 1c is calculated assuming that the ECAS of the lowest NiO loading is equal to 1 cm2. Hence, it is called relative specific activity and so is the TOF calculated from the same in Fig. 1d. Please note that TOF can be an intrinsic activity marker only when calculated using the faradaic efficiency normalized activity. Using mass activity and areal activity which change with the changing loading and surface area would demean TOF being an intrinsic activity marker. The exchange current density, charge transfer coefficient, and Tafel constant are also intrinsic activity markers of an electrocatalyst that can be obtained via an appropriate Tafel analysis. Current–potential responses obtained at steady-state after complete iR drop compensation can be converted into a typical Tafel plot by plotting the log of current density against the iR corrected overpotential. For the Tafel equation to hold, the current contribution from the backward reaction must be less than 1% to the overall current.75 This is possible only when the potential region beyond 0.118 V from the onset is chosen. In the cases of water splitting reactions (i.e., HER and OER), there is no mass transfer limitation and loss of kinetics due to concentration change in the vicinity of the electrode as the products formed are gaseous and the active species (H+ and OH−) are abundant.67 This lowers the biggest burden in the Tafel analysis of mass transfer limited reaction suffering from concentration overpotential. Hence, with OER and HER, we have a large potential range to choose for the Tafel analysis. In general, when it comes to Tafel analysis, though it is relatively easy to obtain the charge transfer coefficient and the Tafel constant, the slope which is an indirect measure of the charge transfer coefficient and the exchange current density are commonly given higher attention. In our recent viewpoint,67 we have shown the appropriate ways in which the Tafel slope and exchange current densities should be obtained by taking an electrochemically activated Co foil electrode. In this study, we compared the CA-derived Tafel line with the Tafel lines that were derived from transient LSVs of varying scan rates. Fig. 2a shows the scan rate-dependent LSVs with complete iR drop correction for the activated Co foil electrode and Fig. 2b and c show the respective Tafel lines derived from the same. The changing Tafel slopes with the changing scan rate can be witnessed in Fig. 2b, while the changing exchange current density with the changing scan rate can be seen in Fig. 2c.
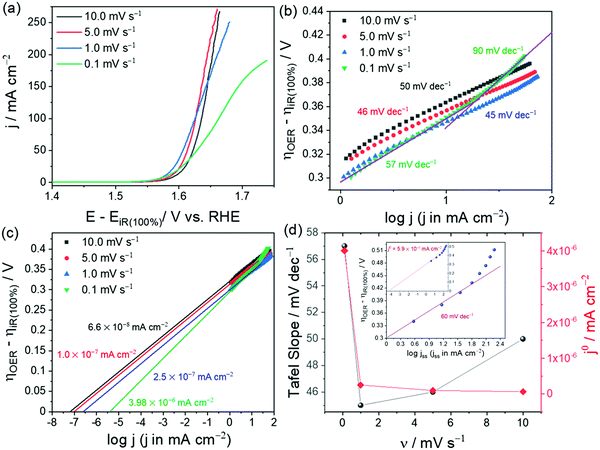 | ||
| Fig. 2 (a) iR compensated LSVs of activated Co foil with varying scan rates. (b and c) Respective Tafel plots showing slopes and exchange current density values for each scan rate. (d) Plot of scan rate against Tafel slope (black) and exchange current density (red) showing a closer match (only in Tafel slope) found for the lowest scan rate. The inset of (d) is the Tafel line constructed from steady-state current density obtained from CA and corrected for iR drop by 100%. Reproduced from ref. 67 (Copyright 2021, American Chemical Society). | ||
This observation is strong evidence that the scan rate has a significant influence on the Tafel analysis. Fig. 2d is the plot of Tafel slopes and exchange current densities against their respective scan rate. As can be seen in comparison with the inset of Fig. 2d which is the Tafel line derived from steady-state CA responses, only the lowest scan rate (0.1 mV s−1) LSV was able to show a closer Tafel slope to that of the one obtained from the Tafel line constructed from CA responses, yet it failed to reflect a closer exchange current density value as the ratio of exchange current density and capacitance current is very low. In such cases, only the Tafel lines constructed from steady-state responses will serve the purpose accurately. Following are the key points that need to be highlighted in the context of determination of the Tafel slope and exchange current density.
Dos in the determination of the Tafel slope and exchange current density:
• Always use CA or CP responses for constructing Tafel lines
• Be sure to correct them for iR drop by 100% always. For the cases in which it is not possible, limit the potential window within which 100% iR drop compensation is possible
• Always choose a potential region that is 0.118 V away from the onset potentials to ensure that you are in the Tafel region (i.e., the current contribution from the backward reaction is <1%)
• Measure the slope over a range of at least two decades if possible. If not, measure it at least for one full decade, as extrapolating the Tafel lines of fractional decades could not give accurate values
• If LSV/CV is what one needs to use for Tafel analysis, ensure that it was recorded with the lowest possible scan rate and corrected for iR drop completely. (Warning: As LSV/CV does not represent the steady-state no matter what the scan rate is, we strongly recommend the complete avoidance of LSV/CV for Tafel analysis.)
• Fit the Tafel lines with as many slopes as possible if they are not perfectly linear over the potential region chosen for the analysis
• EIS responses recorded at regular intervals can also be used to construct an accurate Tafel line that will result in the most precise slope and exchange current density
Don’ts in the determination of the Tafel slope and exchange current density:
• Never use an LSV/CV for Tafel analysis. If that is what one needs to use avoid using the ones recorded at higher scan rates
• Never use partially iR drop compensated current–potential response for Tafel plot construction
• Never extrapolate a Tafel line that is not perfectly linear to get a slope
• Never extrapolate a Tafel line which is not covering at least a decade of current density
The Tafel constant is a relatively rarely used marker which generally is the overpotential at which the catalytic interface delivers a unit current density in mA cm−2. When the current density is 1 mA cm−2, the entire term in the Tafel equation that defines the Tafel slope becomes 0 and the remaining is the one that has exchange current density and can be expressed in V. The charge transfer coefficient is actually another way of reporting the Tafel slope, but in theory, it is meant to be a dimensionless number ranging from 0 to 1. This can be obtained by rearranging the term that expresses the Tafel slope in the Tafel equation for the charge transfer coefficient. However, it is recently understood that the charge transfer coefficient is overpotential dependent and could significantly vary with the mechanism of the reaction under study. To avoid such conflicts, it is always better to report the product of the number of electron transfers involved in the reaction and the charge transfer coefficient.
On the other hand, if the current is normalized with the loading of the catalyst, the resultant activity is called ‘mass activity’ and is expressed in A per unit mass (generally, A g−1).78 The concept of mass activity was mainly introduced as a complementary marker to the areal activity as the former avoids the issues with determining the real surface area. However, mass activity has its own limitations. One of the significant limitations of mass activity is assuming 100% participation. The catalysts buried well below the surface layer can never be accessed by the electrolyte and are considered to be dead mass. In such a case assuming 100% participation and normalizing the activity by the whole mass of the loaded catalyst would significantly undermine the true activity. This can be avoided by using thin layer catalysts and modified electrodes with partial surface coverages. However, as the mass activity varies with the varying loading just like areal activity does with the varying geometrical activity, mass activity does also fall under the category of apparent activity markers. However, this does not mean that these apparent activity markers are of least significance (scientifically). Developing 3D catalytic electrodes with huge loadings without losing active sites is also a long standing scientific challenge which can be addressed only by paying equal attention to the apparent activity markers. Irrespective of the nature, both apparent (areal and mass) and intrinsic (TOF and specific) activity markers are severely affected by the technique by which they are determined. In general, everyone uses transient electroanalytical techniques such as LSV or CV almost exclusively to determine the activity of a water splitting electrocatalyst despite the fact that they are exaggerating the numbers significantly. Since the potential is not kept constant for a sufficiently long time before stepping up or down to the next potential step even with the scan rate as low as 1 mV s−1, the activity (i.e. faradaic OER and HER currents) is often accompanied by capacitance current and currents from parasitic reactions and self-redox reactions.
As a result, the current density measured using these transient techniques is always overestimated or exaggerated when compared to the activity determined using CA under the catalytic turnover conditions (Fig. 3a and b).64 However, CA is a time-consuming tool and constructing a voltammogram using CA data points would cost days for a set of catalysts. Very recently, we showed that constructing quasi-steady-state sampled current voltammograms (SCVs) from short time CA responses of an activated stainless steel electrode could actually reflect better closeness to the activity determined using CA when compared to the one determined using transient LSVs (Fig. 3a and b). We also found that the overestimation of activity by transient techniques is a universal phenomenon and using SCV can help us eliminate this issue to a greater extent without costing much time (Fig. 4a–d).64
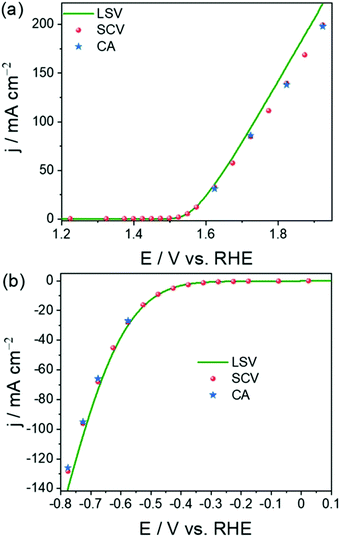 | ||
| Fig. 3 OER (a) and HER (b) polarization curves obtained using LSV and SCV and provided in comparison with the activity determined using CA. Reproduced from ref. 64 (Copyright 2022, IOP Publishing). | ||
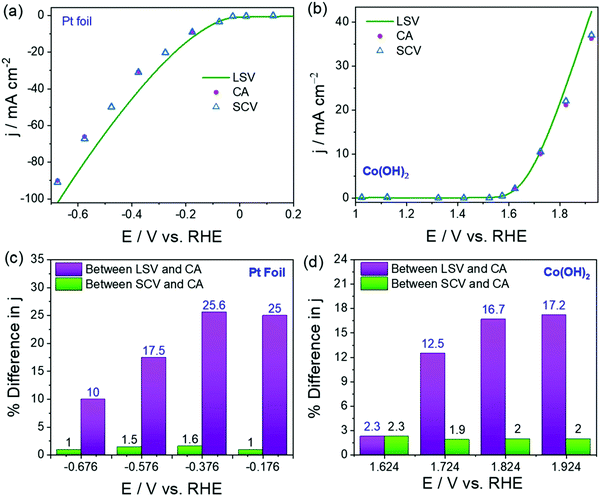 | ||
| Fig. 4 (a) HER polarization curves of Pt foil acquired using LSV and SCV and provided in comparison with CA data. (b) OER polarization curves of Co(OH)2 acquired using LSV and SCV and provided in comparison with CA data. (c and d) The plots of % difference in j between LSV and CA, and SCV and CA against potential showing the closeness of SCV and CA. Reproduced from ref. 64 (Copyright 2022, IOP Publishing). | ||
Dos in apparent activity determination
• Use areal activity only for planar and smooth electrodes
• Use mass activity for modified electrodes of thin catalyst films
• Use transient techniques at the lowest possible scan rate as they overestimate activity and the degree of overestimation increases with increasing scan rate
• Use steady-state (CA/CP) and quasi-steady-state (SCV) techniques to accurately measure activity
Don’ts in apparent activity determination
• Never use transient techniques at higher scan rates as even 1 mV s−1 can cause significant overestimation in activity
• Never use areal activity for electrodes of high porosity, roughness, and 3D configurations as the projected area is never equal to the real area
• Never use mass activity with modified electrodes of thicker catalyst films as the dead mass (catalysts buried underneath) would have to be included in the normalization unnecessarily
Assessing selectivity
Selectivity is not usually a bigger issue with water splitting electrocatalysts as the other possible competing reactions are almost absent. Especially, with HER in a dissolved oxygen expelled electrolyte, there is no other known reaction that may occur unless otherwise the catalyst itself possesses an electrochemically reducible species within the HER potential window.23 In such cases, the reduction of the catalyst will initially contribute notable current to the HER current and will subsequently cease once all the reducible species are electrochemically reduced. On the other hand, when the dissolved oxygen is not expelled properly (by purging an inert gas), the reduction of oxygen may also contribute to the HER current. The OER on the other side has other competing reactions that generally are suppressed by the thermodynamically favored OER. Examples of such competing reactions in the anode compartment are two-electron water oxidation reaction (2e− WOR) resulting in H2O2, formation of O3, and formation of the hydroxyl radical.79–81 The reversible potentials of these reactions are much higher than that of OER, and hence, they are greatly suppressed by thermodynamically facile OER. However, with certain materials of appropriate free energies of interactions of intermediates, these reactions can be made selective over OER and used for other distinct applications such as disinfection and pollutant treatments. On the catalyst side, the self-redox reaction of the catalyst and the current contribution from the same to the OER current are unavoidable. This is the reason why no OER electrocatalyst could have a 100% faradaic efficiency. Between HER and OER, the odds of encountering faradaic efficiency less than 100% is high with the latter. Regardless of this fact, it is always essential to show the faradaic efficiency of a water splitting electrocatalyst. For complex reactions in which the formation of more than one product is possible with different selectivity such as the reduction of N2, CO2, NOx, and SOx, oxidation of alcohols and polyols, etc.,82–85 highly sophisticated experimental set-ups with high precision are inevitable. In-line GC-MS and DEMS are two such versatile tools that can quantify each product resulting from the redox reaction of an analyte and let us calculate the faradaic efficiency with high accuracy.78,86–89 The same can also be used in water splitting electrocatalysis yet is not the only option we have. Other simpler and conventional methods can also be used. The fastest and the easiest of all is to use the rotating ring disk electrode (RRDE) set up for the instant determination of selectivity at a given overpotential or for a range of potentials. The principle behind this technique is collecting the products (formed at the disk electrode modified with the electrocatalyst) in the ring electrode and reducing or oxidizing them back. From the charges passed from the redox reactions occurring at the disk and ring electrodes, the faradaic efficiency can easily be calculated using Faraday's laws of electrolysis provided the collection efficiency (NCL) of the RRDE set-up is precisely known.90–92Eqn (1) is used to calculate the faradaic efficiency in this.| FE (%) = (jr × nd)/(jd × nr × NCL) | (1) |
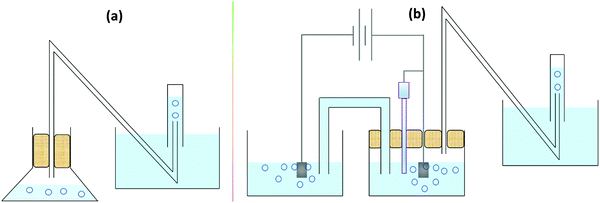
A detailed account of the use of RRDE for the determination of faradaic efficiency of OER electrocatalysts can be found in our earlier works.90,91 At this point, it is important to be reminded that in the case of OER, the opposite reaction that is occurring at the ring electrode is ORR and we know that both OER and ORR are well-separated in terms of overpotentials. However, in the case of HER, the opposite reaction that would be occurring at the ring electrode is HOR and these two are not well separated in terms of overpotential with catalysts (i.e., Pt, Ru, Rh, and Ir) that can have an HER onset of 0.0 V vs. RHE. In that case, we recommend the use of constant potential measurements at the disk instead of conventional sweeping while also ensuring that the set constant potential is kept sufficiently cathodic from the HOR potential set for the ring electrode. Also, while setting the HOR potential at the ring electrode, care must be taken to avoid any HER that may occur. This can be done by setting a potential that is at least 0.01 V anodic to the reversible potential of HER (i.e., 0.0 V vs. RHE). Though RRDE is an efficient, swift, and easy method to determine faradaic efficiency, not everyone can afford the set-up. Fortunately, since the reactions we are dealing with in water electrolysis are forming gaseous products, the centuries-old water-displacement set-up (Fig. 5a) can be used for quantifying the amount of product formed in water electrolysers with a few modifications as shown in Fig. 5b. Since the gas is collected only in the graded cylinder filled water (usually colored) upside down can be quantified, it is essential to perform pre-electrolysis before we can begin the measurements.
Dos in selectivity determination
• One can use any tool of your convenience (GC-MS, DEMS, RRDE, and water displacement)
• The use of GC-MS, DEMS, and RRDE is recommended for time-sensitive catalysts and for instant measurements
• Determine NCL every time before using the RRDE for selectivity determination
• In the water-displacement method, use a dye that won’t react with the product formed (for example, using chemically inert dyes in the water for quantifying O2)
Don’ts in selectivity determination
• Never assume that the faradaic efficiency is 100% (even for HER)
• Never use easily reducible (with H2) and easily oxidizable (with O2) dyes to color the water inside the water-displacement set-up as they can react and consume a significant quantity of the products resulting from electrolysis
Assessing stability
The stability of an electrocatalyst is what ultimately determines the fate of an electrocatalyst whether or not to be chosen for commercial bulk-scale operations. No matter how high the activity and selectivity of an electrocatalyst can be, unless it possesses appreciable stability, it can never be an ideal one.23 In fact, electrocatalysts of moderate activity and selectivity are commonly not bothered to be used in high-temperature operations as long as their stability is good. Examples include perovskites and spinels used in steam electrolysis and solid-oxide fuel cells. Water splitting electrocatalysts are in general tested for their stability by sweeping the potential in a wider window at a high scan rate for thousands of cycles and monitoring the overpotential change as a function of cycle numbers and performing the reaction at a constant potential or current density for a very long time. With the latter, the change in current density or overpotential is monitored as a function of time. A better catalyst is expected to show the least possible increase in overpotential or lowering in current density after days of operations.There is also the accelerated degradation (AD) test which basically qualifies a catalyst for bulk-scale operations provisionally.93,94 In the AD test, the catalyst is subjected to a very high overpotential (500 to 600 mV) or to a very high current density (1000 to 2000 mA cm−2) for a longer period of time (usually several days) and the change in activity in terms of overpotential or current density is recorded. Under this condition, the reaction of interest is accelerated at a very high rate and the catalyst is highly prone to severe corrosion, deactivation, detachment, and leaching. If any catalyst could withstand these harsh operation conditions of accelerated kinetics for several days, then it can blindly be considered for scale-up and bulk electrolysis. Other than this, it is also recommended to perform such stability studies at slightly elevated temperatures as sometimes the temperature of the cell will be increased in bulk electrolysis to improve the kinetics and minimize high cell voltages. Occasionally, for bifunctional electrocatalysts which perform both anodic OER and cathodic HER, a reverse polarity test is performed in which the HER/OER activity is measured before and after reversing the polarity.95,96 The polarity reversal is done using CA/CP and the change in activity is measured using a transient technique as shown in Fig. 6.96 A catalyst qualifying in all these stability studies can be considered as an ideal choice for commercial application of the same.
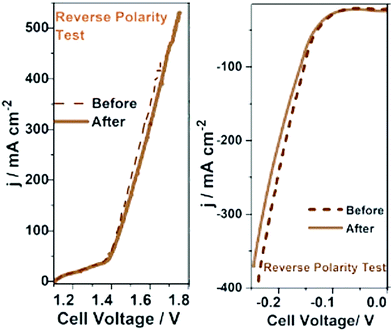 | ||
| Fig. 6 Reverse polarity tests carried out for bi-functional Co-Fe and Co-Mo catalysts grown on sensitized bamboo fiber substrates. Reproduced from ref. 96 (Copyright 2021, Royal Society Chemistry). | ||
Dos in assessing the stability
• Always perform stability studies with an electrode of area 1 cm2 or higher
• Ensure complete wettability
• Ensure the absence of capillary action (with the electrolyte) in 3D electrodes
• Avoid having several heterojunctions in the circuit
• Ensure the swift removal of gas bubbles from the working electrode (as it enhances mass transfer through convection induced by the rapid removal of gas bubbles) either by stirring the solution or by performing the stability studies at high current density or overpotentials
Don’ts in assessing the stability
• Never use an electrode of area less than 1 cm2 as one would have to normalize the activity after stability study and provide a stability pattern at a current density that the electrode never delivered. (For example, if one wanted to perform CP at 10 mA cm−2, with a standard GC electrode of area 0.0732 cm2, the current one would have needed to set in the actual experiment was just 0.732 mA. In that case, the catalyst had actually experienced relatively less vigorous operation conditions than what it would be projected to had been after normalization.)
• Never study the stability of foam-type electrodes under low current/overpotential conditions as it would lead to very slow formation of gas bubbles and would effectively mask most of the active sites for a notably longer time.
Miscellaneous supporting studies
Even though assessing the activity, selectivity, and stability is the primary objective in screening a water splitting electrocatalyst as described above, the study would not be complete unless the trend in activity determined for a given set of catalysts is justified and the reliability of the produced data is ascertained. The activity trend is generally justified by comparing the trend in charge transfer resistance values measured for all the catalysts at the same overpotential under the catalytic turnover condition. Note that for water splitting electrocatalysts, it is their HER and OER activity trends that need justifications. Hence, it is important to perform the comparative electrochemical impedance (EI) analysis under the catalytic turnover condition.66 In addition to this, the double-layer capacitance is measured comparatively by recording the scan rate-dependent double-layer charging currents in a non-faradaic region.65,97 Even though the measure of double-layer capacitance is an indirect measure of electrochemical surface area, it can alone not justify the activity trend all the time as the charge transfer resistance trends obtained from EI analysis do. It is simply because the double-layer capacitance is a measure that is basically derived from currents that involve no transfer of electrons whereas the HER and OER that we study with water splitting electrocatalysts are purely faradaic in nature. Hence, it is not always required to have the same double-layer capacitance trend as that of the faradaic OER/HER activity trend. However, the trend of activity should reciprocally match with the trend in charge transfer resistance values as both of them are the result of electron transfer in the catalytic turnover region.In fact, the combined use of double-layer capacitance and the charge transfer resistance values can provide invaluable information on the nature of activity enhancement. For example, if a catalyst exerts better activity than the other only because of increased electrochemical surface area, both double-layer capacitance and charge transfer resistance trends will match with the activity trend. In contrast, if the activity enhancement is of intrinsic nature, the double-layer capacitance will have no difference from or even less than that of the least active catalyst but the charge transfer resistance trend will still align with the activity trend. An example of this case is the bleached stainless steel (BSS) with an increased electrochemical surface area but poorer OER activity than the pristine stainless steel (SS) (Fig. 7a–c).65 Therefore, a combined use and interpretation of trends in double-layer capacitance and charge transfer resistance is recommended.
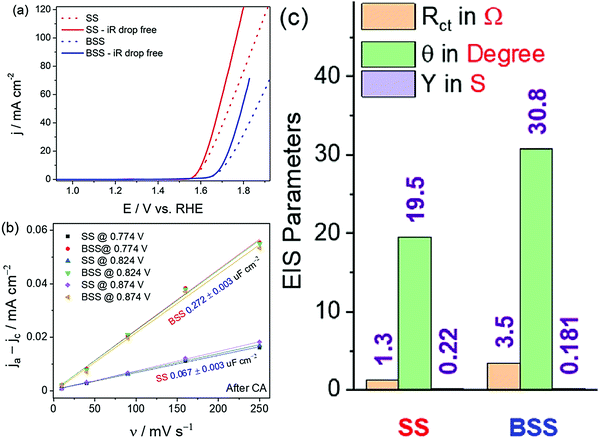 | ||
| Fig. 7 (a) OER LSVs of SS and BSS before and after iR corrections. (b) Plot of double-layer charging current density against the scan rate showing increased electrochemical surface area for BSS. (c) EIS parameters showing better charge transfer characteristics for SS despite having lower double-layer capacitance when compared to BSS. Reproduced from ref. 65 (Copyright 2021, Elsevier). | ||
Finally, the reliability of the data acquired should be ensured. This is the part of the electrochemical screening of all electrocatalysts which is often either not mentioned or never done. Significant errors could arise if the pH and the potential of the reference electrodes are not precisely known. Since all the potentials we use in water splitting electrocatalysis are converted to the reversible hydrogen electrode (RHE) scale, a precise knowledge of the exact pH and the potential of the reference electrode is inevitable. There are many commercially available high precision pH meters that can help us measure the exact pH. Similarly, one can easily couple the reference electrode in use with another standard reference electrode of known potential and can determine the exact potential of the former. The easier way is to perform Pt stripping voltammetry. In this method, one has to sweep the potential cathodically by taking a Pt electrode as the working electrode in a solution of unknown pH with a reference electrode of unknown potential. From the resultant voltammogram, the onset potential of hydrogen overpotential deposition (HOPD) on Pt (i.e., HER on Pt) can be easily found and this potential has to be assumed to be equal to 0.0 V vs. RHE.98,99 The same potential can also then be used to convert the potentials to the RHE scale. In this way, one can easily ascertain the reliability of the potentials reported in the study.
Summary and outlook
Water splitting electrocatalysis is one of the intensively studied areas of energy research in recent days because of the promises it holds toward green hydrogen production and decarbonizing the world economy. This is an interdisciplinary field that requires the concerted effort of electrochemists, materials chemists, chemical engineers, mechanical engineers, physicists, and environmentalists who can develop catalysts, screen performance, design cells, and perform simulations and modelling of life cycle assessment. As a consequence of the interdisciplinary nature of this field, it has become inevitable for researchers with little or no prior experience in using electroanalytical tools to get to know them all in detail in order to ensure reliability of the data being reported. Unfortunately, encountering misinterpreted electrochemical characterization data in published articles in the literature has become more frequent now than ever. Hence, recently there have been several attempts by the core electrochemists in this field to advise and recommend the best practices. Having realized the significance of this issue, we provide this comprehensive perspective detailing the dos and don’ts of screening electrocatalysts for water splitting electrocatalysis. With the best practices advised to be followed and the practices advised never to be followed, it is strongly believed that the accumulation of misinterpreted electrochemical characterization data in this field of research will greatly be minimized in the near future.Conflicts of interest
The authors declare no competing interests.Acknowledgements
This work is supported by the grant-in-aid for researchers at RISE, Waseda University, Tokyo, Japan.References
- S. Anantharaj, Curr. Opin. Electrochem., 2022, 33, 100961 CrossRef CAS.
- R. Gao and D. Yan, Adv. Energy Mater., 2020, 10, 1900954 CrossRef CAS.
- N. Dubouis and A. Grimaud, Chem. Sci., 2019, 10, 9165–9181 RSC.
- C. Hu, L. Zhang and J. Gong, Energy Environ. Sci., 2019, 12, 2620–2645 RSC.
- S. Anantharaj and V. Aravindan, Adv. Energy Mater., 2020, 10, 1902666 CrossRef CAS.
- S. Anantharaj, J. Mater. Chem. A, 2021, 9, 6710–6731 RSC.
- S. Anantharaj, S. Noda, V. R. R. Jothi, S. C. Yi, M. Driess and P. W. Menezes, Angew. Chem., Int. Ed., 2021, 60, 18981–19006 CrossRef CAS.
- S. Anantharaj, S. Kundu and S. Noda, J. Mater. Chem. A, 2020, 4174–4192 RSC.
- S. Anantharaj and S. Noda, Small, 2020, 16, 1905779 CrossRef CAS.
- E. Fabbri, A. Habereder, K. Waltar, R. Kötz, T. J. Schmidt, R. Kotz, T. J. Schmidt, R. Kötz, T. J. Schmidt, R. Kotz and T. J. Schmidt, Catal. Sci. Technol., 2014, 4, 3800–3821 RSC.
- Y. Shi and B. Zhang, Chem. Soc. Rev., 2016, 45, 1529–1541 RSC.
- S. Z. Oener, M. J. Foster and S. W. Boettcher, Science, 2020, 369, 1099–1103 CrossRef CAS.
- J. J. Lamb, O. S. Burheim and B. G. Pollet, Micro-Optics and Energy: Sensors for Energy Devices, Springer International Publishing, 2020, pp. 61–71 Search PubMed.
- S. Anantharaj, K. Karthick and S. Kundu, Inorg. Chem., 2019, 58, 8570–8576 CrossRef CAS PubMed.
- W. Luo, Y. Wang and C. Cheng, Mater. Today Phys., 2020, 15, 100274 CrossRef.
- Y. Yan, B. Xia, Z. Xu and X. Wang, ACS Catal., 2014, 4, 1693–1705 CrossRef CAS.
- Q. Ding, B. Song, P. Xu and S. Jin, Chem, 2016, 1, 699–726 CAS.
- Z. Chen, X. Duan, W. Wei, S. Wang and B. J. Ni, Nano Energy, 2020, 78, 105270 CrossRef CAS.
- S. Anantharaj and V. Aravindan, Adv. Energy Mater., 2019, 2, 1902666–1902695 Search PubMed.
- T. Shinagawa, M. T. K. Ng and K. Takanabe, ChemSusChem, 2017, 10, 4155–4162 CrossRef CAS PubMed.
- B. T. Chen, N. Morlanés, E. Adogla, K. Takanabe and V. O. Rodionov, ACS Catal., 2016, 6, 4647–4652 CrossRef CAS.
- S. Anantharaj, S. R. Ede, K. Sakthikumar, K. Karthick, S. Mishra and S. Kundu, ACS Catal., 2016, 6, 8069–8097 CrossRef CAS.
- S. Anantharaj, S. R. Ede, K. Karthick, S. Sam Sankar, K. Sangeetha, P. E. Karthik, S. Kundu, E. K. Pitchiah and S. Kundu, Energy Environ. Sci., 2018, 11, 744–771 RSC.
- S. Y. Bae, J. Mahmood, I. Y. Jeon and J. B. Baek, Nanoscale Horiz., 2020, 5, 43–56 RSC.
- P. Xiao, W. Chen and X. Wang, Adv. Energy Mater., 2015, 5, 1500985–1500997 CrossRef.
- S. Anantharaj and S. Noda, Int. J. Hydrogen Energy, 2020, 45, 15763–15784 CrossRef CAS.
- A. Brisse, J. Schefold and M. Zahid, Int. J. Hydrogen Energy, 2008, 33, 5375–5382 CrossRef CAS.
- P. Li, R. Zhao, H. Chen, H. Wang, P. Wei, H. Huang, Q. Liu, T. Li, X. Shi, Y. Zhang, M. Liu and X. Sun, Small, 2019, 15, 1805103 CrossRef.
- L. Trotochaud and S. W. Boettcher, Scr. Mater., 2014, 74, 25–32 CrossRef CAS.
- Y. Cheng and S. P. Jiang, Prog. Nat. Sci. Mater. Int., 2015, 25, 545–553 CrossRef CAS.
- N.-T. Suen, S.-F. Hung, Q. Quan, N. Zhang, Y.-J. Xu and H. M. Chen, Chem. Soc. Rev., 2017, 46, 337–365 RSC.
- A. Rebekah, S. Anantharaj, C. Viswanthan and N. Ponpandian, Int. J. Hydrogen Energy, 2020, 45, 14713–14727 CrossRef CAS.
- S. Anantharaj, K. Karthick, P. Murugan and S. Kundu, Inorg. Chem., 2020, 59, 730–740 CrossRef CAS.
- S. Anantharaj, S. Kundu and S. Noda, Nano Energy, 2021, 80, 105514 CrossRef CAS.
- S. Anantharaj, H. Sugime, B. Chen, N. Akagi and S. Noda, Electrochim. Acta, 2020, 364, 137170 CrossRef CAS.
- B. Malik, S. Anantharaj, K. Karthick, D. K. Pattanayak and S. Kundu, Catal. Sci. Technol., 2017, 7, 2486–2497 RSC.
- S. Anantharaj, K. Karthick and S. Kundu, Inorg. Chem., 2018, 57, 3082–3096 CrossRef CAS.
- S. Anantharaj, T. S. Amarnath, E. Subhashini, S. Chatterjee, K. C. Swaathini, K. Karthick and S. Kundu, ACS Catal., 2018, 8, 5686–5697 CrossRef CAS.
- S. Anantharaj, K. Karthick, M. Venkatesh, T. V. S. V. Simha, A. S. Salunke, L. Ma, H. Liang and S. Kundu, Nano Energy, 2017, 39, 30–43 CrossRef CAS.
- M. Gong, D. Y. Wang, C. C. Chen, B. J. Hwang and H. Dai, Nano Res., 2016, 9, 28–46 CrossRef CAS.
- L. Yang, H. Xu, H. Liu, D. Cheng and D. Cao, Small Methods, 2019, 3, 1900113 CrossRef.
- B. M. Hunter, H. B. Gray and A. M. Müller, Chem. Rev., 2016, 116, 14120–14136 CrossRef CAS PubMed.
- M. E. G. Lyons and M. P. Brandon, Int. J. Electrochem. Sci., 2008, 3, 1425–1462 CAS.
- I. Katsounaros, S. Cherevko, A. R. Zeradjanin and K. J. J. Mayrhofer, Angew. Chem., Int. Ed., 2014, 53, 102–121 CrossRef CAS PubMed.
- J. R. Swierk, S. Klaus, L. Trotochaud, A. T. Bell and T. D. Tilley, J. Phys. Chem. C, 2015, 119, 19022–19029 CrossRef CAS.
- S. Anantharaj and S. Noda, Energy Environ. Sci., 2022, 15, 1461–1478 RSC.
- H. Wendt and G. Imarisio, J. Appl. Electrochem., 1988, 18, 1–14 CrossRef CAS.
- C. Wei, R. R. Rao, J. Peng, B. Huang, I. E. L. Stephens, M. Risch, Z. J. Xu and Y. Shao-Horn, Adv. Mater., 2019, 31, 1806296 CrossRef PubMed.
- S. Cherevko, S. Geiger, O. Kasian, N. Kulyk, J. P. Grote, A. Savan, B. R. Shrestha, S. Merzlikin, B. Breitbach, A. Ludwig and K. J. J. Mayrhofer, Catal. Today, 2016, 262, 170–180 CrossRef CAS.
- M. S. Burke, L. J. Enman, A. S. Batchellor, S. Zou and S. W. Boettcher, Chem. Mater., 2015, 27, 7549–7558 CrossRef CAS.
- D. Friebel, M. W. Louie, M. Bajdich, K. E. Sanwald, Y. Cai, A. M. Wise, M. J. Cheng, D. Sokaras, T. C. Weng, R. Alonso-Mori, R. C. Davis, J. R. Bargar, J. K. Nørskov, A. Nilsson, A. T. Bell, J. K. Norskov, A. Nilsson and A. T. Bell, J. Am. Chem. Soc., 2015, 137, 1305–1313 CrossRef CAS.
- M. W. Louie and A. T. Bell, J. Am. Chem. Soc., 2013, 135, 12329–12337 CrossRef CAS PubMed.
- M. S. Burke, C. D. M. Trang, L. J. Enman, J. Deng and S. W. Boettcher, J. Am. Chem. Soc., 2017, 139, 11361–11364 CrossRef.
- R. Subbaraman, D. Tripkovic, D. Strmcnik, K.-C. K.-C. Chang, M. Uchimura, A. P. Paulikas, V. Stamenkovic and N. M. Markovic, Science, 2011, 334, 1256–1260 CrossRef CAS.
- N. Danilovic, R. Subbaraman, D. Strmcnik, K. C. Chang, A. P. Paulikas, V. R. Stamenkovic and N. M. Markovic, Angew. Chem., Int. Ed., 2012, 51, 12495–12498 CrossRef CAS PubMed.
- Y. Jiao, Y. Zheng, M. Jaroniec and S. Z. Qiao, Chem. Soc. Rev., 2015, 44, 2060–2086 RSC.
- X. Wang, C. Xu, M. Jaroniec, Y. Zheng and S. Z. Qiao, Nat. Commun., 2019, 10, 4876 CrossRef.
- M. Cabán-Acevedo, M. L. Stone, J. R. Schmidt, J. G. Thomas, Q. Ding, H.-C. Chang, M.-L. Tsai, J.-H. He and S. Jin, Nat. Mater., 2015, 14, 1245–1251 CrossRef.
- D. Voiry, M. Chhowalla, Y. Gogotsi, Y. Li, R. M. Penner and R. E. Schaak, ACS Nano, 2018, 12, 9635–9638 CrossRef CAS.
- W. Zheng, M. Liu and L. Y. S. Lee, ACS Energy Lett., 2020, 5, 3260–3264 CrossRef CAS.
- S. Anantharaj, P. E. Karthik and S. Noda, Angew. Chem., Int. Ed., 2021, 60, 23051–23067 CrossRef CAS PubMed.
- S. Jung, C. C. L. McCrory, I. M. Ferrer, J. C. Peters and T. F. Jaramillo, J. Mater. Chem. A, 2016, 4, 3068–3076 RSC.
- C. Costentin, G. Passard and J. M. Savéant, J. Am. Chem. Soc., 2015, 137, 5461–5467 CrossRef CAS.
- S. Anantharaj, S. Kundu and S. Noda, J. Electrochem. Soc., 2022, 169, 014508 CrossRef.
- S. Anantharaj, H. Sugime and S. Noda, J. Electroanal. Chem., 2021, 903, 115842 CrossRef CAS.
- S. Anantharaj and S. Noda, ChemElectroChem, 2020, 7, 2297–2308 CrossRef CAS.
- S. Anantharaj, S. Noda, M. Driess and P. W. Menezes, ACS Energy Lett., 2021, 6, 1607–1611 CrossRef CAS.
- S. Anantharaj and S. Kundu, ACS Energy Lett., 2019, 4, 1260–1264 CrossRef CAS.
- S. Anantharaj and S. Noda, J. Mater. Chem. A, 2022, 10, 9348–9354 RSC.
- P. Zóltowski, Electrochim. Acta, 1980, 25, 1547–1554 CrossRef.
- Y. Huang, R. J. Nielsen and W. A. Goddard, J. Am. Chem. Soc., 2018, 140, 16773–16782 CrossRef CAS PubMed.
- R. Guidelli, R. G. Compton, J. M. Feliu, E. Gileadi, J. Lipkowski, W. Schmickler and S. Trasatti, Pure Appl. Chem., 2014, 86, 245–258 CrossRef CAS.
- P. K. Wrona, A. Lasia, M. Lessard and H. Ménard, Electrochim. Acta, 1992, 37, 1283–1294 CrossRef CAS.
- A. P. Murthy, J. Theerthagiri and J. Madhavan, J. Phys. Chem. C, 2018, 122, 23943–23949 CrossRef CAS.
- T. Shinagawa, A. T. Garcia-Esparza and K. Takanabe, Sci. Rep., 2015, 5, 13801 CrossRef PubMed.
- R. Zhang, X. Ren, S. Hao, R. Ge, Z. Liu, A. M. Asiri, L. Chen, Q. Zhang and X. Sun, J. Mater. Chem. A, 2018, 6, 1985–1990 RSC.
- L. Xie, F. Qu, Z. Liu, X. Ren, S. Hao, R. Ge, G. Du, A. M. Asiri, X. Sun and L. Chen, J. Mater. Chem. A, 2017, 5, 7806–7810 RSC.
- M. Görlin, P. Chernev, J. F. De Araújo, T. Reier, S. Dresp, B. Paul, R. Krähnert, H. Dau and P. Strasser, J. Am. Chem. Soc., 2016, 138, 5603–5614 CrossRef.
- S. C. Perry, D. Pangotra, L. Vieira, L. I. Csepei, V. Sieber, L. Wang, C. Ponce de León and F. C. Walsh, Nat. Rev. Chem., 2019, 3, 442–458 CrossRef CAS.
- A. T. Murray, S. Voskian, M. Schreier, T. A. Hatton and Y. Surendranath, Joule, 2019, 3, 2942–2954 CrossRef CAS.
- S. Anantharaj, S. Pitchaimuthu and S. Noda, Adv. Colloid Interface Sci., 2020, 287, 102331 CrossRef PubMed.
- G. Chen, S. Ren, L. Zhang, H. Cheng, Y. Luo, K. Zhu, L. Ding and H. Wang, Small Methods, 2019, 3, 1800337 CrossRef.
- J. Wang, S. Chen, Z. Li, G. Li and X. Liu, ChemElectroChem, 2020, 7, 1067–1079 CrossRef CAS.
- R. Daiyan, W. H. Saputera, H. Masood, J. Leverett, X. Lu and R. Amal, Adv. Energy Mater., 2020, 10, 1–36 Search PubMed.
- J. N. Tiwari, R. N. Tiwari, G. Singh and K. S. Kim, Nano Energy, 2013, 2, 553–578 CrossRef CAS.
- M. V. Makarova, J. Jirkovský, M. Klementová, I. Jirka, K. Macounová and P. Krtil, Electrochim. Acta, 2008, 53, 2656–2664 CrossRef CAS.
- J. Jirkovský, M. Makarova and P. Krtil, Electrochem. Commun., 2006, 8, 1417–1422 CrossRef.
- K. Macounová, M. Makarova, J. Jirkovský, J. Franc and P. Krtil, Electrochim. Acta, 2008, 53, 6126–6134 CrossRef.
- C. H. Choi, C. Baldizzone, J. P. Grote, A. K. Schuppert, F. Jaouen and K. J. J. Mayrhofer, Angew. Chem., Int. Ed., 2015, 54, 12753–12757 CrossRef CAS PubMed.
- K. Karthick, S. Anantharaj, P. E. P. E. Karthik, B. Subramanian and S. Kundu, Inorg. Chem., 2017, 56, 6734–6745 CrossRef CAS PubMed.
- S. Anantharaj, P. E. Karthik and K. Subrata, Catal. Sci. Technol., 2017, 7, 882–893 RSC.
- E. P. Karthik, A. K. Raja, S. S. Kumar, K. L. N. Phani, Y. Liu, S.-X. Guo, J. Zhang and A. M. Bond, RSC Adv., 2015, 5, 3196–3199 RSC.
- J. Zheng, Q. Gong, S. Gong, W. Yang, X. Cheng, L. Huang and H. Li, J. Electrochem. Soc., 2018, 165, F684–F692 CrossRef CAS.
- S. Anantharaj, P. E. P. E. Karthik, B. Subramanian and S. Kundu, ACS Catal., 2016, 6, 4660–4672 CrossRef CAS.
- N. Krstajic, V. Jovic, L. Gajickrstajic, B. Jovic, A. Antozzi and G. Martelli, Int. J. Hydrogen Energy, 2008, 33, 3676–3687 CrossRef CAS.
- H. Rajan, M. Christy, V. R. Jothi, S. Anantharaj and S. C. Yi, J. Mater. Chem. A, 2021, 9, 4971–4983 RSC.
- S. Sun, H. Li and Z. J. Xu, Joule, 2018, 2, 1–4 CrossRef.
- J. Zheng, W. Sheng, Z. Zhuang, B. Xu and Y. Yan, Sci. Adv., 2016, 2, e1501602 CrossRef PubMed.
- T. Binninger, E. Fabbri, R. Kotz and T. J. Schmidt, J. Electrochem. Soc., 2013, 161, H121–H128 CrossRef.
| This journal is © The Royal Society of Chemistry 2022 |


