 Open Access Article
Size-dependent aggregation of hydrophobic nanoparticles in lipid membranes
Enrico
Lavagna
a,
Jonathan
Barnoud†
b,
Giulia
Rossi
 *a and
Luca
Monticelli
 *c
*c
aDepartment of Physics, University of Genoa, Via Dodecaneso 33, 16146 Genoa, Italy. E-mail: rossig@fisica.unige.it
bGroningen Biomolecular Sciences and Biotechnology Institute, University of Groningen, Groningen, The Netherlands
cUniv Lyon, CNRS, Molecular Microbiology and Structural Biochemistry (MMSB, UMR 5086), F-69007, Lyon, France. E-mail: luca.monticelli@inserm.fr
First published on 16th April 2020
Abstract
The aggregation of nanoparticles affects their reactivity, transport across biological membranes, uptake into cells, toxicity, and fate in the environment. In the case of membrane-embedded, hydrophobic nanoparticles the relationship between size and aggregation pattern is not well understood. Here, we explore this relationship for the case of spherically symmetrical nanoparticles using the MARTINI coarse-grained force field. We find that the free energy of dimerization depends strongly on nanoparticle size: the smallest molecules (mimicking C60 fullerene) aggregate only weakly, the largest ones form large three-dimensional aggregates causing major deformations in the host membrane, and the intermediate-sized particles show a tendency to form linear aggregates. Suppressing membrane undulations reduces very significantly aggregation, and substantially abolishes linear aggregation, suggesting a relationship between membrane curvature and aggregation geometry. At low concentration, when placed on membranes of variable curvature, the intermediate size nanoparticles move rapidly to high curvature regions – suggesting that they can sense membrane curvature. At high concentration, the same nanoparticles induce massive membrane deformations, without affecting the mechanical stability of the membrane – suggesting that they can generate membrane curvature.
Introduction
The aggregation of nanoparticles (NPs) affects their reactivity, transport across membranes, uptake into cells, toxicity, and fate in the environment.1,2 Similar considerations are valid both for synthetic nanoparticles and biological ones, for instance proteins – whose properties and functioning (e.g., signaling, endo- and exocytosis, sorting to different organelles) are strongly dependent on their oligomerization or aggregation state.3,4 Nanoparticle aggregation at the surface or in the core of lipid membranes results from the interplay of direct nanoparticle–nanoparticle interactions (van der Waals, screened electrostatics, hydrogen bonding) and membrane-mediated interactions.4,5 The latter arise any time the nanoparticle alters membrane physical properties, for example by inducing a local curvature, introducing a hydrophobic mismatch between the lipids and the inclusion, or altering the conformational entropy of lipids in contact with the inclusion.6,7 All these perturbations correspond to an energy cost, and nanoparticle aggregation is a way to minimize this energetic penalty, as it reduces the area of the contact surface between the nanoparticle and the membrane.4 According to theoretical and simulation studies, the precise energy cost of membrane perturbation by the NP depends on NP shape,8–10 surface functionalization,11–13 as well as membrane composition, elasticity,11 and curvature,7,14 but it is not entirely clear how nanoparticle and membrane properties concur to determine nanoparticle aggregation pattern.In the case of membrane-adsorbed nanoparticles, i.e., hydrophilic NPs interacting strongly with the lipid head groups, the relationship between NP properties, membrane properties, and NP aggregation has been extensively investigated for using theoretical and simulation approaches (reviewed in ref. 4, 15 and 16), while experimental tests are scarce. Overall, theory and simulations suggested that nanoparticle aggregation depends on three parameters: nanoparticle size, membrane bending modulus, and strength of interaction between the nanoparticles and the polar region of the membrane. It was shown that the strength of the nanoparticle–lipid headgroup interaction determines the extent of nanoparticle wrapping, and different wrapping regimes lead, in turn, to different aggregation patterns12,13 and membrane deformations.17 For a given wrapping, different shapes of aggregates can be stabilized depending on the membrane bending modulus. Šarić and Cacciuto showed that, if the nanoparticle–membrane interaction is large enough, for common values of the bending modulus the most favorable aggregate shape is linear.11 Models treating the membrane as a one-particle-thick elastic sheet are appropriate to study nanoparticle–membrane interactions when the nanoparticle size is much larger than the membrane thickness (5 nm). For smaller membrane-adsorbed nanoparticles, higher-resolution coarse-grained models predict aggregation phase diagrams showing a richer variety of aggregate shapes.13
The case of membrane-embedded nanoparticles is quite different: membrane-embedded NPs are hydrophobic in nature, and their size is comparable to or smaller than the membrane thickness (5 nm or less). Aggregation of such membrane-embedded NPs has been tackled, again, mostly by theoretical approaches, reviewed in ref. 4 and 16 and molecular simulations, using molecularly detailed descriptions of the system.18 Coarse-grained molecular simulations have been applied also to membrane-embedded proteins, whose oligomerization state affects a range of physiological processes.3,19–21 Experimental data on the aggregation thermodynamics and the aggregation patterns of such small, membrane-embedded nanoparticles is scarce, but suggest a strong size dependence for the behavior of nanoparticles smaller than the membrane thickness.22 Compared to the case of adsorbed NPs, for embedded NPs it is difficult to find a single quantity representing the strength of interaction with the membrane. Moreover, the sources of membrane perturbation are clearly different – hence one cannot directly transfer the considerations based on adsorbed particles to embedded particles. The relationship between the properties of embedded NPs and NP aggregation pattern remains elusive. Some investigations have been carried out before on the aggregation of fullerene in lipid membranes,7,18,23,24 but the results were mostly qualitative or referred to a single nanoparticle size. Overall, it remains unclear how NP size affects the aggregation of hydrophobic spherical NPs in membranes.
Here, we study the aggregation behavior of model spherical hydrophobic nanoparticles, with size between 1 and 5 nm, partitioning into the core of lipid bilayer membranes. We find that, in POPC lipid membranes, aggregation strongly depends on nanoparticle size: we observe little or no aggregation for nanoparticles with a diameter below 2 nm (in agreement with previous results18,25,26), more substantial aggregation in linear geometry for nanoparticles with intermediate diameter (3 nm), and strong aggregation into 3D clusters for the largest nanoparticles. We also find that the different aggregation patterns correlate with membrane undulations and with the localization of the nanoparticles away from the bilayer mid plane. Finally, we show that the 3 nm nanoparticles can both sense and induce membrane curvature. At large concentrations, 3 nm nanoparticles can cause the spontaneous formation of membrane folds, by releasing the curvature stress in the region of the fold with the largest curvature.
Models and methods
Hydrophobic nanoparticles and lipids were modelled with the Martini coarse-grained (CG) force field.27–29 The models of hydrophobic NPs were based on the Martini model of C60 fullerene,24,26 consisting of 16 CG beads and hence coined F16. The interactions of CG beads are based on experimental free energies of transfer of fullerene between different solvents (CNP bead type, see ref. 24 for the details of the parameterization). All NPs were modelled as hollow spheres with the CG beads evenly spaced on their surface, and kept together by an elastic network. The names and sizes of the NPs used in this work are summarized in Table 1. We notice that the larger NPs do not represent actual carbon nanoparticles, but rather a generic model for hydrophobic nanoparticles.| Model | # of CNP beads | Diameter [nm] | VdW diameter [nm] |
|---|---|---|---|
| F16 | 16 | 0.7 | 1.13 |
| F64 | 64 | 1.44 | 1.87 |
| F216 | 216 | 2.88 | 3.31 |
| F576 | 576 | 4.20 | 4.63 |
The bilayer membrane consisted of POPC lipids, as they are among the most common lipids in eukaryotic cell membranes.
All simulations were carried out in the NPT ensemble unless specified, at 300 K and 1.0 bar; we used the so-called velocity rescale thermostat,30 Berendsen barostat31 for equilibration runs and Parrinello–Rahman barostat32 for production runs. Semi-isotropic pressure coupling was applied to ensure vanishing surface tension in the bilayers, unless differently specified. The equations of motion were integrated using the leap-frog algorithm with a time step of 20 fs. All the simulations were run using GROMACS 2018.6.33,34
Free energy calculations
The potentials of mean force (PMF) were calculated using the umbrella sampling method (US).35 In each US window, the system was biased with the “COM pulling” algorithm of GROMACS, applying a harmonic potential between centers of mass (COM); for NP dimerization profiles, we used the COMs of the two NPs as pulling groups, while for the water-membrane partitioning profiles we used the COM of the NPs and the COM of a cylindrical volume of lipids with the same diameter as the NP. Force constants for the harmonic biasing potential were set at 1500 kJ mol−1 unless specified. The profiles were extracted from the biased sampling windows by means of the weighted histogram analysis method (WHAM)36 as implemented in GROMACS.37Diffusion coefficient
We calculated the diffusion coefficient D of different species based on their mean square displacement (msd), using standard GROMACS tools. We used a simulation of 40 μs with 18 F216, restarting every 1 μs; the msd was linear up to 20 μs of diffusion time. The resulting diffusion coefficient was renormalized by a factor 1.5 to take into account the fact that the motion of the nanoparticles in the membrane is planar and not three-dimensional. The diffusion time tdiff was calculated as:where r is the radius of the nanoparticle.
Flat membrane simulations
We used two different methods to impose a flat geometry on the membranes: (a) positive surface tension; (b) harmonic constraints on the head groups. In the first case, we applied a surface tension of 30 mN m−1 to the system. This method has the drawback of increasing the area per lipid and reducing the density of the membrane, which has been shown to favor aggregation.18 The second method consists in imposing harmonic restraints on the z coordinate of the phosphate group of lipids (PO4 bead). We imposed a distance of 4.2 nm between the PO4s of the top and bottom leaflets, corresponding to the equilibrium distance in the unperturbed membrane. An elastic constant of 5 kJ mol−1 nm−1 was enough to flatten the membrane while still allowing some freedom for the single bead to fluctuate. We verified that this method does not perturb the surface tension of the membrane.Buckled membrane simulations
We obtained a buckled membrane by applying a pressure of 8.0 bar along the x dimension for 10 ns. The membrane was then kept in this configuration by fixing the length of the simulation box along the x direction. NPs were then inserted in water near the region of the buckle with zero curvature, and then pulled towards the bilayer interior using the COM pulling tool of GROMACS.Results and discussion
The free energy of dimerization depends on NP size
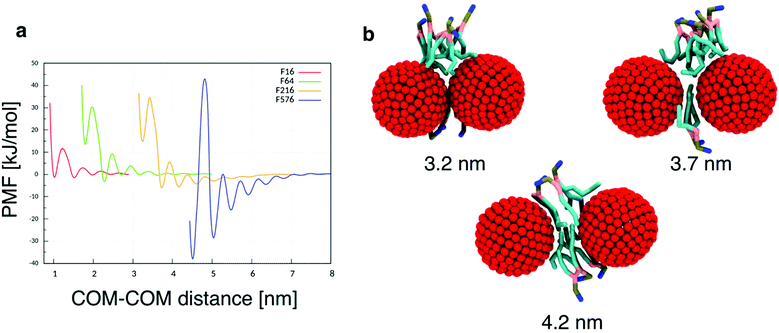
To quantitatively assess the thermodynamics of aggregation of spherical inclusions within a POPC bilayer we calculated free energy profiles for the dimerization process, for each NP size. The profiles were produced calculating the potential of mean force by means of umbrella sampling (see the Methods section).Each profile (Fig. 1a) shows a series of local minima corresponding to metastable configurations, separated by barriers. These free energy minima correspond to dimer configurations in which no lipid chains or a few layers of lipids chains are interposed between the surface of the two NPs (Fig. 1b). For example, the second minimum always corresponds to a distance equal to the thickness of a single lipid chain, as reported in Table 2.
| Model | Diameter [nm] | COM–COM distance [nm] | Minimum distance [nm] |
|---|---|---|---|
| F16 | 1.13 | 1.53 | 0.40 |
| F64 | 1.87 | 2.28 | 0.41 |
| F216 | 3.31 | 3.73 | 0.42 |
| F576 | 4.63 | 5.04 | 0.41 |
The PMF profiles show a strong size dependence. For F16, two dimer states have about the same probability as the monomeric state, in agreement with previous results,18 indicating that the lipid membrane is a good solvent for small hydrophobic NPs. For F64, the dimer with a single lipid chain intercalated between the fullerenes is the absolute minimum (−3.3 kJ mol−1 at 2.28 nm); the contact dimer (with no interposed lipid, NP–NP distance of 1.7 nm), is energetically unfavorable (+15 kJ mol−1) compared to the monomeric state and it is separated from the absolute minimum by an energy barrier larger than 30 kJ mol−1. The negative PMF for the lipid-separated dimer indicates a weak but not negligible tendency towards aggregation.
A similar but more pronounced behavior is shown in the profile of F216, with the minimum free energy state at 3.73 nm and a depth of −6 kJ mol−1, which is expected to yield significant, yet dynamic, aggregation at room temperature.
Finally, the largest fullerene (F576) shows a radically different behavior: the minima of the dimerization profiles are much deeper, approaching −40 kJ mol−1; moreover, different from F64 and F216, the most favorable minimum is the one at the shortest distance, featuring direct contact between the NPs, without lipids interposed.
Aggregation geometry depends on NP size
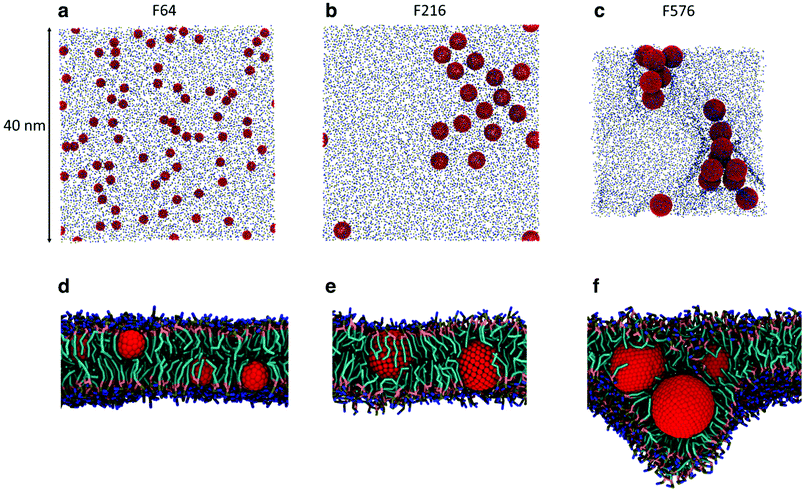
While the dimerization free energy profile gives information about the thermodynamics of aggregation, unbiased simulations allow the study of aggregation on a larger scale, and analysis of the geometric arrangement of the nanoparticles within an aggregate. For each NP size we simulated systems with flat, tensionless membranes and two different box sizes, to probe finite size effects; moreover, we used two different mass concentrations of NPs in the bilayer (see Methods).First of all, when using a starting configuration with NPs dispersed in the water phase, all NPs partitioned favorably inside the membrane on time scales increasing with NP size but never exceeding a few hundred nanoseconds. This is expected, given the hydrophobic nature of NP surfaces, and matches previous results on small fullerenes.18,25,26 Once in the membrane, F64 distributed homogeneously (Fig. 2a), as previously observed for F16.18 Only a few dimers formed during the simulations, and they always dissolved in less than 50 ns. F64 molecules did not lie in the center of the membrane, and their center of mass was typically located about 1.2 nm away from the membrane midplane, as reported for F16.18 As the size of F64 allows it, two fullerenes can share similar xy coordinates, while residing in opposite leaflets (Fig. 2d).
F216 showed a tendency to form linear aggregates (Fig. 2b), which we will analyze more thoroughly later. Also in this case, the NP preferential location was not at the center of the membrane, but displaced towards the headgroups by about 0.8 nm. As the diameter of F216 is 3.2 nm, localization off the membrane center implies that the NPs expose some of their hydrophobic surface to water (Fig. 2e), and a single NP occupies both leaflets at the same time.
Different from the other NPs, F576 clustered in a three-dimensional aggregate as soon as they entered the bilayer; these clusters were stable throughout the simulations, and they heavily deformed the membrane (Fig. 2f), without causing holes or topological changes in the membrane.
In all the aggregates described above (dimers for F64, chains for F216, and 3D aggregates for F576), one or more lipids intercalated between the NPs; NPs were found in direct contact (first minimum of the profiles) only when they had aggregated before entering the membrane. In Fig. 2f we show that three F576 NPs are not in direct contact, but their interaction is mediated by the presence of two layers of lipid chains. These configurations correspond to the second or third minimum in the dimerization profiles (Fig. 1).
Distribution along the membrane normal also depends on NP size
To better understand the preferential location of NPs off the membrane midplane, we calculated free energy profiles as a function of the distance between a NP and the centre of the bilayer. The profile for F16 was shown in our previous publication.24 The profiles for F64 and F216 and are shown in Fig. 3. The profile for F64 confirms that the most favourable position within the membrane is about 1.1 nm away from the membrane midplane. The position at the centre of the membrane corresponds to a maximum in the free energy, about 15 kJ mol−1 (6kBT) higher than the minimum. The most favourable position for F216 is 0.85 nm away from the membrane center. A small barrier (2kBT) separates this minimum from the position at the centre of the membrane, which is a metastable minimum. This picture is consistent with the observation (in unbiased simulations) of NPs spontaneous switching from a leaflet to the other.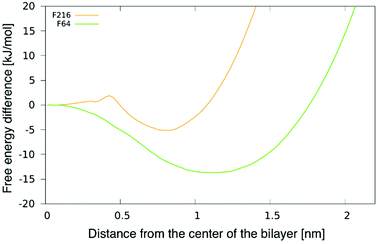 | ||
| Fig. 3 Potential of mean force (PMF) for F64 and F216 as a function of the distance from the center of a POPC membrane. | ||
We notice here that, due to the coarse-grained nature of our model, we do not expect that our PMF results match quantitatively the free energy profile for any realistic NP. Yet, nanoparticle localization off the membrane midplane has been reported before from atomistic simulations of C60 fullerene,24,38 hence a qualitative agreement is expected between our CG models and more realistic atomistic models. We also notice that the NP preferential localization off the membrane midplane has been ascribed to the high particle density on the NP surface, allowing a high number of solute–solvent dispersion interactions in region of high particle density in the membrane – far from the membrane midplane, that has the lowest particle density.24,38
F216 forms linear aggregates
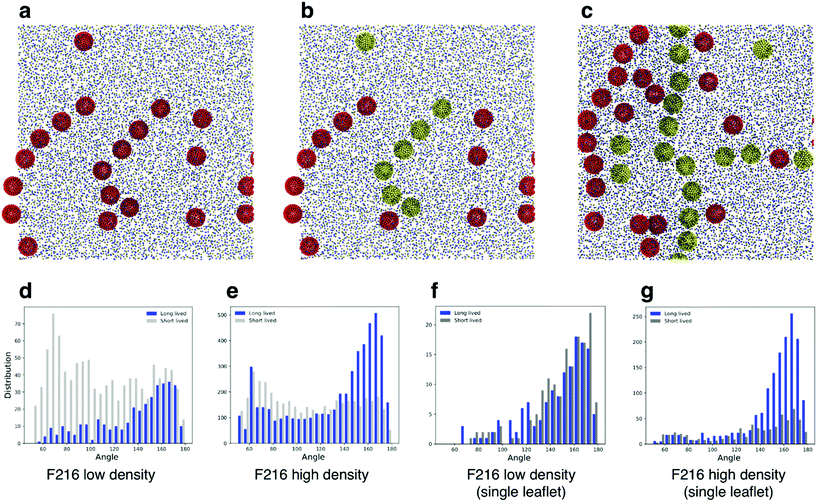
Simulations of flat, tensionless membranes suggested that F216 spontaneously forms linear aggregates. In order to characterize more quantitatively this behavior, we extended the sampling using a larger membrane patch (40 nm in lateral size, 4608 POPC lipids, flat geometry) and longer simulation time (40 μs, see Table 3). We observed the formation of linear aggregates at two different concentrations (18 and 36 NPs in the membrane): at lower concentration, F216 NPs formed chains of up to seven molecules (Fig. 4a); at higher concentration, linear aggregates spanned the whole simulation box (Fig. 4c). Deviations from the initially flat membrane geometry appeared in all simulations with linear aggregates, and were particularly significant in the case of large membranes and high NP concentration (Fig. 5a).| NP | Number of NPs | Box size [nm] | Mass fraction [NP/lipid] | Time [μs] |
|---|---|---|---|---|
| F16 | 64 | 20 | 0.07 | 20 |
| F16 | 121 | 20 | 0.13 | 20 |
| F64 | 36 | 20 | 0.15 | 15 |
| F64 | 72 | 40 | 0.08 | 20 |
| F64 | 144 | 40 | 0.15 | 10 |
| F216 | 9 | 20 | 0.13 | 20 |
| F216 | 9 | 20 | 0.13 | 30 |
| F216 | 9 | 20 | 0.13 | 30 |
| F216 | 9 | 20 | 0.13 | 30 |
| F216 | 18 | 40 | 0.06 | 40 |
| F216 | 36 | 40 | 0.13 | 40 |
| F576 | 4 | 20 | 0.15 | 20 |
| F576 | 4 | 20 | 0.15 | 20 |
| F576 | 4 | 20 | 0.15 | 20 |
| F576 | 4 | 20 | 0.15 | 20 |
| F576 | 16 | 40 | 0.15 | 20 |
The NP chains were dynamic but maintained their identity for over a microsecond, at lower NP concentration, and even longer when they spanned the whole box. To quantify the preference for a linear arrangement, we analyzed the correlation between the shape of the aggregates and their stability. Every Δt = 100 ns, we performed the following steps:
• Identifying dimers: we considered that two NPs form a dimer when at most two lipid tails are interposed between their surfaces; to this end, we used as a threshold for the dimerization the position of the barrier between the third and the fourth minimum of the dimerization PMF;
• Identifying triplets: we considered that three NPs form a triplet when one NP forms a dimer with each of the other two NPs. For each triplet at each frame we calculated the angle using vectors defined by the center of mass of each molecule.
We classified triplets in two sets, that we defined as long lived (LL) and short lived (SL). LL triplets survived for a time longer than the typical diffusion time of fullerenes in the membrane, estimated at 250 ns (see the Methods section for details on the calculation of the diffusion coefficient). We then plotted the histogram of the triplet angles for both LL and SL triplets (Fig. 4d–g). We observed that at both concentrations, the LL angle distribution is peaked at large angles, confirming a preference for linear aggregates – independent of membrane geometry (mostly flat at low NP concentration, and deformed out of plane at high NP concentration).
As shown earlier (Fig. 2e and 3), F216 is located off the membrane midplane, and NPs are distributed almost equally between the top and the bottom leaflet of the lipid bilayer. We analyzed the geometry of triplets separately on the two subsets of NPs found in the top and bottom leaflets of the membrane. Linear aggregates of F216 form exclusively between NPs in the same leaflet (Fig. 4c–g). Triplets formed by NPs residing in the same leaflets live longer than triplets containing NPs spanning both leaflets (Fig. 4f–g). Moreover, the distribution of angles of intra-leaflet triplets shows a larger fraction of linear aggregation (Fig. 4g). In conclusion, our analysis confirms that F216 NPs has a clear tendency towards linear aggregation, particularly strong for NPs localized in the same bilayer leaflet.
Correlation between membrane undulations and linear aggregation
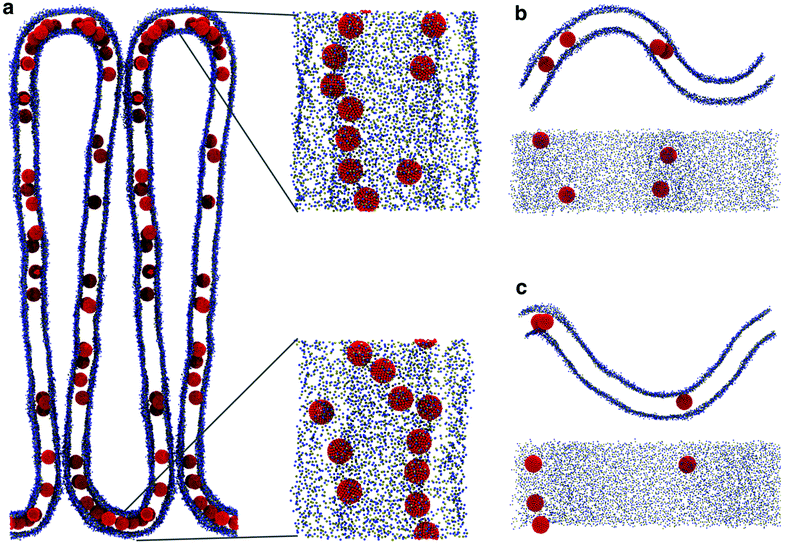
All simulations with linear aggregation of F216 NPs show some deformations of the lipid membrane; deformations are small for small bilayer membranes (20 nm in lateral size) but very significant for large membranes (40 nm in lateral size) at high NP concentration. In the latter case, linear aggregates localize in regions of high membrane curvature (Fig. 5a); the membrane bends along the linear aggregate, and it is convex on the side of the leaflet containing the NPs.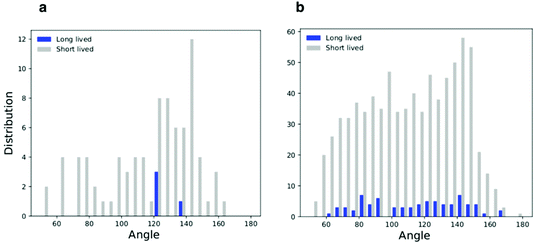 | ||
| Fig. 6 Histograms of the triplets angle distribution for the flat membrane simulations; (a) low density system and (b) high density system. | ||
| F216 number | Monomer fraction | |
|---|---|---|
| Unbiased | Flat membrane | |
| 18 | 0.53 | 0.75 |
| 36 | 0.25 | 0.52 |
| Model | Fullerene number | Membrane size [nm] | Mass fraction [full/lipid] | Time [μs] |
|---|---|---|---|---|
| F216 | 56 | 80 | 0.05 | 2.5 |
| F216 | 56 | 80 | 0.05 | 2.5 |
| F216 | 28 | 80 | 0.05 | 2.5 |
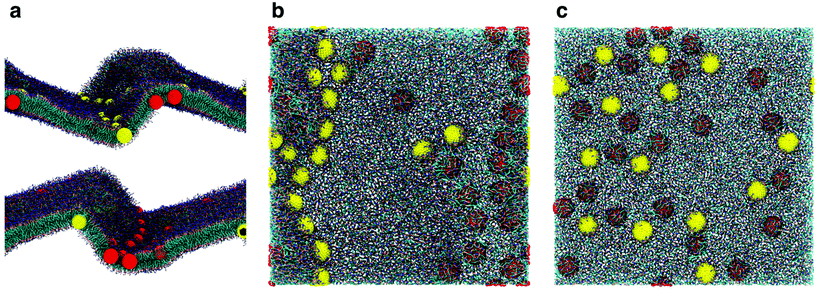
The presence of NPs caused a remarkable buckling of the membrane (Fig. 7a) in all simulations, irrespective of the NP density and the initial NP placement in the membrane. The buckling started already at the beginning of the simulation, the final configuration was reached in about 800 ns and remained stable throughout the simulation (2.5 μs). When the system reached the final configuration (after about 1 μs), the linear aggregates concentrated in the high curvature region and grew more populated and stable compared to the ones in the flat region (Fig. 7a). These simulations strongly suggest that F216 nanoparticles are capable of inducing membrane curvature.
We remark that, both in curvature-sensing and in curvature-inducing conditions (i.e., at low and high NP concentration, respectively), NPs are always found in the convex leaflet (Fig. 5a). The mechanisms for sensing and inducing curvature appear to depend simply on (a) the minimization of mechanical stress within the membrane, inducing the membrane to curve in the direction that reduces the area mismatch between the leaflets, and (b) on the preferential localization of the NPs away from the mid plane of the bilayer membrane (Fig. 3), in turn due to the higher number density of the membrane close to the interface region, resulting in stronger dispersion interactions between NPs and the lipids.18,38 Our results suggest that any membrane-embedded NP localized away from the center of the bilayer may exhibit analogous curvature-sensing and curvature-inducing behavior.
Conclusions
In the present work we carried out molecular simulations of POPC lipid membranes in the presence of approximately spherical, hydrophobic nanoparticles of different size, with a diameter ranging between 1 nm and 5 nm, comparable to the membrane thickness. We calculated PMFs for NP dimers, giving information on the probability of dimerization as a function of NP size. While the smallest NPs show little tendency to aggregate, such tendency increases with NP size, and is particularly strong in the case of the largest NPs, whose size is slightly larger than membrane thickness. Unbiased simulations show that only F216, of intermediate size (2.88 nm in diameter), prefers to aggregate in a linear geometry – similarly to larger hydrophilic NPs adsorbed onto membranes.10,11 Linear aggregation appears to be correlated with membrane curvature: indeed no linear aggregation is observed when membrane undulations are suppressed, while stable linear aggregates are formed in curved membranes, and they are localized in the regions of high curvature. Large-scale simulations show that a sufficiently high concentration of NPs is capable of inducing massive, stable membrane folds, suggesting that even spherically symmetric NPs, sitting off the membrane midplane, can both sense membrane curvature (at low NP concentration) and induce it (at high NP concentration), similarly to proteins.39,40Conflicts of interest
There are no conflicts to declare.Acknowledgements
JB acknowledges funding from the TOP grant of SJ Marrink (NWO) and the EPSRC program grant EP/P021123/1. LM acknowledges funding from the Institut national de la santé et de la recherche médicale (INSERM). Calculations were carried out at the French supercomputing center CINES (Grant A0060710138). GR acknowledges funding from the ERC Starting Grant BioMNP 677513.References
- E. M. Hotze, T. Phenrat and G. V. Lowry, J. Environ. Qual., 2010, 39, 1909–1924 CrossRef CAS PubMed.
- A. Albanese and W. C. W. Chan, ACS Nano, 2011, 5, 5478–5489 CrossRef CAS PubMed.
- D. L. Parton, J. W. Klingelhoefer and M. S. P. Sansom, Biophys. J., 2011, 101, 691–699 CrossRef CAS PubMed.
- L. Johannes, W. Pezeshkian, J. H. Ipsen and J. C. Shillcock, Trends Cell Biol., 2018, 28, 405–415 CrossRef CAS PubMed.
- J. N. Israelachvili, Intermolecular and Surface Forces, Academic Press, 2011 Search PubMed.
- S. Marcelja, Biophys. J., 1999, 76, 593–594 CrossRef CAS PubMed.
- K. Bohinc, V. Kralj-Iglič and S. May, J. Chem. Phys., 2003, 119, 7435–7444 CrossRef CAS.
- P. G. Dommersnes and J. B. Fournier, Eur. Phys. J. B, 1999, 12, 9–12 CrossRef CAS.
- B. J. Reynwar, G. Illya, V. A. Harmandaris, M. M. Müller, K. Kremer and M. Deserno, Nature, 2007, 447, 461–464 CrossRef CAS PubMed.
- A. D. Olinger, E. J. Spangler, P. B. S. Kumar and M. Laradji, Faraday Discuss., 2016, 186, 265–275 RSC.
- A. Šarić and A. Cacciuto, Phys. Rev. Lett., 2012, 108, 118101 CrossRef PubMed.
- C. van der Wel, A. Vahid, A. Šarić, T. Idema, D. Heinrich and D. J. Kraft, Sci. Rep., 2016, 6, 32825 CrossRef CAS PubMed.
- E. J. Spangler, P. B. S. Kumar and M. Laradji, Soft Matter, 2018, 14, 5019–5030 RSC.
- A. Vahid, A. Šarić and T. Idema, Soft Matter, 2017, 13, 4924–4930 RSC.
- A. Šarić and A. Cacciuto, Soft Matter, 2013, 9, 6677–6695 RSC.
- A.-F. Bitbol, D. Constantin and J.-B. Fournier, in Physics of Biological Membranes, ed. P. Bassereau and P. Sens, Springer International Publishing, Cham, 2018, pp. 311–350, DOI:10.1007/978-3-030-00630-3_13.
- A. Šarić and A. Cacciuto, Phys. Rev. Lett., 2012, 109, 188101 CrossRef PubMed.
- J. Barnoud, G. Rossi and L. Monticelli, Phys. Rev. Lett., 2014, 112, 068102 CrossRef PubMed.
- N. Castillo, L. Monticelli, J. Barnoud and D. P. Tieleman, Chem. Phys. Lipids, 2013, 169, 95–105 CrossRef CAS PubMed.
- X. Periole, T. Huber, S. J. Marrink and T. P. Sakmar, J. Am. Chem. Soc., 2007, 129, 10126–10132 CrossRef CAS PubMed.
- J. Yoo and Q. Cui, Biophys. J., 2013, 104, 128–138 CrossRef CAS PubMed.
- R. C. Van Lehn, P. U. Atukorale, R. P. Carney, Y.-S. Yang, F. Stellacci, D. J. Irvine and A. Alexander-Katz, Nano Lett., 2013, 13, 4060–4067 CrossRef CAS PubMed.
- C. C. Chiu, R. DeVane, M. L. Klein, W. Shinoda, P. B. Moore and S. O. Nielsen, J. Phys. Chem. B, 2010, 114, 6394–6400 CrossRef CAS PubMed.
- L. Monticelli, J. Chem. Theory Comput., 2012, 8, 1370–1378 CrossRef CAS PubMed.
- G. Rossi, J. Barnoud and L. Monticelli, Phys. Scr., 2013, 87, 058503 CrossRef.
- J. Wong-Ekkabut, S. Baoukina, W. Triampo, I. M. Tang, D. P. Tieleman and L. Monticelli, Nat. Nanotechnol., 2008, 3, 363–368 CrossRef CAS PubMed.
- S. J. Marrink, H. J. Risselada, S. Yefimov, D. P. Tieleman and A. H. de Vries, J. Phys. Chem. B, 2007, 111, 7812–7824 CrossRef CAS PubMed.
- L. Monticelli, S. K. Kandasamy, X. Periole, R. G. Larson, D. P. Tieleman and S. J. Marrink, J. Chem. Theory Comput., 2008, 4, 819–834 CrossRef CAS PubMed.
- S. J. Marrink and D. P. Tieleman, Chem. Soc. Rev., 2013, 42, 6801–6822 RSC.
- G. Bussi, D. Donadio and M. Parrinello, J. Chem. Phys., 2007, 126, 014101 CrossRef PubMed.
- H. J. C. Berendsen, J. P. M. Postma, W. F. van Gunsteren, A. di Nola and J. R. Haak, J. Chem. Phys., 1984, 81, 3684–3690 CrossRef CAS.
- M. Parrinello and A. Rahman, J. Appl. Phys., 1981, 52, 7182–7190 CrossRef CAS.
- B. Hess, C. Kutzner, D. van der Spoel and E. Lindahl, J. Chem. Theory Comput., 2008, 4, 435–447 CrossRef CAS PubMed.
- M. J. Abraham, T. Murtola, R. Schulz, S. Páll, J. C. Smith, B. Hess and E. Lindahl, SoftwareX, 2015, 1–2, 19–25 CrossRef.
- G. M. Torrie and J. P. Valleau, J. Comp. Phys., 1977, 23, 187–199 CrossRef.
- S. Kumar, D. Bouzida, R. H. Swendsen, P. A. Kollman and J. M. Rosenberg, J. Comput. Chem., 1992, 13, 1011–1021 CrossRef CAS.
- J. S. Hub, B. L. de Groot and D. van der Spoel, J. Chem. Theory Comput., 2010, 6, 3713–3720 CrossRef CAS.
- L. W. Li, H. Davande, D. Bedrov and G. D. Smith, J. Phys. Chem. B, 2007, 111, 4067–4072 CrossRef CAS PubMed.
- T. Baumgart, B. R. Capraro, C. Zhu and S. L. Das, Annu. Rev. Phys. Chem., 2011, 62, 483–506 CrossRef CAS PubMed.
- M. Simunovic, G. A. Voth, A. Callan-Jones and P. Bassereau, Trends Cell Biol., 2015, 25, 780–792 CrossRef CAS PubMed.
- J. Agudo-Canalejo and R. Lipowsky, Soft Matter, 2017, 13, 2155–2173 RSC.
Footnote |
| † Current address: Intangible Realities Laboratory, University of Bristol, School of Chemistry, Cantock's Close, Bristol BS8 1TS, UK. |
| This journal is © The Royal Society of Chemistry 2020 |


