 Open Access Article
Creative Commons Attribution 3.0 Unported Licence
Atomic-level separation of thiolate-protected metal clusters
Yuichi
Negishi
 *ab,
Sayaka
Hashimoto
a,
Ayano
Ebina
a,
Kota
Hamada
a,
Sakiat
Hossain
 a and
Tokuhisa
Kawawaki
 ab
ab
aDepartment of Applied Chemistry, Faculty of Science, Tokyo University of Science, 1-3 Kagurazaka, Shinjuku-ku, Tokyo 162-8601, Japan. E-mail: negishi@rs.tus.ac.jp; Fax: +81-3-5261-4631; Tel: +81-3-5228-9145
bResearch Institute for Science & Technology, Tokyo University of Science, 1-3 Kagurazaka, Shinjuku-ku, Tokyo 162-8601, Japan
First published on 24th February 2020
Abstract
Fine metal clusters have attracted much attention from the viewpoints of both basic and applied science for many years because of their unique physical/chemical properties and functions, which differ from those of bulk metals. Among these materials, thiolate (SR)-protected gold clusters (Aun(SR)m clusters) have been the most studied metal clusters since 2000 because of their ease of synthesis and handling. However, in the early 2000s, it was not easy to isolate these metal clusters. Therefore, high-resolution separation methods were explored, and several atomic-level separation methods, including polyacrylamide gel electrophoresis (PAGE), high-performance liquid chromatography (HPLC), and thin-layer chromatography (TLC), were successively established. These techniques have made it possible to isolate a series of Aun(SR)m clusters, and much knowledge has been obtained on the correlation between the chemical composition and fundamental properties such as the stability, electronic structure, and physical properties of Aun(SR)m clusters. In addition, these high-resolution separation techniques are now also frequently used to evaluate the distribution of the product and to track the reaction process. In this way, high-resolution separation techniques have played an essential role in the study of Aun(SR)m clusters. However, only a few reviews have focused on this work. This review focuses on PAGE, HPLC, and TLC separation techniques, which offer high resolution and repeatability, and summarizes previous studies on the high-resolution separation of Aun(SR)m and related clusters with the purpose of promoting a better understanding of the features and the utility of these techniques.
1. Introduction
Fine metal clusters smaller than ∼2 nm (≲100 atoms) exhibit different geometrical/electronic structures than those of bulk metals.1 Metal clusters often form a unique framework, such as an icosahedral structure, to suppress the surface energy instead of the close-packed structure often observed in bulk metals. In addition, metal clusters exhibit a discrete electronic structure unlike bulk metals. Because of these characteristic geometrical/electronic structures, fine metal clusters exhibit unique physical/chemical properties and functions that differ from those of bulk metals. In addition, the physical/chemical properties and functions of metal clusters vary significantly depending on the number of constituent atoms. For these reasons, fine metal clusters have attracted considerable attention for many years in the fields of both basic and applied science.For these metal clusters, it is essential to conduct investigations on metal clusters controlled with atomic precision to understand the structures and physical/chemical properties. For this purpose, gas-phase beam experiments are superior2–6 and they led the research studies on metal clusters in the 1980s and the 1990s. Many unique characteristics of metal clusters were discovered during this period by observing the mass distributions and electronic structures in gas-phase beam experiments. In parallel with such physical experiments, the research on the synthesis of phosphine (PR3)-protected metal clusters was also actively pursued during this period.7–15 The main purpose of these studies was to reveal the correlation between the chemical composition and geometrical structure, and the geometrical structures of some PR3-protected metal clusters were determined by single-crystal X-ray diffraction (SC-XRD) at that time. Regarding the thiolate (SR)-protected metal clusters described below, the geometrical structure was first determined by SC-XRD in 2007; thus, the development of the research studies on PR3-protected metal clusters at that time was remarkable. Since 2000, nanotechnology has been adopted as a national policy in many countries, and the main target metal clusters have shifted to SR-protected gold clusters (Aun(SR)m clusters).16–33 Aun(SR)m clusters can be synthesized by simply mixing reagents in a solvent in air. Furthermore, Aun(SR)m clusters are stable both in solution and in the solid state because the SR group forms a strong bond with Au. Such Aun(SR)m clusters have a low threshold even for researchers who have not worked on metal cluster synthesis and show great potential for material applications. It is presumed that these factors are largely related to the explosive increase in the number of studies on Aun(SR)m clusters since 2000.20
However, for Aun(SR)m clusters, single crystallization techniques could not be found, and thus, they could not be isolated in the early stage. Then, high-resolution separation techniques were developed to isolate Aun(SR)m clusters. In earlier studies, separation techniques that relied on the differences in the solubility of solvents were mainly used.34–38 Then, atomic-level separation techniques, such as polyacrylamide gel electrophoresis (PAGE) and liquid chromatography (LC) were developed. These methods made it possible to isolate a series of Aun(SR)m clusters and obtain knowledge on the correlation between the chemical composition and the fundamental properties (e.g., stability,39,40 electronic structure,41 and physical/chemical properties42,43) of Aun(SR)m clusters. After these separation techniques were established, the experimental conditions for synthesizing only stable metal clusters were also determined by using the features of their optical absorption spectra. As a result, several methods were established for selectively synthesizing stable Aun(SR)m clusters with atomic precision.24,44 In addition, because crystallization was easier for isolated or selectively synthesized Aun(SR)m clusters, the geometrical structures were also determined by SC-XRD for several Aun(SR)m clusters.45 In parallel with these studies, studies on the application of these precisely controlled Aun(SR)m and related clusters for chemical sensors,46,47 photosensitization,48 catalysts,49,50 and solar cells51,52 were conducted.53
Thus, high-resolution separation techniques have played an extremely important role in the study of Aun(SR)m clusters. Recently, some stable metal clusters can be synthesized with atomic precision.24,44 However, not all clusters can currently be synthesized size-selectively. Thus, the use of high-resolution separation techniques remains indispensable for understanding the correlation between the chemical composition and structure/physical properties of SR-protected metal clusters. Moreover, these separation techniques are also needed for purification of the main products and for isolation of metastable species. In addition to the use for fractionation as described above, these separation techniques are also often used to evaluate the distribution of a product and to track the reaction. Despite their importance, few reviews have focused on these techniques in the study of Aun(SR)m clusters.54
This review summarizes research on the high-resolution separation of Aun(SR)m and related clusters. In particular, we describe previous studies on PAGE, high-performance LC (HPLC), and thin-layer chromatography (TLC), which are separation techniques with high resolution and repeatability. The aim of this review is to provide a deep understanding of the features and usefulness of the three separation techniques through past research. The following section outlines the basic principles and experimental methods of PAGE, HPLC, and TLC. Then, in section 3, we briefly describe the previous high-resolution separation methods that were used before the appearance of these three techniques. Next, sections 4 to 6 outline previous studies on PAGE, HPLC, and TLC, respectively. Finally, section 7 summarizes the review and briefly describes future expectations.
2. Principles and procedure of each separation technique
2.1. Polyacrylamide gel electrophoresis
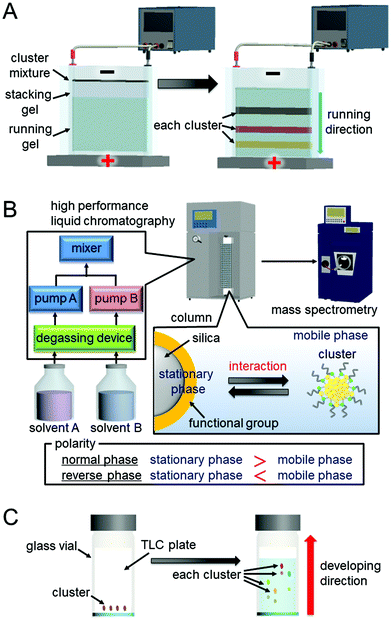
When a direct current flows through a solution, the charged sample in the solution moves in the direction of the oppositely charged electrode. A method of separating a substance based on this principle is called electrophoresis. In PAGE, substances move in a three-dimensional network consisting of polyacrylamide gel. Each metal cluster can be separated by this method because the mobility of the clusters differs depending on the charge, particle size, and shape. PAGE is generally used for the separation of hydrophilic Aun(SR)m and its related clusters containing a ligand with a dissociable functional group.In the experiment, first, a polyacrylamide-gel running layer is prepared between two plates using acrylamide and bis(acrylamide). Then, a polyacrylamide-gel stacking layer is prepared using acrylamide and bis(acrylamide) with a different concentration than that of the running layer. A sample solution containing several percent of glycerol is dropped on the upper end of the gel. Then, electrophoresis is performed by applying a voltage to the electrodes placed on the upper and lower sides of the gel. Each cluster is separated into several bands (Fig. 1A). Bands containing each metal cluster are cut out using a utility knife, and the clusters are eluted from the gel by leaving them in water and collecting them from the solution.
The device for PAGE is simple and inexpensive (Fig. 1A). In addition, when the cluster mixture is separated by PAGE, the separation of each component cluster can be visually confirmed. It is also possible to specify luminescent clusters by ultraviolet light irradiation. Moreover, PAGE is also useful for evaluating the product size and shape because the mobility of each metal cluster varies depending on the particle size and shape as well as the charge and the interaction with the solvent.
2.2. Liquid chromatography
Chromatography is a method used to separate a sample based on the difference in the extent of the interaction between the sample and the stationary phase. When the mobile phase is liquid, the technique is called LC.The general HPLC system used for such separation consists of a mobile-phase solvent reservoir, a degasser device, a high-pressure liquid pump, an injector, a column, and a detector (Fig. 1B). There are two types of mobile phases, one using a single mobile phase and the other using multiple types of mobile-phase solvents while arbitrarily changing their volume ratio. The first method is called the isocratic mode, and the second method is called the gradient mode. In general, a column is produced by filling a stainless-steel tube with a particulate stationary phase (column filler) at high pressure and sealing its upper and lower ends with a sintered porous stainless filter. Silica gel particles with surfaces modified by an organic layer are often used as the column filler (Fig. 1B).
HPLC has advantages of resolution and repeatability. There is also the advantage that electrospray ionization (ESI) mass spectrometry (MS) can be used for the detection. As opposed to separation by PAGE, when the HPLC apparatus and ESI mass spectrometer are directly connected (LC/MS), all the generated clusters can be directly led to the MS section. Thus, it is possible to determine the chemical composition of very minor components that cannot be detected by PAGE.
In the experiment, the solution containing the sample is spotted 15 to 25 mm above the lower end of the TLC plate using a micropipette or a capillary tube. After drying the sample, the plate is allowed to stand with the spot facing down in a sealed container with a solvent (the mobile phase). The sample is separated by rising of the solvent from the lower side via capillary action (Fig. 1C). The band containing each Aun(SR)m cluster is cut out with a spatula, and each Aun(SR)m cluster is collected from the plate.
With TLC, it is difficult to achieve the same degree of resolution as HPLC. However, TLC is a less expensive and it uses simpler experimental apparatus than HPLC. Therefore, when the distances that each Aun(SR)m cluster travel on the plate are significantly different, the target Aun(SR)m cluster can be easily and inexpensively isolated using this method. It is also one of the advantages of this method that the separation of Aun(SR)m clusters can be visually confirmed, as for PAGE.
3. Early studies on separation
Many attempts were made to separate Aun(SR)m clusters based on the number of constituent atoms before the use of the above three methods (PAGE, HPLC, and TLC).34–38 For example, Whetten et al. synthesized Aun(SClH2l+1)m clusters (SClH2l+1 = alkanethiolate) as a ligand. They gradually added a poor solvent and precipitated clusters from large to small in order.35 In these studies, each separated Aun(SClH2l+1)m cluster was evaluated mainly using matrix-assisted laser desorption/ionization (MALDI)-MS. In the mass spectrum of each Aun(SClH2l+1)m cluster, ion peaks appeared in different mass regions (Fig. 2A), which indicated that the Aun(SClH2l+1)m clusters were separated based on their size. Unfortunately, these mass spectra included only the fragmentation peaks of each Aun(SClH2l+1)m cluster.38 Therefore, the chemical composition of each Aun(SClH2l+1)m cluster was not accurately determined at this stage. Murray et al. also separated Aun(SR)m clusters (SR = SClH2l+1 or SC2H4Ph; SC2H4Ph = phenylethanethiolate) using solvent-selective extraction.55 Although this method has been revealed to be useful for obtaining each stable Aun(SR)m cluster at atomic resolution in the later studies56–58 and thereby often used for the isolation of Aun(SR)m clusters in large quantities in recent studies,59–63 unfortunately, the separated Aun(SR)m clusters could not be confirmed to be isolated at atomic resolution at this stage. However, these studies provided considerable information on the correlation between the particle size and electronic structure in the Aun(SR)m clusters (Fig. 2B).34–38 Since then, the separation technique for Aun(SR)m clusters has progressed rapidly with the introduction of separation methods offering high resolution and repeatability and the improvement of mass spectrometers. | ||
| Fig. 2 (A) MALDI mass spectra of Aun(SClH2l+1)m clusters with different core sizes (l = 6, 12, or 18); (a) 8, (b) 14, (c) 22, (d) 28, and (e) 34–38 kDa clusters. (f) Crude sample of Aun(SC12H25)m clusters. (B) Optical absorption spectra of Aun(SClH2l+1)m clusters with different core sizes: (bottom to top) 8, 14, 22, 28, and 34–40 kDa clusters. Reproduced with permission from ref. 35. Copyright 1997 American Chemical Society. | ||
4. PAGE separation
4.1. PAGE separation for isolation
PAGE was first applied to separate Aun(SR)m clusters in 1998. Schaaf and Whetten et al. separated Aun(SG)m clusters (SG = glutathionate) into multiple bands using PAGE (Fig. 3A).64 For the separation, they made gels in higher concentration (∼40%) than the gels used in protein separations. This optimization of the gel concentration led to the high-resolution separation of Aun(SG)m clusters (Fig. 3B). They also measured the Aun(SG)m clusters in each band using MALDI-MS and ESI-MS. However, these measurements did not provide mass spectra with a high signal/noise (S/N) ratio. Therefore, at this stage, the chemical composition of each separated Aun(SG)m cluster had not been accurately determined.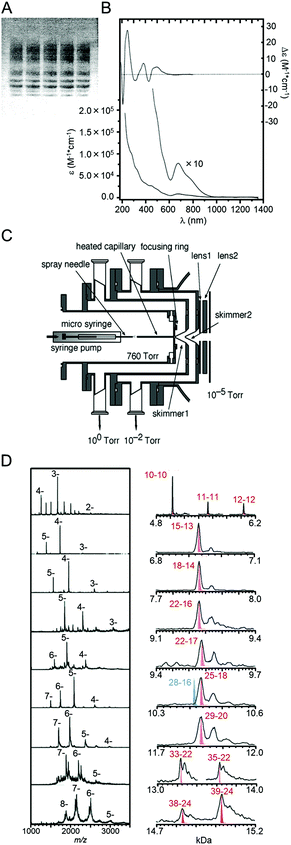 | ||
| Fig. 3 (A) PAGE separation of Aun(SG)m clusters and (B) optical absorption spectra of the main product in the sample in (A) from an early study.64 (C) ESI source constructed in the study of ref. 41. (D) ESI mass spectrum of each fraction separated by PAGE.41 Reproduced with permission from ref. 64 and 41. Copyright 1998 American Chemical Society and Copyright 2005 American Chemical Society. | ||
Later, Negishi and Tsukuda et al. demonstrated that this method could be used to separate a mixture into each Aun(SG)m cluster with atomic precision.41,65 They evaluated the chemical compositions of the Aun(SG)m cluster contained in each band using their homemade ESI mass spectrometer. Using their homemade apparatus, an ionized solvent containing Aun(SG)m clusters could be efficiently introduced into the mass spectrometer (Fig. 3C).41,65 As a result, a high S/N ratio was achieved in the mass spectra, and the separated Aun(SG)m clusters were assigned as Au10–12(SG)10–12, Au15(SG)13, Au18(SG)14, Au22(SG)16, Au22(SG)17, Au25(SG)18, Au29(SG)20, Au33(SG)22, and Au39(SG)24, respectively (Fig. 3D). This study also clarified that Au25(SG)18 is especially stable.65 Stable clusters with similar absorption spectra had previously been reported by Whetten et al. and Murray et al.66,67 This study revealed that the exact chemical composition of these clusters was Au25(SR)18.
For the Aun(SG)m clusters, Kimura et al. and Dass et al. separated larger-sized clusters up to Au∼56(SG)∼29 and Au43(SG)26, respectively.68,69 In Dass's study, the chemical composition of each cluster was determined using a commercially available mass spectrometer.69 The detection sensitivity of commercial apparatuses has improved, and in research since 2008, the chemical composition of separated clusters has been evaluated using commercial rather than homemade apparatuses.
The isolation of Aun(SG)m clusters with atomic precision enabled a deep understanding of the stability, structure, and other properties of Aun(SG)m clusters to be obtained. Tsukuda and Teranishi et al. showed that a series of Aun(SG)m clusters exhibited especially high stability against etching using excess thiol (Fig. 4A)39 and that Au25(SG)18 could be selectively synthesized in a solution where etching is likely to occur.44 Kojima and Tsukuda et al. experimentally demonstrated using 197Au Mössbauer spectroscopy that Aun(SR)m clusters have a geometrical structure in which a Au core is covered by Au(I)–SR oligomers (Fig. 4B), which had been predicted by density functional theory (DFT) calculations.70 Tsukuda and Yokoyama et al. showed that fine Aun(SG)m clusters could exhibit magnetism using X-ray magnetic circular dichroism (XMCD) spectrometry (Fig. 4C).42 Unfortunately, the interpretations in these studies were not necessarily accurate. The exact geometrical structure of Au25(SC2H4Ph)18 was later determined using SC-XRD by Murray et al. and Jin et al., independently.56,71 Jin et al. clarified the exact origin of the magnetism using electron spin resonance spectroscopy.72 However, studies on a series of isolated Aun(SG)m clusters by Tsukuda et al. have provided many new insights into the stability, electronic/geometrical structures, and other properties of Aun(SR)m clusters. These findings further demonstrate that it is essential to conduct research on fine metal clusters with controlled chemical composition to elucidate their fundamental properties.
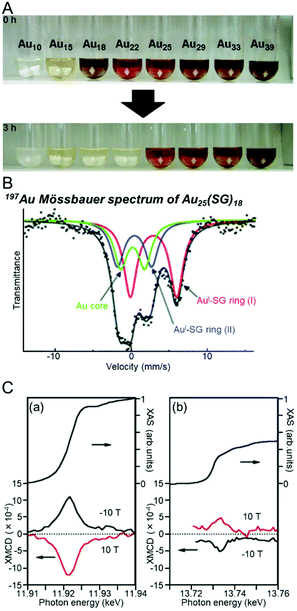 | ||
| Fig. 4 (A) Photographs of a series of Aun(SG)m cluster aqueous solutions (n = 10, 15, 18, 22, 25, 29, 33, and 39) before and after a 3 h etching reaction.39 (B) Mössbauer spectrum of Au25(SG)18.70 (C) X-ray absorption spectra (top) and XMCD (bottom) spectra of Au18(SG)14 at the (a) Au L3 and (b) Au L2 edges with an applied magnetic field of 10 T at 2.7 K.42 Reproduced with permission from ref. 39, 70 and 42. Copyright 2007 Wiley-VCH, Copyright 2007 American Chemical Society, and Copyright 2006 American Chemical Society. | ||
Separation using PAGE has also been applied for the isolation of Aun(SR)m clusters protected with other hydrophilic ligands. Negishi and Tsukuda et al. separated tiopronin (S(PG))- or mercaptosuccinic acid (S(SA))-protected Au clusters using PAGE (Fig. 5A).73 They showed that the chemical compositions of the isolated Aun(SR)m clusters differed depending on the ligand structure by comparing the chemical compositions of Aun(S(PG))m, Aun(S(SA))m, and Aun(SG)m clusters.73 Comparison of the optical absorption spectra of these clusters with the same chemical composition revealed that the electronic structure of Aun(SR)m clusters also changes depending on the ligand structure (Fig. 5B).73 Tsukuda et al. isolated Au25(S(PG))18 in high purity and obtained information on its geometrical structure in a later study.74 In addition, other hydrophilic Aun(SR)m clusters were separated using PAGE by Bürgi et al. (SR = N-isobutyl-cysteine)75,76 and Yao et al. (SR = penicillamine (Pen)77 and 3-mercaptophenyl-boronic acid78).
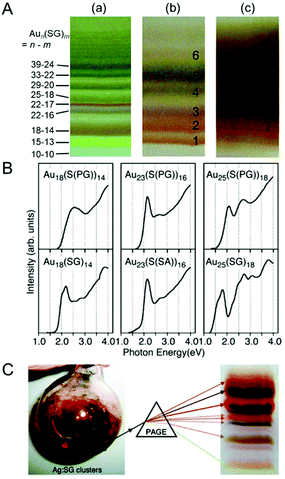 | ||
| Fig. 5 (A) PAGE separation of (a) Aun(SG)m, (b) Aun(S(PG))m, and (c) Aun(S(SA))m clusters.73 (B) Comparison of optical absorption spectra of Au18(SR)14, Au23(SR)16, and Au25(SR)18 with different ligand structures.73 (C) PAGE separation of Agn(SG)m clusters.79 Reproduced with permission from ref. 73 and 79. Copyright 2006 American Chemical Society and Copyright 2010 American Chemical Society. | ||
Separation using PAGE has also been applied for the isolation of other metal clusters. Bigioni et al. separated Agn(SG)m clusters using PAGE (Fig. 5C) and suggested that Agn(SG)m clusters could have a different chemical composition than Aun(SG)m clusters by comparing each gel.79 The main product of Agn(SG)m clusters was later determined to be Ag32(SG)19 by Griffith and Bigioni et al.,80 and this chemical composition actually cannot be observed for Aun(SG)m clusters.
Pradeep et al. separated Agn(SG)m clusters and showed that Ag32(SG)19 exhibits strong photoluminescence (PL).81 Yao and Kimura et al. separated Agn(D/L-Pen)m clusters and revealed that they have higher mobility than Aun(Pen)m clusters.82 They concluded that the mobility differences originated from the larger surface charge of the Agn(D/L-Pen)m clusters.82
In this way, it is possible to isolate SR-protected metal clusters composed of various ligands and metal elements with atomic precision using PAGE.83–101 By conducting research on a series of separated clusters, much knowledge has been obtained on the chemical composition and stability, electronic/geometrical structure, and physical properties of various SR-protected metal clusters.
4.2. PAGE separation for reaction control
In section 4.1, we introduced the isolation of metal clusters by PAGE. Meanwhile, fine metal clusters often exhibit a colour that depends on the number of constituent atoms. Thus, when they are separated by PAGE, the distribution of their chemical compositions can be confirmed visually. For this reason, PAGE is also often used to examine the distribution of chemical compositions of a product, optimize reaction conditions, elucidate the degraded processes, and track reactions.102–110For example, Tsukuda and Teranishi et al. observed that Au25(SG)18 was a major product when a triphenylphosphine (PPh3)-protected Au cluster was mixed with glutathione (GSH). They attempted to optimize the reaction conditions to selectively synthesize such a stable cluster with atomic precision. In this experiment, the distribution of the product under each experimental condition was first checked by PAGE separation (Fig. 6A)44 and then estimated by ESI-MS in the final stage. The results indicated that high-purity Au25(SG)18 was present in the product (Fig. 6B).44 Later, they mixed a series of Aun(SG)m clusters with GSH and traced the etching process using PAGE and discussed why Au25(SG)18 was selectively synthesized in the reaction between the PPh3-protected Au cluster and GSH.39
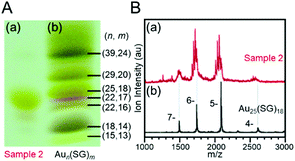 | ||
| Fig. 6 (A) PAGE photograph of (a) Au25(SG)18 obtained by size focusing (sample 2) and (b) a series of Aun(SG)m clusters. (B) Comparison of the ESI mass spectrum of (a) Au25(SG)18 obtained by size focusing and (b) Au25(SG)18 isolated by PAGE separation. The progression of the mass peaks in the spectrum of sample 2 results from the partial hydrolysis of the SG ligands. Reproduced with permission from ref. 44. Copyright 2005 American Chemical Society. | ||
Ackerson et al. synthesized Au102(p-MBA)44 (p-MBA = p-mercaptobenzoic acid) under different gas atmospheres and examined the distribution of products using PAGE. They observed that O2 was required as a gas for radical generation when using an organic solvent during the synthesis (Fig. 7A).111 They also showed that Au102(p-MBA)44 could be synthesized under an argon atmosphere by adding a radical initiator to the reaction vessel. Bigioni et al. observed the degradation process of Agn(SG)m clusters under various conditions (time, pH, presence or absence of salt, etc.) using PAGE. These studies revealed that the degradation of the Agn(SG)m clusters can be relatively suppressed by adjusting the pH of the solution to near neutral or by adding Ag+ ions into the solution.40 Bakr et al. demonstrated using PAGE that the structural changes between Ag35(SG)18 and Ag44(4-FTP)30 (4-FTP = 4-fluorothiophenolate) induced by ligand exchange are reversible (Fig. 7B).112 Xie et al. revealed that Au18(SG)14 could be produced as an intermediate in the synthesis of Au22(SG)18 with carbon monoxide (CO) reduction by monitoring the reaction using PAGE.113
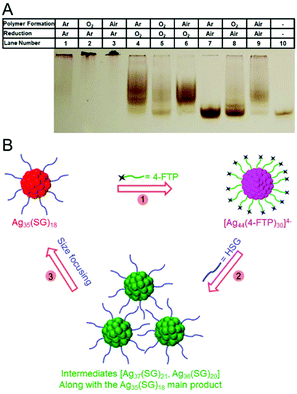 | ||
| Fig. 7 (A) Effect of atmosphere on Au102(p-MBA)44 synthesis. Crossover experiments showing the effect of oxygenated vs. inert atmosphere on the synthesis of Au102(p-MBA)44. Lane 10 is a sample of pure Au102(p-MBA)44 for reference. The PAGE conditions were 20% acrylamide at 125 V for 2 h.111 (B) Schematic illustration of reversible transformation (Steps 1–3) of Ag35(SG)18 into Ag44(4-FTP)30.112 Reproduced with permission from ref. 111 and 112. Copyright 2016 American Chemical Society. Copyright 2015 American Chemical Society. | ||
In this way, the use of PAGE enables the chemical composition distribution of the product to be clarified. Through the use of such PAGE separation, much knowledge has been obtained on appropriate synthesis conditions, stable conditions, and reaction mechanisms.
4.3. PAGE separation to identify luminescent cluster
Fine noble metal clusters often exhibit PL.114,115 Au and Ag are harmless elements, unlike cadmium and arsenic, which form compound semiconductors with strong emission.116 However, it is not easy to identify a metal cluster that emits PL with high quantum yield from a mixture. If the mixture is separated by PAGE and then the gel is irradiated with ultraviolet light, it is possible to visually identify the metal cluster exhibiting PL. Therefore, PAGE has often been utilized to identify luminescent metal clusters.Au22(SG)18, which emits red light with high quantum yield (∼8%), was identified by such PAGE separation.43 Xie et al. synthesized Aun(SG)m clusters using CO as the reduction agent and separated the mixture into each band using PAGE. The products were separated into four different Aun(SG)m clusters. Irradiation of the obtained gel with ultraviolet light revealed that Au22(SG)18, which has the lowest mobility, emits strong red PL (Fig. 8A). Based on the results of DFT calculation and X-ray absorption spectroscopy, they suggested that Au22(SG)18 has a geometrical structure in which the Au core is covered by a longer Au(I)–SG staple (RS–[Au–SR]n; n = 3, 4), which differs from the structure of other Aun(SG)m clusters. They concluded that Au22(SG)18 emits PL with high quantum yield because of the aggregation excitation emission effect caused by the long Au(I)–SG staple. Pradeep et al. succeeded in finding Ag7(S(SA))7 that emits red PL and Ag8(S(SA))8 that emits blue PL using PAGE separation (Fig. 8B).117
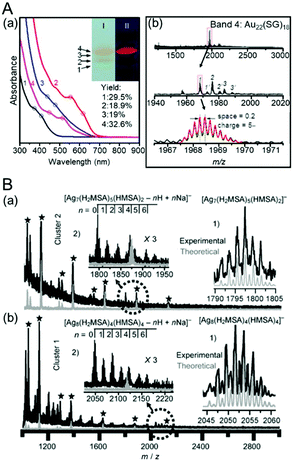 | ||
| Fig. 8 (A) (a) Optical absorbance spectra of Au NCs separated from bands 1–4 in native PAGE gel. The inset shows photographs of the PAGE separation (lane I) before and (lane II) after UV light irradiation. (b) ESI mass spectra of species 4. The red lines are the simulated isotope pattern of [Au22(SG)180–5H]5−.43 (B) Negative-ion MALDI (black) and LDI (gray) mass spectra of (a) Ag7(S(SA))7 and (b) Ag8(S(SA))8.117 Reproduced with permission from ref. 43 and 117. Copyright 2014 American Chemical Society and Copyright 2010 Wiley-VCH. | ||
4.4. PAGE separation for structural estimation
In PAGE separation, the mobility of each metal cluster depends on the particle size and shape as well as its charge and interaction with the solvent. Thus, there are several examples of the use of PAGE for structural and shape evaluation of Aun(SR)m clusters.Ackerson et al. synthesized Aun(p-MBA)m clusters with unknown size and estimated their chemical compositions from their PAGE mobility. In their study, they first ran Au102(p-MBA)44 and Au144(p-MBA)60 with known chemical composition through a gel and estimated the correlation between their mobility and chemical composition. Then, Aun(p-MBA)m clusters with unknown size were run through a gel at the same concentration, and the chemical composition was estimated to be Au∼230(p-MBA)∼88 from the mobility and the aforementioned correlation.118 Lehtovaara, Häkkinen, and Pettersson et al. demonstrated by PAGE separation that mixing Au102(p-MBA)44 or Au∼250(p-MBA)n with biphenyl-4,4′-dithiol causes ligand exchange, resulting in the multimerization of Au102(p-MBA)44 or Au∼250(p-MBA)n (Fig. 9).119
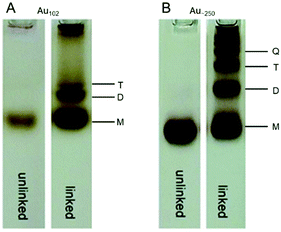 | ||
| Fig. 9 (A) and (B) PAGE bands of Au102(p-MBA)44 and Au∼250(p-MBA)n clusters and their linked multimers. Reproduced with permission from ref. 119. Copyright 2016 The Royal Society of Chemistry. | ||
4.5. Sodium dodecyl sulfate-PAGE separation
In the PAGE separation described thus far, not only the molecular weight of the cluster but also the charge state was reflected in the mobility. Therefore, to more accurately estimate the correlation between the chemical composition and mobility, it is necessary to exclude the effect of the charge state. Adding sodium dodecyl sulfate (SDS) to the sample solution and electrophoresis solution results in an almost constant charge-to-size ratio of the cluster, eliminating the effect of the charge state on the mobility. Such a SDS-PAGE solution is used in protein separation.120Cheng and Häkkinen et al. used SDS-PAGE for the separation of Aun(SR)m clusters.121 They replaced some ligands of Au102(p-MBA)44 with maleimide (C6MI) to bind Au102(p-MBA)44 efficiently to a nanocapsid. They confirmed using SDS-PAGE that the Au102(p-MBA)44−x(C6MI)x bound to the nanocapsid with higher efficiency than the unreacted Au102(p-MBA)44.
5. HPLC separation
As with PAGE, there have been many reports on the separation of Aun(SR)m and related clusters using HPLC.122–145 The main separation methods include RP partition chromatography, ion-pair chromatography, hydrophilic interaction liquid chromatography, size exclusion chromatography, and chiral chromatography (Fig. 10). In the following, research examples are introduced.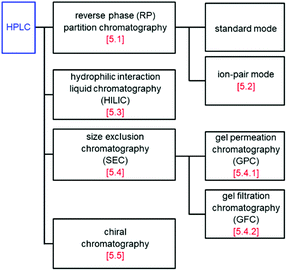 | ||
| Fig. 10 Classification of HPLC used in the study of SR-protected metal clusters. The number in square brackets is the section number. | ||
5.1. Reverse phase partition chromatography
RP partition chromatography provides ease of handling and has many stationary phases with a high number of theoretical plates. Furthermore, this method also facilitates the use of LC/MS because the mobile phase used in this chromatography technique is suitable for the ionization of the cluster in ESI-MS. Because of these advantages, more than 80% of HPLC analysis uses an RP column.In RP partition chromatography, the polarity of the stationary phase is lower than that of the mobile phase (Fig. 1B). Under this condition, the solute is in partition equilibrium between the stationary and mobile phases, and each solute is separated by a difference in the partition coefficient. In this chromatography method, silica gel supports chemically modified with an octadecyl group (C18), an octyl group (C8), a phenyl group (Ph), etc. are used as the stationary phase (Fig. 11A).
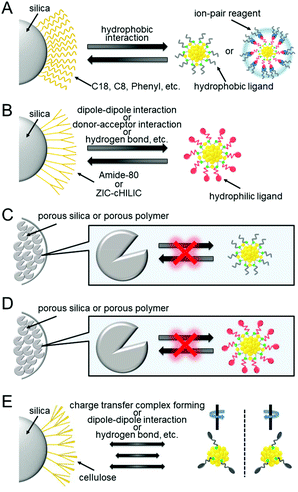 | ||
| Fig. 11 Schematic illustration of the solid phase used in each chromatography technique: (A) RP partition and ion-pair chromatography, (B) HILIC, (C) GPC, (D) GFC, and (E) chiral chromatography. | ||
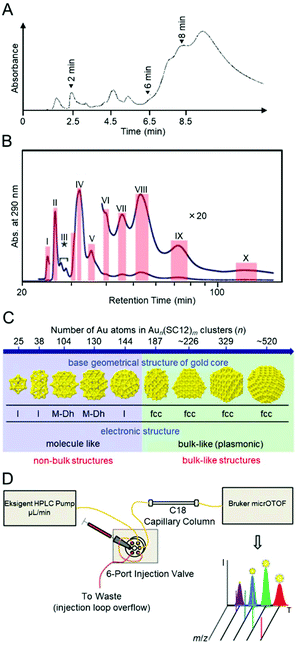 | ||
| Fig. 12 Separation of Aun(SR)m clusters by RP partition chromatography. (A) Chromatogram of the as-prepared Aun(SC6H13)m clusters obtained using a C8 column by the Murray group.146 (B) Chromatogram of the as-prepared Aun(SC12H25)m clusters obtained using two connected columns (C8 and Ph).154 (C) Critical size for emergence of non-bulk electronic and geometrical structures in Aun(SC12H25)m clusters elucidated by studies on a series of isolated Aun(SC12H25)m clusters.154 (D) Schematic illustration of capillary liquid chromatography mass spectrometry (LC/MS) used in the study of Aun(SC2H4Ph)m clusters.160 Reproduced with permission from ref. 146, 154, and 160. Copyright 2003 American Chemical Society, Copyright 2015 American Chemical Society, and Copyright 2016 American Chemical Society. | ||
Negishi et al. succeeded in separating a series of Aun(SC12H25)m clusters (SC12H25 = dodecanethiolate) depending on the number of constituent atoms using such a connected column. Four distinct peaks were observed in the chromatogram, corresponding to Au102(SC12H25)44, Au130(SC12H25)50, Au144(SC12H25)60, and Au187(SC12H25)68, respectively.150 Although the isolation of Au102(SR)44 and Au144(SR)60 had been previously reported,101,151 Au130(SR)50 and Au187(SR)68 clusters were successfully isolated for the first time in this experiment.152,153 They also succeeded in finding an experimental condition for separating Aun(SC12H25)m clusters in a wide range from Au38(SC12H25)24 to Au∼520(SC12H25)∼130 at the same time (Fig. 12B).154 In cooperation with Häkkinen and Tsukuda et al., they clarified the electronic and geometrical structures of a series of isolated Aun(SC12H25)m clusters and concluded that the transition from bulk to non-bulk occurs in the region from Au187(SC12H25)68 to Au144(SC12H25)60 in the Aun(SC12H25)m clusters (Fig. 12C).154 Regarding this transition, the recent studies by Jin et al.155,156 and Dass et al.157,158 revealed that the transition from bulk to non-bulk occurs between Au279(SR)84 to Au246(SR)80 in the case of Aun(SR)m clusters including benzenethiolate in the functional group of the ligand. Knoppe et al. also studied the separation of these Aun(SC12H25)m clusters. They found the conditions for separating Au25(SC12H25)18 and Au38(SC12H25)24 with high resolution and revealed the correlation between the alkyl chain length and retention time through experiments conducted under such conditions.159
Black and Whetten et al. separated Aun(SC2H4Ph)m clusters using a capillary C18 column. Their use of a capillary column was unique, enabling suppression of the quantity of the mobile phase and thereby direct evaluation of the chemical composition of the eluted cluster with a directly connected ESI mass spectrometer (Fig. 12D).160,161 They also succeeded in clearly separating Au104(SC2H4Ph)45, Au130(SC2H4Ph)50, Au137(SC2H4Ph)56, and Au144(SC2H4Ph)60 using a similar method.161
Negishi et al. reported that [Au25(SC12H25)18]0 and [Au25(SC12H25)18]− elute at significantly different retention times in RP partition chromatography (Fig. 13). In this study, they estimated the charge state of Au24Pd(SC12H25)18 with an unknown charge state by comparing the retention time of Au24Pd(SC12H25)18 with that of [Au25(SC12H25)18]0 and [Au25(SC12H25)18]−. This comparison elucidated that Au24Pd(SC12H25)18 could be synthesized in the neutral form ([Au24Pd(SR)18]0).162 They also demonstrated by a similar comparison that Au25−xAgx(SC12H25)18 could be synthesized in the negative form ([Au25−xAgx(SR)18]−).163 Their interpretation was later confirmed by the SC-XRD analysis of Au24Pd(SR)18 and Au25−xAgx(SR)18 (SR = SC2H4Ph).164,165
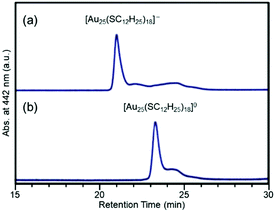 | ||
| Fig. 13 RP partition chromatograms of (a) [Au25(SC12H25)18]− and (b) [Au25(SC12H25)18]0. Reproduced with permission from ref. 162. Copyright 2010 The Royal Society of Chemistry. | ||
Negishi and Pradeep et al. reported that multiple ligands of Au24Pd(SC12H25)18 can be exchanged with SBB (4-tert-butylbenzenemethanethiolate) via the reaction of Au24Pd(SC12H25)18 with 4-tert-butylbenzenemethanethiol (BBSH) in solution. However, the obtained cluster had a distribution in the number of exchanged ligands. They succeeded in separating such a mixture depending on ligand composition using RP partition chromatography.171 In this experiment, first, all the Au24Pd(SC12H25)18−x(SBB)x was adsorbed on the stationary phase. Then, Au24Pd(SC12H25)18−x(SBB)x with higher polarity was eluted sequentially by decreasing the polarity of the mobile phase using a gradient program (Fig. 14A). It is assumed that the difference in the adsorption ability to the stationary phase was also involved in this separation in addition to the difference in the partition coefficient. Niihori et al. demonstrated that such a method is applicable to the separation of various Au24Pd(SR1)m−x(SR2)x clusters with two types of SRs (Fig. 14B).172 In later studies, Niihori et al. also succeeded in further improving the resolution, thereby enabling the separation of Au24Pd(SC2H4Ph)18−x(SC12H25)x (x = 1, 2) depending on the coordination isomers (Fig. 14C).173 Such separation revealed a preferred site for ligand exchange.173
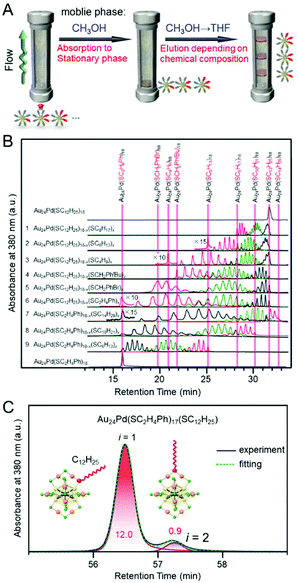 | ||
| Fig. 14 HPLC separation of Au24Pd(SR1)18−x(SR2)x clusters depending on the ligand combination. (A) Schematic illustration of separation method.171 (B) Chromatogram of Au24Pd(SR1)18−x(SR2)x clusters.172 (C) Expanded chromatogram of Au24Pd (SC2H4Ph)17(SC12H25), showing the separation of the coordination isomers.173 Reproduced with permission from ref. 171, 172 and 173. Copyright 2013 American Chemical Society, Copyright 2014 The Royal Society of Chemistry, and Copyright 2015 American Chemical Society. | ||
Niihori et al. prepared a mixture of Au25−xAgx(SC4H9)18 (x = 1–4) (SC4H9 = butanethiolate) and separated it using RP partition chromatography. In this study, they used a column with a core–shell-type stationary phase. As a result, Au25−xAgx(SC4H9)18 (x = 1–4) was separated at high resolution (Fig. 15A).212 The optical absorption spectrum of the separated Au25−xAgx(SC4H9)18 revealed the correlation between the chemical composition and electronic structure in Au25−xAgx(SC4H9)18 (x = 1–4) with atomic accuracy (Fig. 15B). This method also enabled the separation of structural isomers in Au25−xAgx(SC4H9)18 (x = 2,3) (Fig. 15A).212 The researchers recorded time-dependent mass spectra using LC/MS for Au25−xAgx(SC4H9)18 (x = 1–4). They revealed that Au25−xAgx(SC4H9)18 (x = 2,3) has different structural isomer distributions depending on the synthesis method and that the isomer distributions vary in solution. Similar separation and evaluation were also performed by Niihori et al. for Au38−xAgx(SC4H9)24 (x = 1–4).213
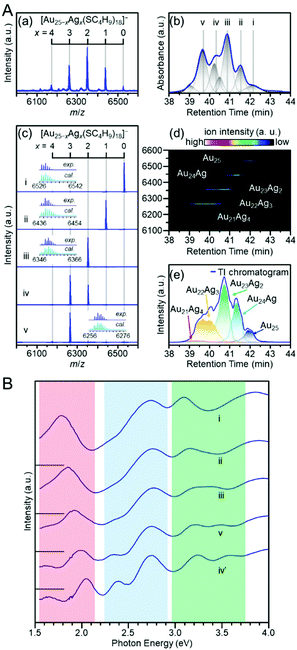 | ||
| Fig. 15 (A) Separation of [Au25−xAgx(SC4H9)18]0. (a) Negative-ion ESI mass spectrum and (b) UV chromatogram and the fitting result of a cluster mixture. (c) Negative-ion ESI mass spectra and isotope patterns for peaks i–v in (b). (d) Time-dependent mass spectrum and (e) extracted-ion (EI) chromatogram. In (e), the total ion (TI) chromatogram overall reproduces the UV chromatogram (b). (B) Optical absorption spectra of i ([Au25(SC4H9)18]0), ii ([Au24Ag(SC4H9)18]0), iii ([Au23Ag2(SC4H9)18]0), v ([Au22Ag3(SC4H9)18]0), and iv′ ([Au21Ag4(SC4H9)18]0; the mass spectrum is shown in the original paper. In the red, blue, and green regions, the clear peak splitting is caused by Ag substitution. Reproduced with permission from ref. 212. Copyright 2018 American Chemical Society. | ||
5.2. Ion-pair chromatography
As described in section 4, PAGE has been mainly used for the separation of hydrophilic clusters. However, if RP partition chromatography can be used for the separation of hydrophilic clusters, it becomes possible to determine the chemical composition of the separated clusters using LC/MS. The separation of such hydrophilic clusters by RP partition chromatography can be achieved by changing the hydrophilic surface of the cluster to a hydrophobic surface with an ion-pair reagent (Fig. 16A).215 There have been several reports on the separation of hydrophilic clusters depending on the core size using such ion-pair chromatography.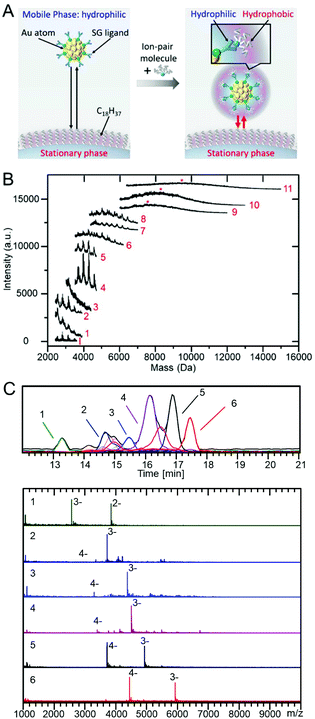 | ||
| Fig. 16 (A) Diagram showing the basic concept of reverse phase ion-pair chromatography in the separation of hydrophilic Aun(SR)m clusters.215 (B) MALDI mass spectra of each fraction (1–11) separated by ion-pair chromatography.217 (C) ESI-coupled LC/MS analysis of Aun(m-MBA)m clusters. The top frame shows the chromatograms and an EI chromatogram for each identified component.221 Reproduced with permission from ref. 215, 217 and 221. Copyright 2017 American Chemical Society, Copyright 2009 American Chemical Society, and Copyright 2019 MDPI. | ||
The first report was on the separation of Aun(NALC)m and Aun(S(PG))m clusters (NALC = N-acetyl-L-cysteine) by Murray et al. In this study, they used a C18 column for the stationary phase and tetrabutylammonium fluoride ((C4H9)4N+F−) for the ion-pair reagent.216 Aun(NALC)m and Aun(S(PG))m clusters were separated depending on the core size because (C4H9)4N+ ions formed ion pairs with hydrophilic clusters, and therefore, the cluster surface caused a hydrophobic interaction with the stationary phase. Later, Choi et al. attempted to separate Aun(NALC)m clusters under similar experimental conditions. In the study by Murray et al., the separated Aun(NALC)m clusters were characterized by optical absorption spectroscopy.216 However, Choi et al. separated each fraction and obtained their MALDI mass spectra (Fig. 16B). They confirmed that the Aun(NALC)m clusters could be separated depending on the chemical composition using this method.217 They also attempted to separate Aun(NALC)m clusters using an ultra HPLC (UHPLC) instrument. The results indicated that the separation could be performed in approximately 10% of the retention time with sharper peaks appearing in the chromatogram compared with the results obtained using the normal HPLC apparatus.218 Dong and Choi et al. conducted similar experiments on Pdn(NALC)m clusters and succeeded in separating them depending on the chemical composition.219 Niihori et al. performed the separation of Aun(SG)m clusters including the most commonly used hydrophilic ligand, SG, using ion-pair chromatography and succeeded in achieving higher-resolution separation than PAGE separation.215
In these studies, ion-pair chromatography was used for the separation; however, the chemical composition of the separated clusters was not determined by LC/MS. Because (C4H9)4N+ easily forms an ion pair with the dissociable functional group of the ligand and easily interacts with the stationary phase, a relatively high-resolution separation could be achieved when (C4H9)4N+ is used as the ion-pair reagent. However, (C4H9)4N+ is non-volatile and cannot be used in LC/MS because the salt precipitates during the ionization process. Whetten et al. overcame these challenges by using volatile triethylamine as the ion-pair reagent and succeeded in both the separation and determination of the chemical composition of the separated species by LC/MS for Aun(p-MBA)m (n = 5–102, m = 5–44) and Aun(m-MBA)m clusters (m-MBA = m-mercaptobenzoic acid; n = 48–67, m = 26–30; Fig. 16C).220,221 Whetten et al. also succeeded in identifying Au146(p-MBA)57 and [Ag29(LA)12]3− (LA = (R)-α lipoic acid) clusters and performing structural analysis of [Ag29(LA)12]3−.222,223
5.3. Hydrophilic interaction liquid chromatography
In this way, by using an ion-pair reagent, it is possible to separate the hydrophilic clusters depending on the core size using RP partition chromatography. In addition, when a volatile ion-pair reagent is used, the chemical composition of the separated clusters can be determined using an ESI mass spectrometer directly connected with RP partition chromatography. However, if a hydrophilic interaction liquid chromatography (HILIC) column224 was used for the separation of the hydrophilic clusters, even ion-pair reagents become unnecessary, and the separation and evaluation of hydrophilic clusters would be facilitated.Niihori et al. attempted the separation and evaluation of Aun(SG)m and Aun−xMx(SG)m alloy clusters (M = Ag, Cu or Pd) by LC/MS using an HILIC column (Fig. 17A). They used two columns (a ZIC-cHILIC and Amido-80 column; Fig. 11B). The Aun(SG)m clusters were separated with high resolution.211 In this study, they detected the Aun(SG)m clusters that had never been reported (Fig. 17B). All the synthesized clusters were introduced into the mass spectrometer, unlike the case using PAGE (Fig. 17A). Thus, small species that have almost never been observed before were also detected in addition to the previously reported stable species. The use of the HILIC column also enabled the separation of Aun−xMx(SG)m alloy clusters depending on the number of constituent atoms. The chemical composition evaluation by LC/MS resulted in the discovery of new Aun−xPdx(SG)m clusters, such as Au14Pd(SG)13, Au24Pd(SG)18, and Au28Pd(SG)20, which had not been reported until then. Stamplecoskie et al. also separated Agn(SG)m clusters using an amide column and revealed the size dependence of the optical properties of Agn(SG)m clusters225 (although the technique is not described as HILIC in the original paper, it is speculated that each Agn(SG)m cluster was separated in HILIC mode from the experimental conditions).
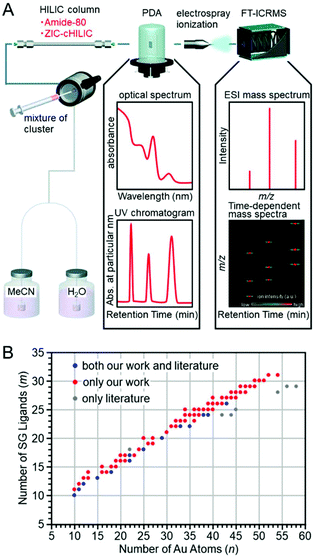 | ||
| Fig. 17 (A) Schematic illustration of the LC/MS system used in the work of ref. 211. PDA: Photodiode array, FT-ICRMS: Fourier transform-ion cyclotron resonance mass spectrometry. (B) Comparison of chemical compositions of Aun(SG)m clusters determined by ESI mass spectrometry. Reproduced with permission from ref. 211. Copyright 2018 The Royal Society of Chemistry. | ||
5.4. Size exclusion chromatography
In the RP partition chromatography and the HILIC described above, a chemical interaction (partitioning and/or adsorption) occurs between the stationary phase and clusters, and accordingly, the difference in the mobility of each cluster results in the separation of the clusters. However, in size exclusion chromatography (SEC), each cluster is separated by physical size. Therefore, when separating the clusters using the size exclusion mode, a stationary phase that does not interact with the clusters must be selected. SEC is divided into gel permeation chromatography (GPC) and gel filtration chromatography (GFC). In GPC, the mobile phase is an organic solvent, and in GFC, the mobile phase is an aqueous solvent. In these separations, Aun(SR)m clusters elute from the column in the order from largest to smallest.Wilcoxon et al. then performed the size separation of Aun(SClH2l+1)m and Agn(SC12H25)m clusters with a metal core size of 1.3–8.0 nm. They obtained knowledge on the correlation between the particle size and electronic structure from their findings.228,229 Tsukuda et al. succeeded in separating Aun(SC18H37)m clusters with higher resolution by recycling (Fig. 18A),230 and successfully isolated Aun(SClH2l+1)m clusters (l = 12, 18) having Au55 as the metal core with high purity.231 In a later study, Jin et al. revealed that this cluster has the chemical composition of Au55(SR)31 using ESI-MS (Fig. 18B).232 Jin et al. also succeeded in separating Au38(SC2H4Ph)24 and Au40(SC2H4Ph)24, whose chemical compositions are very similar, using GPC.233
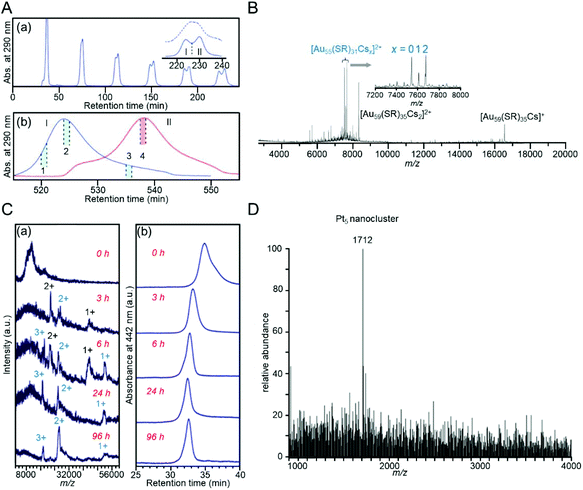 | ||
| Fig. 18 Examples of SEC separations. (A) (a) Chromatogram of recycling GPC of the Aun(SC18H25)m clusters reported by the Tsukuda group.230 The dotted curve in the inset is the data for the sample without etching treatment. (b) Recycling chromatograms of two fractions I and II. Fraction 2 includes the Au55 cluster with high purity. (B) ESI mass spectrum of [Au55(SR)31Csx]2+ observed by the Jin group.232 (C) (a) Positive-ion ESI mass spectra and (b) GPC chromatograms of Agn(SBB)m clusters as a function of incubation time (incubation by BBSH).234 (D) ESI mass spectrum of the Pt5 nanocluster obtained by GFC purification.237 Reproduced with permission from ref. 230, 232, 234 and 237. Copyright 2006 American Chemical Society, Copyright 2011 The Royal Society of Chemistry, Copyright 2011 The Royal Society of Chemistry, and Copyright 2011 Wiley-VCH. | ||
GPC is also utilized for tracking reactions. Negishi et al. traced the growth of Agn(SBB)m clusters using GPC. The clusters were observed to settle in a stable cluster at 96 h under their reaction conditions (Fig. 18C).234 Jin et al. and Zhu et al. also used GPC to track several reactions and discovered a method to size-selectively synthesize Aun(SR)m clusters, such as Au19(SC2H4Ph)13, Au20(SC2H4Ph)16, and Au24(SC2H4Ph)20, with atomic precision.235,236
5.5. Chiral chromatography
In chiral chromatography, a compound is separated into optical isomers by utilizing the difference in interaction between the compound and a stationary phase with chirality. The stationary phase is composed of silica gel chemically modified with a chiral compound, such as cellulose (Fig. 11E). A “three-point bond model” has been proposed for the separation mechanism of the optical isomers.239 According to this mechanism, a compound and a chiral stationary phase form a diastereomeric aggregate because of interaction at three binding sites. Because the binding energy of such an aggregate differs depending on the optical isomer (Fig. 11E), a difference in the retention time of each optical isomer is observed. Interactions forming aggregates include hydrogen-bond formation, charge-transfer complex formation, ion-pair formation, coordination bonding to metals, and dipole–dipole interaction. In the actual separation, these interactions contribute singly or in combination.Kornberg et al. determined the geometrical structure of the Aun(SR)m cluster for the first time in 2007, revealing that the Aun(SR)m cluster consisted of a Au core covered with multiple Au(I)–SR staples and that Au102(p-MBA)44 has optical isomers.240 Since then, many Aun(SR)m clusters have been revealed to have optical isomers by SC-XRD analysis.61,241–243
Bürgi et al. succeeded for the first time in separating Au38(SC2H4Ph)24 (Fig. 19A) into chiral isomers using chiral chromatography in 2010 (Fig. 19B).244 In this study, a stationary phase in which cellulose was chemically modified on the silica surface was used. The separation resulted in obtaining much information on the physical/chemical properties of the chiral Aun(SR)m clusters, which were previously unknown. For example, for the chemical properties, it was revealed that when one of the optical isomers of Au38(SC2H4Ph)24 was left in a solvent at 80 °C, racemization proceeded and the enantiomeric excess became 27% in 15 min.245 The researchers performed the same separation and reaction tracking for Au40(SC2H4Ph)24 and observed that Au40(SC2H4Ph)24 does not racemize unless it is left in solution at a higher temperature.246 The researchers also revealed that the two optical isomers had different reaction rates in the ligand exchange reaction with 1,1′-binaphthyl-2,2′-dithiol (R-BINAS), which has optical isomerism.247 It was also clarified that introducing R-BINAS into the ligand layer by ligand exchange improves the stability of the cluster and can suppress the racemization of the optical isomer (Fig. 19C).248 Soai and Negishi et al. studied the asymmetric autocatalytic reaction (Soai reaction249) in which a chiral compound asymmetrically synthesizes itself and self-proliferates using each optical isomer of Au38(SC2H4Ph)24.250 This study revealed that each optical isomer of Au38(SC2H4Ph)24 can be used as an asymmetric catalyst.
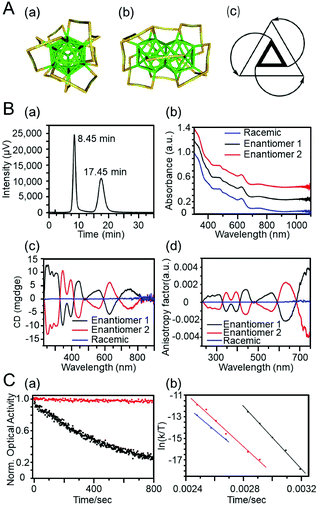 | ||
| Fig. 19 (A) Crystal structure of the left-handed enantiomer of Au38(SC2H4Ph)24. For clarity, the –C2H4Ph units were removed; yellow, gold adatoms; green, core atoms (Au); orange, sulfur. (a) Top view and (b) side view of the cluster; (c) schematic representation highlighting the handedness of the cluster. (B) HPLC separation of rac-Au38(SC2H4Ph)24. (a) HPLC chromatogram of the enantioseparation of rac-Au38(SC2H4Ph)24. The peak at 8.45 min corresponds to enantiomer 1; the second peak at 17.45 min corresponds to enantiomer 2. (b) Optical absorbance spectra of enantiomers 1 (black) and 2 (red) and of the racemate (blue). (c) CD spectra of isolated enantiomers 1 (black) and 2 (red) and of rac-Au38(SC2H4Ph)24 (blue) before separation and (d) corresponding anisotropy factors of enantiomers 1 and 2 and of the racemate.244 (C) (a) CD response of Au38(SC2H4Ph)24 (black) and A-Au38(SC2H4Ph)22(R-BINAS)1 (red) during heating at 80 °C. (b) Eyring plot showing the temperature dependency of the rate constants of the inversion for Au38(SC2H4Ph)24 (black), A-Au38(SC2H4Ph)22(R-BINAS)1 (red), and C-Au38(SC2H4Ph)22(R-BINAS)1 (blue).248 Reproduced with permission from ref. 244 and 248. Copyright 2012 Nature Publishing Group and Copyright 2013 American Chemical Society. | ||
Chiral chromatography has also been used for the optical separation of other Aun(SR)m and related clusters.251–261 The use of such chiral chromatography is expected to provide a deeper understanding of the asymmetric catalytic activity and circularly polarized light emission262 of each optical isomer in the future.
6. TLC separation
TLC uses an inexpensive and simple device different from that used for HPLC. Furthermore, in TLC, the separation can be visually confirmed similarly to PAGE. The use of preparative thin-layer chromatography (PTLC) using a thicker silica gel than that used in TLC makes it possible to isolate each cluster on a relatively large scale. Therefore, TLC is often used to confirm the purity of a product. When Wu and Jin et al. elucidated the geometrical structure of Au144(SR)60 by SC-XRD, PTLC was used to increase its purity.263 For a mixture of Aun(SR)m and related clusters composed of clusters with great difference in size and charge state, this method can be used for the separation of clusters depending on the size and charge state.Pradeep et al. succeeded in clearly separating Au25(SC2H4Ph)18 and Au144(SC2H4Ph)60 contained in the product using TLC in 2014.264 They also succeeded in separating Au25(SC2H4Ph)18 and Au25(SC4H9)18 with different ligands, Au25(Calix)x(SC4H9)y (Calix = tetrathiolated calix[4]arene (25,26,27,28-tetrakis (4-mercapto-n-butoxy)calix[4]arene); Fig. 20A) with different ligand combinations, and [Au25(SC2H4Ph)18]0 and [Au25(SC2H4Ph)18]− with different charge states using TLC. Wu et al. clearly separated Au25(SC2H4Ph)18 and Au25Ag2(SC2H4Ph)18 using TLC (Fig. 20B).265 Jin et al. succeeded in separating the structural isomers (T- and Q-isomers) of Au38(SC2H4Ph)24 using TLC.266
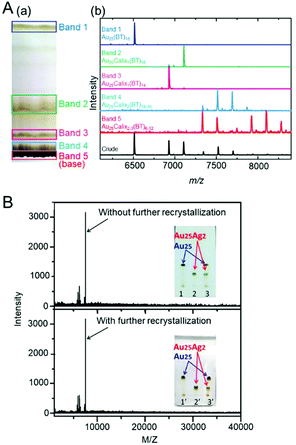 | ||
| Fig. 20 (A) (a) Photograph of the TLC plate used for cluster separation. (b) MALDI-MS data for the Au25Calix0–3BT6–18 crude product before TLC (black trace) and bands 1–5 separated by TLC.264 (B) Inset: TLC chromatogram of Au25 (1 and 1′), Au25Ag2 (2 and 2′) and of the mixture of Au25 and Au25Ag2 (3 and 3′).265 Reproduced with permission from ref. 264 and 265. Copyright 2014 American Chemical Society and Copyright 2015 American Chemical Society. | ||
TLC is also frequently used in identifying the optimal reaction conditions because the distribution of the product can be visually confirmed. Wu et al. reacted [Au25(SC2H4Ph)18]− with Ag(I) ions and evaluated the distribution of the product. The analyses revealed that the anti-galvanic reaction occurring between [Au25(SC2H4Ph)18]− with Ag(I) ions varied depending on the type and concentration of Ag(I) ions.267 Wu et al. also used PTLC to monitor the size conversion from Au44(TBBT)28 (TBBT = 4-tert-butylbenzenethiolate) to Au36(TBBT)24. As a result, they succeeded in finding effective reaction conditions for such exchange reactions.268
7. Summary and outlook
This review summarized previous research on the high-resolution separation of Aun(SR)m and related clusters by focusing on PAGE, HPLC, and TLC. From this summary, the following characteristics of each separation method were revealed.PAGE:
Main target: Hydrophilic clusters
Advantages: (i) Inexpensive and simple, (ii) possible to separate clusters containing 40 or less atoms with atomic precision, and (iii) possible to confirm separation visibly by the naked eye
Main applications: (i) Isolation, (ii) reaction tracking, (iii) search for/identification of photoluminescent clusters, (iv) structural analysis, and (v) washing/purification
HPLC:
Main target: Both hydrophobic and hydrophilic clusters
Advantages: (i) High resolution, (ii) high repeatability, (iii) variety of separation modes, (iv) chiral separation, (v) possible to connect with an ESI mass spectrometer, (vi) possible to analyse minor species, and (vii) short separation time (UHPLC)
Main applications: (i) Isolation (but small amount), (ii) reaction tracking, (iii) structural analysis, (iv) chiral separation, and (v) washing/purification
TLC:
Main target: Hydrophobic clusters
Advantages: (i) Inexpensive and simple, (ii) possible to confirm separation visibly by the naked eye
Main applications: (i) Isolation, (ii) reaction tracking, (iii) structural analysis, and (iv) washing/purification
Because the precise synthesis techniques of Aun(SR)m and related clusters have progressed rapidly in the last 20 years, many studies on their separation have been reported. We hope that this review will provide guidelines to understand the characteristics of each separation method and enable the selection of an appropriate separation method for the target experiment.
In addition, it is hoped that the established techniques will be used more widely in the future for the separation of metal clusters. The chemical properties of Aun(SR)m and related clusters have still not been clarified completely. For example, although it has been revealed that many Aun(SR)m and related clusters have a chiral structure, the asymmetric catalytic activity and circularly polarized luminescence of each optical isomer have not yet been revealed. It is expected that these physical/chemical properties can be elucidated by studying each optical isomer separated by chiral chromatography. In addition, metal exchange between Aun−xMx(SR)m clusters has been shown to occur in solution.20 However, there are still many unclear points about the mechanism of the metal exchange reaction. A deep understanding of this mechanism could be obtained if the reaction proceeded using Aun−xAgx(SR)m clusters isolated with atomic precision211,212 and the reaction process was tracked using LC/MS. In future studies, the effective use of established separation techniques is expected to provide a deep understanding of the functions and properties of Aun(SR)m and related clusters.
Furthermore, there are some helpful separation/analysis techniques that should be actively incorporated in future research on metal clusters. For example, MS/MS in LC/MS is useful not only for determining the chemical composition of a product but also for analysing the structure of the product.269 An introduction of two-dimensional HPLC is also interesting for analysis.270 If such a method is introduced, comprehensive two-dimensional separation could be realised using two different separation modes. For instance, an optical isomer generated based on the position of an exchange ligand is expected to be isolated by this method.
As introduced in this review, separation/analysis techniques for metal clusters have been developing with the improvement of separation and analysis equipment. HPLC columns and mass spectrometers are still being improved day after day. We hope that the separation and analysis techniques for metal clusters will continue to evolve in the future with researchers being conscious of the latest techniques available for each device and continuing to actively incorporate such techniques into research on metal clusters.
Author contributions
Y. Negishi constructed the structure of this review. T. Kawawaki wrote sections 1 and 7. K. Hamada wrote sections 2 and 3. S. Hashimoto and A. Ebina wrote sections 4–6. Y. Negishi and S. Hossain revised the entire draft before submission, and all the authors have approved the final version of the manuscript.Conflicts of interest
There are no conflicts to declare.Notes and references
- K. J. Taylor, C. L. Pettiette-Hall, O. Cheshnovsky and R. E. Smalley, J. Chem. Phys., 1992, 96, 3319–3329 CrossRef CAS.
- K. Miyajima, N. Fukushima, H. Himeno, A. Yamada and F. Mafuné, J. Phys. Chem. A, 2009, 113, 13448–13450 CrossRef CAS PubMed.
- A. Nakajima, K. Hoshino, K. Watanabe, Y. Konishi, T. Kurikawa, S. Iwata and K. Kaya, Chem. Phys. Lett., 1994, 222, 353–357 CrossRef CAS.
- Y. Negishi, Y. Nakamura, A. Nakajima and K. Kaya, J. Chem. Phys., 2001, 115, 3657–3663 CrossRef CAS.
- K. Tono, A. Terasaki, T. Ohta and T. Kondow, Chem. Phys. Lett., 2007, 449, 276–281 CrossRef CAS.
- T. Watanabe and T. Tsukuda, J. Phys. Chem. C, 2013, 117, 6664–6668 CrossRef CAS.
- C. E. Briant, B. R. C. Theobald, J. W. White, L. K. Bell, D. M. P. Mingos and A. J. Welch, J. Chem. Soc., Chem. Commun., 1981, 201–202 RSC.
- G. Schmid, R. Pfeil, R. Boese, F. Bandermann, S. Meyer, G. H. M. Calis and J. W. A. van der Veldend, Chem. Ber., 1981, 114, 3634–3642 CrossRef CAS.
- S. S. Kurasov, N. K. Eremenko, Y. L. Slovokhotov and Y. T. Struchkov, J. Organomet. Chem., 1989, 361, 405–408 CrossRef CAS.
- M. McPartlin, R. Mason and L. Malatesta, J. Chem. Soc. D, 1969, 334 RSC.
- E. G. Mednikov and L. F. Dahl, Philos. Trans. R. Soc., A, 2010, 368, 1301–1332 CrossRef CAS PubMed.
- G. Schmid, Chem. Rev., 1992, 92, 1709–1727 CrossRef CAS.
- M. Schulz-Dobrick and M. Jansen, Z. Anorg. Allg. Chem., 2007, 633, 2326–2331 CrossRef CAS.
- B. K. Teo, X. Shi and H. Zhang, J. Am. Chem. Soc., 1992, 114, 2743–2745 CrossRef CAS.
- F. A. Vollenbroek, J. J. Bour and J. W. A. van der Veden, Recl. Trav. Chim. Pays-Bas, 1980, 99, 137–141 CrossRef CAS.
- M. Agrachev, M. Ruzzi, A. Venzo and F. Maran, Acc. Chem. Res., 2019, 52, 44–52 CrossRef CAS PubMed.
- C. M. Aikens, Acc. Chem. Res., 2018, 51, 3065–3073 CrossRef CAS PubMed.
- B. Bhattarai, Y. Zaker, A. Atnagulov, B. Yoon, U. Landman and T. P. Bigioni, Acc. Chem. Res., 2018, 51, 3104–3113 CrossRef CAS PubMed.
- M. Brust, M. Walker, D. Bethell, D. J. Schiffrin and R. Whyman, J. Chem. Soc., Chem. Commun., 1994, 801–802 RSC.
- I. Chakraborty and T. Pradeep, Chem. Rev., 2017, 117, 8208–8271 CrossRef CAS PubMed.
- Z. Gan, N. Xia and Z. Wu, Acc. Chem. Res., 2018, 51, 2774–2783 CrossRef CAS PubMed.
- A. Ghosh, O. F. Mohammed and O. M. Bakr, Acc. Chem. Res., 2018, 51, 3094–3103 CrossRef CAS PubMed.
- S. Hossain, Y. Niihori, L. V. Nair, B. Kumar, W. Kurashige and Y. Negishi, Acc. Chem. Res., 2018, 51, 3114–3124 CrossRef CAS PubMed.
- R. Jin, C. Zeng, M. Zhou and Y. Chen, Chem. Rev., 2016, 116, 10346–10413 CrossRef CAS PubMed.
- K. Kwak and D. Lee, Acc. Chem. Res., 2019, 52, 12–22 CrossRef CAS PubMed.
- B. Nieto-Ortega and T. Bürgi, Acc. Chem. Res., 2018, 51, 2811–2819 CrossRef CAS PubMed.
- Y. Pei, P. Wang, Z. Ma and L. Xiong, Acc. Chem. Res., 2019, 52, 23–33 CrossRef CAS PubMed.
- H. Qian, M. Zhu, Z. Wu and R. Jin, Acc. Chem. Res., 2012, 45, 1470–1479 CrossRef CAS PubMed.
- N. A. Sakthivel and A. Dass, Acc. Chem. Res., 2018, 51, 1774–1783 CrossRef CAS PubMed.
- Q. Tang, G. Hu, V. Fung and D.-e. Jiang, Acc. Chem. Res., 2018, 51, 2793–2802 CrossRef CAS PubMed.
- R. L. Whetten, H.-C. Weissker, J. J. Pelayo, S. M. Mullins, X. López-Lozano and I. L. Garzón, Acc. Chem. Res., 2019, 52, 34–43 CrossRef CAS PubMed.
- J. Yan, B. K. Teo and N. Zheng, Acc. Chem. Res., 2018, 51, 3084–3093 CrossRef CAS PubMed.
- Q. Yao, T. Chen, X. Yuan and J. Xie, Acc. Chem. Res., 2018, 51, 1338–1348 CrossRef CAS PubMed.
- R. L. Whetten, J. T. Khoury, M. M. Alvarez, S. Murthy, I. Vezmar, Z. L. Wang, P. W. Stephens, C. L. Cleveland, W. D. Luedtke and U. Landman, Adv. Mater., 1996, 8, 428–433 CrossRef CAS.
- T. G. Schaaff, M. N. Shafigullin, J. T. Khoury, I. Vezmar, R. L. Whetten, W. G. Cullen, P. N. First, C. Gutiérrez-Wing, J. Ascensio and M. J. Jose-Yacamán, J. Phys. Chem. B, 1997, 101, 7885–7891 CrossRef CAS.
- R. L. Donkers, D. Lee and R. W. Murray, Langmuir, 2004, 20, 1945–1952 CrossRef CAS.
- R. S. Ingram, M. J. Hostetler, R. W. Murray, T. G. Schaaff, J. T. Khoury, R. L. Whetten, T. P. Bigioni, D. K. Guthrie and P. N. First, J. Am. Chem. Soc., 1997, 119, 9279–9280 CrossRef CAS.
- T. G. Schaaff, M. N. Shafigullin, J. T. Khoury, I. Vezmar and R. L. Whetten, J. Phys. Chem. B, 2001, 105, 8785–8796 CrossRef CAS.
- Y. Shichibu, Y. Negishi, H. Tsunoyama, M. Kanehara, T. Teranishi and T. Tsukuda, Small, 2007, 3, 835–839 CrossRef CAS PubMed.
- A. Desireddy, S. Kumar, J. Guo, M. D. Bolan, W. P. Griffith and T. P. Bigioni, Nanoscale, 2013, 5, 2036–2044 RSC.
- Y. Negishi, K. Nobusada and T. Tsukuda, J. Am. Chem. Soc., 2005, 127, 5261–5270 CrossRef CAS PubMed.
- Y. Negishi, H. Tsunoyama, M. Suzuki, N. Kawamura, M. M. Matsushita, K. Maruyama, T. Sugawara, T. Yokoyama and T. Tsukuda, J. Am. Chem. Soc., 2006, 128, 12034–12035 CrossRef CAS PubMed.
- Y. Yu, Z. Luo, D. M. Chevrier, D. T. Leong, P. Zhang, D.-e. Jiang and J. Xie, J. Am. Chem. Soc., 2014, 136, 1246–1249 CrossRef CAS PubMed.
- Y. Shichibu, Y. Negishi, T. Tsukuda and T. Teranishi, J. Am. Chem. Soc., 2005, 127, 13464–13465 CrossRef CAS PubMed.
- Y. Du, H. Sheng, D. Astruc and M. Zhu, Chem. Rev., 2020, 120, 526–622 CrossRef CAS PubMed.
- H. Kawasaki, S. Kumar, G. Li, C. Zeng, D. R. Kauffman, J. Yoshimoto, Y. Iwasaki and R. Jin, Chem. Mater., 2014, 26, 2777–2788 CrossRef CAS.
- J. Xie, Y. Zheng and J. Y. Ying, Chem. Commun., 2010, 46, 961–963 RSC.
- G. Li and R. Jin, Acc. Chem. Res., 2013, 46, 1749–1758 CrossRef CAS PubMed.
- W. Kurashige, R. Kumazawa, D. Ishii, R. Hayashi, Y. Niihori, S. Hossain, L. V. Nair, T. Takayama, A. Iwase, S. Yamazoe, T. Tsukuda, A. Kudo and Y. Negishi, J. Phys. Chem. C, 2018, 122, 13669–13681 CrossRef CAS.
- Y. Negishi, Y. Matsuura, R. Tomizawa, W. Kurashige, Y. Niihori, T. Takayama, A. Iwase and A. Kudo, J. Phys. Chem. C, 2015, 119, 11224–11232 CrossRef CAS.
- Y.-S. Chen, H. Choi and P. V. Kamat, J. Am. Chem. Soc., 2013, 135, 8822–8825 CrossRef CAS PubMed.
- N. Sakai and T. Tatsuma, Adv. Mater., 2010, 22, 3185–3188 CrossRef CAS PubMed.
- T. Kawawaki, Y. Negishi and H. Kawasaki, Nanoscale Adv., 2020, 2, 17–36 RSC.
- Y. Niihori, C. Uchida, W. Kurashige and Y. Negishi, Phys. Chem. Chem. Phys., 2016, 18, 4251–4265 RSC.
- V. L. Jimenez, D. G. Georganopoulou, R. J. White, A. S. Harper, A. J. Mills, D. Lee and R. W. Murray, Langmuir, 2004, 20, 6864–6870 CrossRef CAS PubMed.
- M. W. Heaven, A. Dass, P. S. White, K. M. Holt and R. W. Murray, J. Am. Chem. Soc., 2008, 130, 3754–3755 CrossRef CAS PubMed.
- Y. Negishi, N. K. Chaki, Y. Shichibu, R. L. Whetten and T. Tsukuda, J. Am. Chem. Soc., 2007, 129, 11322–11323 CrossRef CAS PubMed.
- N. K. Chaki, Y. Negishi, H. Tsunoyama, Y. Shichibu and T. Tsukuda, J. Am. Chem. Soc., 2008, 130, 8608–8610 CrossRef CAS PubMed.
- Y. Song, Y. Li, H. Li, F. Ke, J. Xiang, C. Zhou, P. Li, M. Zhu and R. Jin, Nat. Commun., 2020, 11, 478 CrossRef CAS PubMed.
- Q. Xu, S. Kumar, S. Jin, H. Qian, M. Zhu and R. Jin, Small, 2014, 10, 1008–1014 CrossRef CAS PubMed.
- H. Qian, W. T. Eckenhoff, Y. Zhu, T. Pintauer and R. Jin, J. Am. Chem. Soc., 2010, 132, 8280–8281 CrossRef CAS PubMed.
- P. R. Nimmala, B. Yoon, R. L. Whetten, U. Landman and A. Dass, J. Phys. Chem. A, 2013, 117, 504–517 CrossRef CAS PubMed.
- C. Kumara and A. Dass, Nanoscale, 2011, 3, 3064–3067 RSC.
- T. G. Schaaff, G. Knight, M. N. Shafigullin, R. F. Borkman and R. L. Whetten, J. Phys. Chem. B, 1998, 102, 10643–10646 CrossRef CAS.
- Y. Negishi, Y. Takasugi, S. Sato, H. Yao, K. Kimura and T. Tsukuda, J. Am. Chem. Soc., 2004, 126, 6518–6519 CrossRef CAS PubMed.
- W. Wang and R. W. Murray, Langmuir, 2005, 21, 7015–7022 CrossRef CAS PubMed.
- T. G. Schaaff and R. L. Whetten, J. Phys. Chem. B, 2000, 104, 2630–2641 CrossRef CAS.
- K. Kimura, N. Sugimoto, S. Sato, H. Yao, Y. Negishi and T. Tsukuda, J. Phys. Chem. C, 2009, 113, 14076–14082 CrossRef CAS.
- N. Kothalawala, J. Lee West IV and A. Dass, Nanoscale, 2014, 6, 683–687 RSC.
- K. Ikeda, Y. Kobayashi, Y. Negishi, M. Seto, T. Iwasa, K. Nobusada, T. Tsukuda and N. Kojima, J. Am. Chem. Soc., 2007, 129, 7230–7231 CrossRef CAS PubMed.
- M. Zhu, C. M. Aikens, F. J. Hollander, G. C. Schatz and R. Jin, J. Am. Chem. Soc., 2008, 130, 5883–5885 CrossRef CAS PubMed.
- M. Zhu, C. M. Aikens, M. P. Hendrich, R. Gupta, H. Qian, G. C. Schatz and R. Jin, J. Am. Chem. Soc., 2009, 131, 2490–2492 CrossRef CAS PubMed.
- Y. Negishi, Y. Takasugi, S. Sato, H. Yao, K. Kimura and T. Tsukuda, J. Phys. Chem. B, 2006, 110, 12218–12221 CrossRef CAS PubMed.
- T. Omoda, S. Takano, S. Yamazoe, K. Koyasu, Y. Negishi and T. Tsukuda, J. Phys. Chem. C, 2018, 122, 13199–13204 CrossRef CAS.
- M. Bieri, C. Gautier and T. Bürgi, Phys. Chem. Chem. Phys., 2007, 9, 671–685 RSC.
- C. Gautier and T. Bürgi, J. Am. Chem. Soc., 2006, 128, 11079–11087 CrossRef CAS PubMed.
- H. Yao, T. Fukui and K. Kimura, J. Phys. Chem. C, 2008, 112, 16281–16285 CrossRef CAS.
- H. Yao, M. Saeki and A. Sasaki, Langmuir, 2012, 28, 3995–4002 CrossRef CAS PubMed.
- S. Kumar, M. D. Bolan and T. P. Bigioni, J. Am. Chem. Soc., 2010, 132, 13141–13143 CrossRef CAS PubMed.
- J. Guo, S. Kumar, M. Bolan, A. Desireddy, T. P. Bigioni and W. P. Griffith, Anal. Chem., 2012, 84, 5304–5308 CrossRef CAS PubMed.
- T. Udayabhaskararao, M. S. Bootharaju and T. Pradeep, Nanoscale, 2013, 5, 9404–9411 RSC.
- N. Nishida, H. Yao, T. Ueda, A. Sasaki and K. Kimura, Chem. Mater., 2007, 19, 2831–2841 CrossRef CAS.
- M. M. Alvarez, J. Chen, G. Plascencia-Villa, D. M. Black, W. P. Griffith, I. L. Garzón, M. José-Yacamán, B. Demeler and R. L. Whetten, J. Phys. Chem. B, 2016, 120, 6430–6438 CrossRef CAS PubMed.
- S. R. Biltek, S. Mandal, A. Sen, A. C. Reber, A. F. Pedicini and S. N. Khanna, J. Am. Chem. Soc., 2013, 135, 26–29 CrossRef CAS PubMed.
- N. Cathcart, P. Mistry, C. Makra, B. Pietrobon, N. Coombs, M. Jelokhani-Niaraki and V. Kitaev, Langmuir, 2009, 25, 5840–5846 CrossRef CAS PubMed.
- J. Chen, L. Liu, L. Weng, Y. Lin, L. Liao, C. Wang, J. Yang and Z. Wu, Sci. Rep., 2015, 5, 16628 CrossRef CAS PubMed.
- L. Dhanalakshmi, T. Udayabhaskararao and T. Pradeep, Chem. Commun., 2012, 48, 859–861 RSC.
- B. Du, X. Jiang, A. Das, Q. Zhou, M. Yu, R. Jin and J. Zheng, Nat. Nanotechnol., 2017, 12, 1096–1102 CrossRef CAS PubMed.
- S. Knoppe, M. Vanbel, S. van Cleuvenbergen, L. Vanpraet, T. Bürgi and T. Verbiest, J. Phys. Chem. C, 2015, 119, 6221–6226 CrossRef CAS.
- G. Li, D.-e. Jiang, S. Kumar, Y. Chen and R. Jin, ACS Catal., 2014, 4, 2463–2469 CrossRef CAS.
- Q. Li, Y. Pan, T. Chen, Y. Du, H. Ge, B. Zhang, J. Xie, H. Yu and M. Zhu, Nanoscale, 2018, 10, 10166–10172 RSC.
- S. Maity, D. Bain and A. Patra, J. Phys. Chem. C, 2019, 123, 2506–2515 CrossRef CAS.
- G. Plascencia-Villa, B. Demeler, R. L. Whetten, W. P. Griffith, M. Alvarez, D. M. Black and M. José-Yacamán, J. Phys. Chem. C, 2016, 120, 8950–8958 CrossRef CAS.
- T. Udayabhaskararao, B. Nataraju and T. Pradeep, J. Am. Chem. Soc., 2010, 132, 16304–16307 CrossRef PubMed.
- N. Van Steerteghem, S. Van Cleuvenbergen, S. Deckers, C. Kumara, A. Dass, H. Häkkinen, K. Clays, T. Verbiest and S. Knoppe, Nanoscale, 2016, 8, 12123–12127 RSC.
- Z. Wu, E. Lanni, W. Chen, M. E. Bier, D. Ly and R. Jin, J. Am. Chem. Soc., 2009, 131, 16672–16674 CrossRef CAS PubMed.
- H. Yao, J. Phys. Chem. Lett., 2012, 3, 1701–1706 CrossRef CAS PubMed.
- H. Yao and R. Kobayashi, J. Colloid Interface Sci., 2014, 419, 1–8 CrossRef CAS PubMed.
- H. Yao, R. Kobayashi and Y. Nonoguchi, J. Phys. Chem. C, 2016, 120, 1284–1292 CrossRef CAS.
- H. Yao and T. Shiratsu, Chem. Lett., 2017, 46, 104–107 CrossRef CAS.
- Y. Levi-Kalisman, P. D. Jadzinsky, N. Kalisman, H. Tsunoyama, T. Tsukuda, D. A. Bushnell and R. D. Kornberg, J. Am. Chem. Soc., 2011, 133, 2976–2982 CrossRef CAS PubMed.
- M. Azubel and R. D. Kornberg, Nano Lett., 2016, 16, 3348–3351 CrossRef CAS PubMed.
- T. Chen, V. Fung, Q. Yao, Z. Luo, D.-e. Jiang and J. Xie, J. Am. Chem. Soc., 2018, 140, 11370–11377 CrossRef CAS PubMed.
- T. Chen, Z. Luo, Q. Yao, A. X. H. Yeo and J. Xie, Chem. Commun., 2016, 52, 9522–9525 RSC.
- C. Gautier and T. Bürgi, J. Am. Chem. Soc., 2008, 130, 7077–7084 CrossRef CAS PubMed.
- Z. P. Guven, B. Ustbas, K. M. Harkness, H. Coskun, C. P. Joshi, T. M. D. Besong, F. Stellacci, O. M. Bakr and O. Akbulut, Dalton Trans., 2016, 45, 11297–11300 RSC.
- V. Marjomäki, T. Lahtinen, M. Martikainen, J. Koivisto, S. Malola, K. Salorinne, M. Pettersson and H. Häkkinen, Proc. Natl. Acad. Sci. U. S. A., 2014, 111, 1277–1281 CrossRef PubMed.
- E. Porret, M. Jourdan, B. Gennaro, C. Comby-Zerbino, F. Bertorelle, V. Trouillet, X. Qiu, C. Zoukimian, D. Boturyn, N. Hildebrandt, R. Antoine, J.-L. Coll and X. Le Guével, J. Phys. Chem. C, 2019, 123, 26705–26717 CrossRef CAS.
- H. Yao, N. Kitaoka and A. Sasaki, Nanoscale, 2012, 4, 955–963 RSC.
- H. Yao and S. Yaomura, Langmuir, 2013, 29, 6444–6451 CrossRef CAS PubMed.
- T. A. Dreier, W. S. Compel, O. A. Wong and C. J. Ackerson, J. Phys. Chem. C, 2016, 120, 28288–28294 CrossRef CAS.
- M. S. Bootharaju, V. M. Burlakov, T. M. D. Besong, C. P. Joshi, L. G. AbdulHalim, D. M. Black, R. L. Whetten, A. Goriely and O. M. Bakr, Chem. Mater., 2015, 27, 4289–4297 CrossRef CAS.
- Y. Yu, J. Li, T. Chen, Y. N. Tan and J. Xie, J. Phys. Chem. C, 2015, 119, 10910–10918 CrossRef CAS.
- J. Zheng and R. M. Dickson, J. Am. Chem. Soc., 2002, 124, 13982–13983 CrossRef CAS PubMed.
- J. Zheng, C. Zhang and R. M. Dickson, Phys. Rev. Lett., 2004, 93, 077402 CrossRef PubMed.
- L.-Y. Chen, C.-W. Wang, Z. Yuan and H.-T. Chang, Anal. Chem., 2015, 87, 216–229 CrossRef CAS PubMed.
- T. Udayabhaskararao and T. Pradeep, Angew. Chem., Int. Ed., 2010, 49, 3925–3929 CrossRef CAS PubMed.
- O. A. Wong, C. L. Heinecke, A. R. Simone, R. L. Whetten and C. J. Ackerson, Nanoscale, 2012, 4, 4099–4102 RSC.
- T. Lahtinen, E. Hulkko, K. Sokołowska, T.-R. Tero, V. Saarnio, J. Lindgren, M. Pettersson, H. Häkkinen and L. Lehtovaara, Nanoscale, 2016, 8, 18665–18674 RSC.
- W. E. C. Moore, D. E. Hash, L. V. Holdeman and E. P. Cato, Appl. Environ. Microbiol., 1980, 39, 900–907 CrossRef CAS PubMed.
- M. C. Stark, M. A. Baikoghli, T. Lahtinen, S. Malola, L. Xing, M. Nguyen, M. Nguyen, A. Sikaroudi, V. Marjomäki, H. Häkkinen and R. H. Cheng, Sci. Rep., 2017, 7, 17048 CrossRef PubMed.
- A. M. Al-Somali, K. M. Krueger, J. C. Falkner and V. L. Colvin, Anal. Chem., 2004, 76, 5903–5910 CrossRef CAS PubMed.
- R. Balasubramanian, R. Guo, A. J. Mills and R. W. Murray, J. Am. Chem. Soc., 2005, 127, 8126–8132 CrossRef CAS PubMed.
- D. M. Black, G. Robles, S. B. H. Bach and R. L. Whetten, Ind. Eng. Chem. Res., 2018, 57, 5378–5384 CrossRef CAS.
- M. R. Branham, A. D. Douglas, A. J. Mills, J. B. Tracy, P. S. White and R. W. Murray, Langmuir, 2006, 22, 11376–11383 CrossRef CAS PubMed.
- A. Dass, R. Guo, J. B. Tracy, R. Balasubramanian, A. D. Douglas and R. W. Murray, Langmuir, 2008, 24, 310–315 CrossRef CAS PubMed.
- M. Galchenko, R. Schuster, A. Black, M. Riedner and C. Klinke, Nanoscale, 2019, 11, 1988–1994 RSC.
- A. Ghosh and T. Pradeep, Eur. J. Inorg. Chem., 2014, 2014, 5271–5275 CrossRef CAS.
- S. Hossain, W. Kurashige, S. Wakayama, B. Kumar, L. V. Nair, Y. Niihori and Y. Negishi, J. Phys. Chem. C, 2016, 120, 25861–25869 CrossRef CAS.
- Y. Ishida, A. Morita, T. Tokunaga and T. Yonezawa, Langmuir, 2018, 34, 4024–4030 CrossRef CAS PubMed.
- S. Knoppe, J. Boudon, I. Dolamic, A. Dass and T. Bürgi, Anal. Chem., 2011, 83, 5056–5061 CrossRef CAS PubMed.
- D. Lee, R. L. Donkers, J. M. DeSimone and R. W. Murray, J. Am. Chem. Soc., 2003, 125, 1182–1183 CrossRef CAS PubMed.
- S. Matsuo, S. Yamazoe, J.-Q. Goh, J. Akola and T. Tsukuda, Phys. Chem. Chem. Phys., 2016, 18, 4822–4827 RSC.
- L. D. Menard, S.-P. Gao, H. Xu, R. D. Twesten, A. S. Harper, Y. Song, G. Wang, A. D. Douglas, J. C. Yang, A. I. Frenkel, R. G. Nuzzo and R. W. Murray, J. Phys. Chem. B, 2006, 110, 12874–12883 CrossRef CAS PubMed.
- Y. Negishi, U. Kamimura, M. Ide and M. Hirayama, Nanoscale, 2012, 4, 4263–4268 RSC.
- H. Qian, E. Barry, Y. Zhu and R. Jin, Acta Phys. -Chim. Sin., 2011, 27, 513–519 CAS.
- H. Qian, D.-e. Jiang, G. Li, C. Gayathri, A. Das, R. R. Gil and R. Jin, J. Am. Chem. Soc., 2012, 134, 16159–16162 CrossRef CAS PubMed.
- H. Qian, M. Zhu, U. N. Andersen and R. Jin, J. Phys. Chem. A, 2009, 113, 4281–4284 CrossRef CAS PubMed.
- H. Qian, Y. Zhu and R. Jin, ACS Nano, 2009, 3, 3795–3803 CrossRef CAS PubMed.
- K. G. Stamplecoskie, G. Yousefalizadeh, L. Gozdzialski and H. Ramsay, J. Phys. Chem. C, 2018, 122, 13738–13744 CrossRef CAS.
- Z. Tang, D. A. Robinson, N. Bokossa, B. Xu, S. Wang and G. Wang, J. Am. Chem. Soc., 2011, 133, 16037–16044 CrossRef CAS PubMed.
- H. Tsunoyama, P. Nickut, Y. Negishi, K. Al-Shamery, Y. Matsumoto and T. Tsukuda, J. Phys. Chem. C, 2007, 111, 4153–4158 CrossRef CAS.
- X. Wei, X. Kang, S. Wang and M. Zhu, Dalton Trans., 2018, 47, 13766–13770 RSC.
- J. Xiang, P. Li, Y. Song, X. Liu, H. Chong, S. Jin, Y. Pei, X. Yuan and M. Zhu, Nanoscale, 2015, 7, 18278–18283 RSC.
- M. Zhu, H. Qian and R. Jin, J. Am. Chem. Soc., 2009, 131, 7220–7221 CrossRef CAS PubMed.
- V. L. Jimenez, M. C. Leopold, C. Mazzitelli, J. W. Jorgenson and R. W. Murray, Anal. Chem., 2003, 75, 199–206 CrossRef CAS PubMed.
- Y. Song, M. L. Heien, V. Jimenez, R. M. Wightman and R. W. Murray, Anal. Chem., 2004, 76, 4911–4919 CrossRef CAS PubMed.
- Y. Song, V. Jimenez, C. McKinney, R. Donkers and R. W. Murray, Anal. Chem., 2003, 75, 5088–5096 CrossRef CAS.
- R. L. Wolfe and R. W. Murray, Anal. Chem., 2006, 78, 1167–1173 CrossRef CAS PubMed.
- Y. Negishi, C. Sakamoto, T. Ohyama and T. Tsukuda, J. Phys. Chem. Lett., 2012, 3, 1624–1628 CrossRef CAS PubMed.
- H. Qian and R. Jin, Nano Lett., 2009, 9, 4083–4087 CrossRef CAS PubMed.
- A. Tlahuice-Flores, U. Santiago, D. Bahena, E. Vinogradova, C. V. Conroy, T. Ahuja, S. B. H. Bach, A. Ponce, G. Wang, M. José-Yacamán and R. L. Whetten, J. Phys. Chem. A, 2013, 117, 10470–10476 CrossRef CAS PubMed.
- Y. Chen, C. Zeng, C. Liu, K. Kirschbaum, C. Gayathri, R. R. Gil, N. L. Rosi and R. Jin, J. Am. Chem. Soc., 2015, 137, 10076–10079 CrossRef CAS PubMed.
- Y. Negishi, T. Nakazaki, S. Malola, S. Takano, Y. Niihori, W. Kurashige, S. Yamazoe, T. Tsukuda and H. Häkkinen, J. Am. Chem. Soc., 2015, 137, 1206–1212 CrossRef CAS PubMed.
- M. Zhou, C. Zeng, Y. Song, J. W. Padelford, G. Wang, M. Y. Sfeir, T. Higaki and R. Jin, Angew. Chem., Int. Ed., 2017, 56, 16257–16261 CrossRef CAS PubMed.
- T. Higaki, M. Zhou, K. J. Lambright, K. Kirschbaum, M. Y. Sfeir and R. Jin, J. Am. Chem. Soc., 2018, 140, 5691–5695 CrossRef CAS PubMed.
- N. A. Sakthivel, S. Theivendran, V. Ganeshraj, A. G. Oliver and A. Dass, J. Am. Chem. Soc., 2017, 139, 15450–15459 CrossRef CAS PubMed.
- N. A. Sakthivel, M. Stener, L. Sementa, A. Fortunelli, G. Ramakrishna and A. Dass, J. Phys. Chem. Lett., 2018, 9, 1295–1300 CrossRef CAS PubMed.
- S. Knoppe and P. Vogt, Anal. Chem., 2019, 91, 1603–1609 CrossRef CAS PubMed.
- D. M. Black, S. B. H. Bach and R. L. Whetten, Anal. Chem., 2016, 88, 5631–5636 CrossRef CAS PubMed.
- D. M. Black, N. Bhattarai, S. B. H. Bach and R. L. Whetten, J. Phys. Chem. Lett., 2016, 7, 3199–3205 CrossRef CAS PubMed.
- Y. Negishi, W. Kurashige, Y. Niihori, T. Iwasa and K. Nobusada, Phys. Chem. Chem. Phys., 2010, 12, 6219–6225 RSC.
- Y. Negishi, T. Iwai and M. Ide, Chem. Commun., 2010, 46, 4713–4715 RSC.
- C. Kumara, C. M. Aikens and A. Dass, J. Phys. Chem. Lett., 2014, 5, 461–466 CrossRef CAS PubMed.
- S. Tian, L. Liao, J. Yuan, C. Yao, J. Chen, J. Yang and Z. Wu, Chem. Commun., 2016, 52, 9873–9876 RSC.
- Z. Wu and R. Jin, Nano Lett., 2010, 10, 2568–2573 CrossRef CAS PubMed.
- Y. Negishi, H. Tsunoyama, Y. Yanagimoto and T. Tsukuda, Chem. Lett., 2005, 34, 1638–1639 CrossRef CAS.
- A. Dass, A. Stevenson, G. R. Dubay, J. B. Tracy and R. W. Murray, J. Am. Chem. Soc., 2008, 130, 5940–5946 CrossRef CAS PubMed.
- V. R. Jupally, R. Kota, E. V. Dornshuld, D. L. Mattern, G. S. Tschumper, D.-e. Jiang and A. Dass, J. Am. Chem. Soc., 2011, 133, 20258–20266 CrossRef CAS PubMed.
- J. B. Tracy, M. C. Crowe, J. F. Parker, O. Hampe, C. A. Fields-Zinna, A. Dass and R. W. Murray, J. Am. Chem. Soc., 2007, 129, 16209–16215 CrossRef CAS PubMed.
- Y. Niihori, M. Matsuzaki, T. Pradeep and Y. Negishi, J. Am. Chem. Soc., 2013, 135, 4946–4949 CrossRef CAS PubMed.
- Y. Niihori, M. Matsuzaki, C. Uchida and Y. Negishi, Nanoscale, 2014, 6, 7889–7896 RSC.
- Y. Niihori, Y. Kikuchi, A. Kato, M. Matsuzaki and Y. Negishi, ACS Nano, 2015, 9, 9347–9356 CrossRef CAS PubMed.
- M. S. Bootharaju, C. P. Joshi, M. R. Parida, O. F. Mohammed and O. M. Bakr, Angew. Chem., Int. Ed., 2016, 55, 922–926 CrossRef CAS PubMed.
- J. C. Gonzalez and A. Muñoz-Castro, J. Phys. Chem. C, 2016, 120, 27019–27026 CrossRef.
- M. Ganguly, C. Mondal, J. Pal, A. Pal, Y. Negishi and T. Pal, Dalton Trans., 2014, 43, 11557–11565 RSC.
- E. B. Guidez, V. Mäkinen, H. Häkkinen and C. M. Aikens, J. Phys. Chem. C, 2012, 116, 20617–20624 CrossRef CAS.
- S. Hossain, Y. Imai, Y. Motohashi, Z. Chen, D. Suzuki, T. Suzuki, Y. Kataoka, M. Hirata, T. Ono, W. Kurashige, T. Kawawaki, T. Yamamoto and Y. Negishi, Mater. Horiz., 2020, 7, 796–803 RSC.
- S. Hossain, Y. Imai and Y. Negishi, AIP Conf. Proc., 2019, 2186, 030018 CrossRef.
- S. Hossain, Y. Imai, D. Suzuki, W. Choi, Z. Chen, T. Suzuki, M. Yoshioka, T. Kawawaki, D. Lee and Y. Negishi, Nanoscale, 2019, 11, 22089–22098 RSC.
- S. Hossain, T. Ono, M. Yoshioka, G. Hu, M. Hosoi, Z. Chen, L. V. Nair, Y. Niihori, W. Kurashige, D.-e. Jiang and Y. Negishi, J. Phys. Chem. Lett., 2018, 9, 2590–2594 CrossRef CAS PubMed.
- J. Jana, T. Aditya, Y. Negishi and T. Pal, ACS Omega, 2017, 2, 8086–8098 CrossRef CAS PubMed.
- D.-e. Jiang and S. Dai, Inorg. Chem., 2009, 48, 2720–2722 CrossRef CAS PubMed.
- R. Jin and K. Nobusada, Nano Res., 2014, 7, 285–300 CrossRef CAS.
- W. Kurashige, R. Hayashi, K. Wakamatsu, Y. Kataoka, S. Hossain, A. Iwase, A. Kudo, S. Yamazoe and Y. Negishi, ACS Appl. Energy Mater., 2019, 2, 4175–4187 CrossRef CAS.
- W. Kurashige, K. Munakata, K. Nobusada and Y. Negishi, Chem. Commun., 2013, 49, 5447–5449 RSC.
- W. Kurashige and Y. Negishi, J. Cluster Sci., 2012, 23, 365–374 CrossRef CAS.
- W. Kurashige, Y. Niihori, S. Sharma and Y. Negishi, J. Phys. Chem. Lett., 2014, 5, 4134–4142 CrossRef CAS PubMed.
- W. Kurashige, Y. Niihori, S. Sharma and Y. Negishi, Coord. Chem. Rev., 2016, 320–321, 238–250 CrossRef CAS.
- B. Molina and A. Tlahuice-Flores, Phys. Chem. Chem. Phys., 2016, 18, 1397–1403 RSC.
- L. V. Nair, S. Hossain, S. Takagi, Y. Imai, G. Hu, S. Wakayama, B. Kumar, W. Kurashige, D.-e. Jiang and Y. Negishi, Nanoscale, 2018, 10, 18969–18979 RSC.
- Y. Negishi, W. Kurashige, Y. Kobayashi, S. Yamazoe, N. Kojima, M. Seto and T. Tsukuda, J. Phys. Chem. Lett., 2013, 4, 3579–3583 CrossRef CAS.
- Y. Negishi, W. Kurashige, Y. Niihori and K. Nobusada, Phys. Chem. Chem. Phys., 2013, 15, 18736–18751 RSC.
- Y. Negishi, K. Munakata, W. Ohgake and K. Nobusada, J. Phys. Chem. Lett., 2012, 3, 2209–2214 CrossRef CAS PubMed.
- Y. Niihori, M. Eguro, A. Kato, S. Sharma, B. Kumar, W. Kurashige, K. Nobusada and Y. Negishi, J. Phys. Chem. C, 2016, 120, 14301–14309 CrossRef CAS.
- Y. Niihori, S. Hossain, B. Kumar, L. V. Nair, W. Kurashige and Y. Negishi, APL Mater., 2017, 5, 053201 CrossRef.
- Y. Niihori, S. Hossain, S. Sharma, B. Kumar, W. Kurashige and Y. Negishi, Chem. Rec., 2017, 17, 473–484 CrossRef CAS PubMed.
- Y. Niihori, W. Kurashige, M. Matsuzaki and Y. Negishi, Nanoscale, 2013, 5, 508–512 RSC.
- Y. Niihori, K. Yoshida, S. Hossain, W. Kurashige and Y. Negishi, Bull. Chem. Soc. Jpn., 2019, 92, 664–695 CrossRef CAS.
- A. Puls, P. Jerabek, W. Kurashige, M. Förster, M. Molon, T. Bollermann, M. Winter, C. Gemel, Y. Negishi, G. Frenking and R. A. Fischer, Angew. Chem., Int. Ed., 2014, 53, 4327–4331 CrossRef CAS PubMed.
- S. Sharma, W. Kurashige, K. Nobusada and Y. Negishi, Nanoscale, 2015, 7, 10606–10612 RSC.
- S. Sharma, S. Yamazoe, T. Ono, W. Kurashige, Y. Niihori, K. Nobusada, T. Tsukuda and Y. Negishi, Dalton Trans., 2016, 45, 18064–18068 RSC.
- M. A. Tofanelli, T. W. Ni, B. D. Phillips and C. J. Ackerson, Inorg. Chem., 2016, 55, 999–1001 CrossRef CAS PubMed.
- S. Xie, H. Tsunoyama, W. Kurashige, Y. Negishi and T. Tsukuda, ACS Catal., 2012, 2, 1519–1523 CrossRef CAS.
- S. Yamazoe, W. Kurashige, K. Nobusada, Y. Negishi and T. Tsukuda, J. Phys. Chem. C, 2014, 118, 25284–25290 CrossRef CAS.
- H. Yang, Y. Wang, H. Huang, L. Gell, L. Lehtovaara, S. Malola, H. Häkkinen and N. Zheng, Nat. Commun., 2013, 4, 2422 CrossRef PubMed.
- Q. Yao, Y. Feng, V. Fung, Y. Yu, D.-e. Jiang, J. Yang and J. Xie, Nat. Commun., 2017, 8, 1555 CrossRef PubMed.
- T. Yokoyama, N. Hirata, H. Tsunoyama, Y. Negishi and A. Nakajima, AIP Adv., 2018, 8, 065002 CrossRef.
- B. Zhang, S. Kaziz, H. Li, D. Wodka, S. Malola, O. Safonova, M. Nachtegaal, C. Mazet, I. Dolamic, J. Llorca, E. Kalenius, L. M. L. Daku, H. Häkkinen, T. Bürgi and N. Barrabés, Nanoscale, 2015, 7, 17012–17019 RSC.
- S. Wang, Y. Song, S. Jin, X. Liu, J. Zhang, Y. Pei, X. Meng, M. Chen, P. Li and M. Zhu, J. Am. Chem. Soc., 2015, 137, 4018–4021 CrossRef CAS PubMed.
- Y. Niihori, D. Shima, K. Yoshida, K. Hamada, L. V. Nair, S. Hossain, W. Kurashige and Y. Negishi, Nanoscale, 2018, 10, 1641–1649 RSC.
- Y. Niihori, Y. Koyama, S. Watanabe, S. Hashimoto, S. Hossain, L. V. Nair, B. Kumar, W. Kurashige and Y. Negishi, J. Phys. Chem. Lett., 2018, 9, 4930–4934 CrossRef CAS PubMed.
- Y. Niihori, S. Hashimoto, Y. Koyama, S. Hossain, W. Kurashige and Y. Negishi, J. Phys. Chem. C, 2019, 123, 13324–13329 CrossRef CAS.
- C. Kumara and A. Dass, Nanoscale, 2012, 4, 4084–4086 RSC.
- Y. Niihori, Y. Kikuchi, D. Shima, C. Uchida, S. Sharma, S. Hossain, W. Kurashige and Y. Negishi, Ind. Eng. Chem. Res., 2017, 56, 1029–1035 CrossRef CAS.
- M. M. F. Choi, A. D. Douglas and R. W. Murray, Anal. Chem., 2006, 78, 2779–2785 CrossRef CAS PubMed.
- Y. Zhang, S. Shuang, C. Dong, C. K. Lo, M. C. Paau and M. M. F. Choi, Anal. Chem., 2009, 81, 1676–1685 CrossRef CAS PubMed.
- M. C. Paau, Q. Hu, Y. Zhang and M. M. F. Choi, Anal. Methods, 2015, 7, 2452–2457 RSC.
- L. Zhang, Q. Hu, Z. Li, Y. Zhang, D. Lu, S. Shuang, M. M. F. Choi and C. Dong, Anal. Methods, 2017, 9, 4539–4546 RSC.
- D. M. Black, M. M. Alvarez, F. Yan, W. P. Griffith, G. Plascencia-Villa, S. B. H. Bach and R. L. Whetten, J. Phys. Chem. C, 2017, 121, 10851–10857 CrossRef CAS.
- D. M. Black, M. M. Hoque, G. Plascencia-Villa and R. L. Whetten, Nanomaterials, 2019, 9, 1303 CrossRef CAS PubMed.
- D. M. Black, G. Robles, P. Lopez, S. B. H. Bach, M. Alvarez and R. L. Whetten, Anal. Chem., 2018, 90, 2010–2017 CrossRef CAS PubMed.
- P. Lopez, H. H. Lara, S. M. Mullins, D. M. Black, H. M. Ramsower, M. M. Alvarez, T. L. Williams, X. Lopez-Lozano, H.-C. Weissker, A. P. García, I. L. Garzón, B. Demeler, J. L. Lopez-Ribot, M. J. Yacamán and R. L. Whetten, ACS Appl. Nano Mater., 2018, 1, 1595–1602 CrossRef CAS.
- B. Buszewski and S. Noga, Anal. Bioanal. Chem., 2012, 402, 231–247 CrossRef CAS PubMed.
- H. Ramsay, D. Simon, E. Steele, A. Hebert, R. D. Oleschuk and K. G. Stamplecoskie, RSC Adv., 2018, 8, 42080–42086 RSC.
- J. P. Wilcoxon, J. E. Martin and P. Provencio, Langmuir, 2000, 16, 9912–9920 CrossRef CAS.
- H. Murayama, T. Narushima, Y. Negishi and T. Tsukuda, J. Phys. Chem. B, 2004, 108, 3496–3503 CrossRef CAS.
- J. P. Wilcoxon, J. E. Martin and P. Provencio, J. Chem. Phys., 2001, 115, 998–1008 CrossRef CAS.
- J. P. Wilcoxon and P. Provencio, J. Phys. Chem. B, 2003, 107, 12949–12957 CrossRef CAS.
- H. Tsunoyama, Y. Negishi and T. Tsukuda, J. Am. Chem. Soc., 2006, 128, 6036–6037 CrossRef CAS PubMed.
- R. Tsunoyama, H. Tsunoyama, P. Pannopard, J. Limtrakul and T. Tsukuda, J. Phys. Chem. C, 2010, 114, 16004–16009 CrossRef CAS.
- H. Qian and R. Jin, Chem. Commun., 2011, 47, 11462–11464 RSC.
- H. Qian, Y. Zhu and R. Jin, J. Am. Chem. Soc., 2010, 132, 4583–4585 CrossRef CAS PubMed.
- Y. Negishi, R. Arai, Y. Niihori and T. Tsukuda, Chem. Commun., 2011, 47, 5693–5695 RSC.
- Z. Wu, M. A. MacDonald, J. Chen, P. Zhang and R. Jin, J. Am. Chem. Soc., 2011, 133, 9670–9673 CrossRef CAS PubMed.
- X. Zhu, S. Jin, S. Wang, X. Meng, C. Zhu, M. Zhu and R. Jin, Chem. – Asian J., 2013, 8, 2739–2745 CrossRef CAS PubMed.
- S.-i. Tanaka, J. Miyazaki, D. K. Tiwari, T. Jin and Y. Inouye, Angew. Chem., Int. Ed., 2011, 50, 431–435 CrossRef CAS PubMed.
- S.-i. Tanaka, K. Aoki, A. Muratsugu, H. Ishitobi, T. Jin and Y. Inouye, Opt. Mater. Express, 2013, 3, 157–165 CrossRef CAS.
- C. E. Dalgliesh, J. Chem. Soc., 1952, 3940–3942 RSC.
- P. D. Jadzinsky, G. Calero, C. J. Ackerson, D. A. Bushnell and R. D. Kornberg, Science, 2007, 318, 430–433 CrossRef CAS PubMed.
- C. Zeng, Y. Chen, K. Kirschbaum, K. Appavoo, M. Y. Sfeir and R. Jin, Sci. Adv., 2015, 1, e1500045 CrossRef PubMed.
- C. Zeng, T. Li, A. Das, N. L. Rosi and R. Jin, J. Am. Chem. Soc., 2013, 135, 10011–10013 CrossRef CAS PubMed.
- C. Zeng, C. Liu, Y. Chen, N. L. Rosi and R. Jin, J. Am. Chem. Soc., 2014, 136, 11922–11925 CrossRef CAS PubMed.
- I. Dolamic, S. Knoppe, A. Dass and T. Bürgi, Nat. Commun., 2012, 3, 798 CrossRef PubMed.
- S. Knoppe, I. Dolamic and T. Bürgi, J. Am. Chem. Soc., 2012, 134, 13114–13120 CrossRef CAS PubMed.
- B. Varnholt, I. Dolamic, S. Knoppe and T. Bürgi, Nanoscale, 2013, 5, 9568–9571 RSC.
- S. Knoppe, R. Azoulay, A. Dass and T. Bürgi, J. Am. Chem. Soc., 2012, 134, 20302–20305 CrossRef CAS PubMed.
- S. Knoppe, S. Michalet and T. Bürgi, J. Phys. Chem. C, 2013, 117, 15354–15361 CrossRef CAS.
- K. Soai, T. Shibata, H. Morioka and K. Choji, Nature, 1995, 378, 767–768 CrossRef CAS.
- Tokyo University of Science, Jpn. Pat, P2018-135292A, 2018 Search PubMed.
- L. Beqa, D. Deschamps, S. Perrio, A.-C. Gaumont, S. Knoppe and T. Bürgi, J. Phys. Chem. C, 2013, 117, 21619–21625 CrossRef CAS.
- I. Dolamic, B. Varnholt and T. Bürgi, Nat. Commun., 2015, 6, 7117 CrossRef CAS PubMed.
- S. Jin, F. Xu, W. Du, X. Kang, S. Chen, J. Zhang, X. Li, D. Hu, S. Wang and M. Zhu, Inorg. Chem., 2018, 57, 5114–5119 CrossRef CAS PubMed.
- R. Kazan, B. Zhang and T. Bürgi, Dalton Trans., 2017, 46, 7708–7713 RSC.
- N. Barrabés, B. Zhang and T. Bürgi, J. Am. Chem. Soc., 2014, 136, 14361–14364 CrossRef.
- X. Liu, J. Yuan, J. Chen, J. Yang and Z. Wu, Part. Part. Syst. Charact., 2019, 36, 1900003 CrossRef.
- A. Sels, N. Barrabés, S. Knoppe and T. Bürgi, Nanoscale, 2016, 8, 11130–11135 RSC.
- A. Sels, G. Salassa, S. Pollitt, C. Guglieri, G. Rupprechter, N. Barrabés and T. Bürgi, J. Phys. Chem. C, 2017, 121, 10919–10926 CrossRef CAS.
- S. Knoppe, I. Dolamic, A. Dass and T. Bürgi, Angew. Chem., Int. Ed., 2012, 51, 7589–7591 CrossRef CAS PubMed.
- B. Varnholt, R. Letrun, J. J. Bergkamp, Y. Fu, O. Yushchenko, S. Decurtins, E. Vauthey, S.-X. Liu and T. Bürgi, Phys. Chem. Chem. Phys., 2015, 17, 14788–14795 RSC.
- B. Zhang and T. Bürgi, J. Phys. Chem. C, 2016, 120, 4660–4666 CrossRef CAS.
- A. Ushiyama, S. Hiroto, J. Yuasa, T. Kawai and H. Shinokubo, Org. Chem. Front., 2017, 4, 664–667 RSC.
- N. Yan, N. Xia, L. Liao, M. Zhu, F. Jin, R. Jin and Z. Wu, Sci. Adv., 2018, 4, eaat7259 CrossRef CAS PubMed.
- A. Ghosh, J. Hassinen, P. Pulkkinen, H. Tenhu, R. H. A. Ras and T. Pradeep, Anal. Chem., 2014, 86, 12185–12190 CrossRef CAS PubMed.
- C. Yao, J. Chen, M.-B. Li, L. Liu, J. Yang and Z. Wu, Nano Lett., 2015, 15, 1281–1287 CrossRef CAS PubMed.
- S. Tian, Y.-Z. Li, M.-B. Li, J. Yuan, J. Yang, Z. Wu and R. Jin, Nat. Commun., 2015, 6, 8667 CrossRef CAS PubMed.
- S. Tian, C. Yao, L. Liao, N. Xia and Z. Wu, Chem. Commun., 2015, 51, 11773–11776 RSC.
- L. Liao, C. Yao, C. Wang, S. Tian, J. Chen, M.-B. Li, N. Xia, N. Yan and Z. Wu, Anal. Chem., 2016, 88, 11297–11301 CrossRef CAS PubMed.
- Q. Yao, V. Fung, C. Sun, S. Huang, T. Chen, D.-e. Jiang, J. Y. Lee and J. Xie, Nat. Commun., 2018, 9, 1979 CrossRef PubMed.
- D. R. Stoll and P. W. Carr, J. Am. Chem. Soc., 2005, 127, 5034–5035 CrossRef CAS PubMed.
| This journal is © The Royal Society of Chemistry 2020 |


