 Open Access Article
Efficient cell surface labelling of live zebrafish embryos: wash-free fluorescence imaging for cellular dynamics tracking and nanotoxicity evaluation†
Hao-Ran
Jia‡
,
Ya-Xuan
Zhu‡
,
Ke-Fei
Xu
,
Guang-Yu
Pan
,
Xiaoyang
Liu
,
Ying
Qiao
and
Fu-Gen
Wu
 *
*
State Key Laboratory of Bioelectronics, School of Biological Science and Medical Engineering, Southeast University, Nanjing, 210096, P. R. China. E-mail: wufg@seu.edu.cn
First published on 25th February 2019
Abstract
Imaging the dynamics and behaviors of plasma membranes is at the leading edge of life science research. We report here the development of a universal red-fluorescent probe Chol–PEG–Cy5 for wash-free plasma membrane labelling both in vitro and in vivo. In aqueous solutions, the fluorescence of Chol–PEG–Cy5 is significantly quenched due to the intermolecular resonance energy transfer (RET) between neighbouring Cy5 moieties; however, upon membrane anchoring, the probes undergo lateral diffusion in lipid bilayers, resulting in weakened RET and turn-on fluorescence emission. We demonstrate that Chol–PEG–Cy5 enables rapid, stable and high-quality in vitro cell surface imaging in a variety of mammalian cells. Additionally, with the assistance of three-dimensional (3D) image reconstruction, we achieve for the first time the whole-mount in situ fluorescence imaging of the epidermal cell surfaces of live zebrafish embryos, which cannot be realized by conventional plasma membrane probes due to the presence of the surface-covering mucus barrier. This novel technique encourages us to track the cellular dynamics of the epidermis during embryonic development with 3D visualization. Moreover, we also develop a new method to evaluate the epidermal toxicity of nanomaterials (e.g., gold nanoparticles and graphene oxide nanosheets) toward zebrafish embryos using this fluorescent probe.
Introduction
The past decades have witnessed the rapid progress of fluorescence imaging techniques as powerful tools for both biosensing and optical visualization at cellular, subcellular and molecular levels.1,2 One of the most attractive but also challenging parts of the techniques lies in the design of fluorescent probes with desirable functionalities. To date, various fluorescent probes have been developed for different purposes, such as targeting selective molecules and ions for biosensing,3–9 or labelling specific cellular organelles and structures.10–14 Plasma membranes play essential roles in controlling many sophisticated cell behaviors, e.g., cellular communication and signaling, exosome secretion and endocytosis. Thus, utilizing reliable fluorescent probes to dynamically track plasma membrane-related biomarkers and biological events is becoming a focus.15–19 Many researchers including our group have prepared a series of plasma membrane probes from small organic molecules to proteins or nanoparticles,20–25 achieving broad biological applications. However, most of the developed fluorescent dyes require a washing step to improve the signal-to-background (S/B) contrast by removing unbound dyes, which is tedious and inconvenient, especially for staining suspension cells. More importantly, the washing treatment inevitably changes the original extracellular environment and may compromise the fidelity of the obtained imaging results in some experiments.20 Unfortunately, in spite of a few reported studies,20–22 the development of wash-free plasma membrane stains is still largely unexplored.Another urgently demanded imaging technique is in situ plasma membrane labelling in living multicellular organisms. Among various model animals, zebrafish embryos, due to their optical transparency, rapid maturation and easy manipulation, have been widely recognized as an ideal organism for monitoring the location and dynamics of some key biomolecules,26–28 and for visualizing organs, vessels as well as subcellular organelles.29–31 For example, Bertozzi et al. realized in vivo systemic imaging of membrane-associated glycans in zebrafish via bioorthogonal chemistry.32,33 Nonetheless, general plasma membrane labelling techniques for the fluorescence imaging of zebrafish are extremely lacking. Currently available strategies include (i) creating transgenic fish lines that express fluorescent proteins on plasma membranes and (ii) fixing zebrafish for immunofluorescence staining.34,35 The drawbacks of these methods are evident since the former is time- and labour-consuming and the latter fails to realize dynamic observations. Therefore, it is imperative to develop a fluorescent probe that can realize rapid, simple and in situ plasma membrane labelling in live zebrafish embryos. Moreover, considering that a washing step is usually infeasible under in vivo conditions, the development of a wash-free in vivo imaging technique is particularly desirable.
In this work, we rationally designed a red-fluorescent probe for wash-free plasma membrane imaging of mammalian cells and the zebrafish embryonic epidermis (Scheme 1). The probe was fabricated via one-step synthesis by conjugating cyanine5 N-hydroxysuccinimide ester (NHS-Cy5) with a cholesterol–poly(ethylene glycol)2k–NH2 (Chol–PEG–NH2) polymer. The as-formed Chol–PEG–Cy5 consists of a hydrophobic cholesterol anchor for membrane insertion, a hydrophilic PEG spacer for ensuring water solubility, and a fluorophore Cy5. The fluorescence of Chol–PEG–Cy5 is significantly quenched in aqueous solutions due to the strong intermolecular resonance energy transfer (RET) between neighbouring Cy5 moieties. Upon membrane binding, however, the fluidity of lipid bilayers drives the anchored probes to undergo lateral diffusion, which effectively breaks the Cy5–Cy5 interaction and leads to enhanced fluorescence emission. The Chol–PEG–Cy5 probe not only enables wash-free plasma membrane imaging of various mammalian cells in vitro, but also achieves rapid and noninvasive labelling of epidermal cell membranes of live zebrafish embryos. Different from isolated cells, the epidermal cells of zebrafish embryos are covered by a protective mucus layer that can prevent most hydrophobic dyes from encountering plasma membranes; however, Chol–PEG–Cy5 with a hydrophilic PEG chain easily interacts with the surface layer and substantially stains the inner plasma membranes. More importantly, this probe can visualize the embryonic development of zebrafish and reflect the in vivo toxicity of different nanomaterials. To the best of our knowledge, this work may present the first example of developing a wash-free red-fluorescent probe for both in vitro and in vivo plasma membrane imaging.
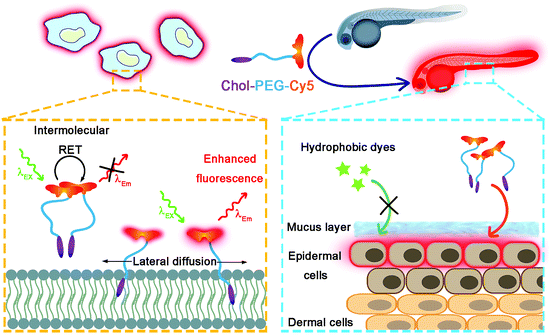 | ||
| Scheme 1 Schematic illustration of wash-free fluorescence imaging of plasma membranes in vitro and whole-mount fluorescence labelling of epidermal cells in zebrafish embryos using Chol–PEG–Cy5. | ||
Results and discussion
Characterization of Chol–PEG–Cy5
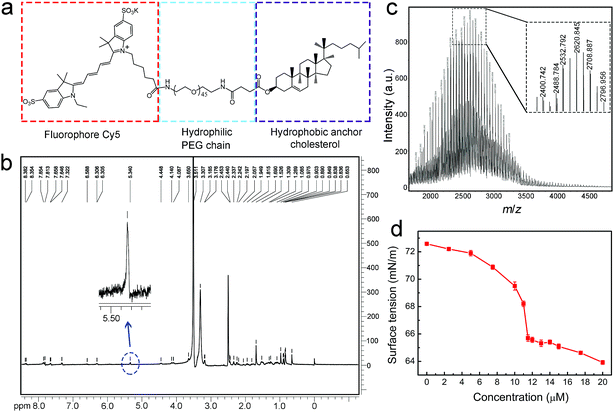
The molecular structure of the designed Chol–PEG–Cy5 is shown in Fig. 1a. We first validated the successful synthesis of the probe using 1H nuclear magnetic resonance (NMR) spectroscopy (Fig. 1b and S1†) and matrix-assisted laser desorption/ionization time-of-flight (MALDI-TOF) mass spectrometry (Fig. 1c). The average molecular weight of Chol–PEG–Cy5 was measured to be 2621 ± 800 Da. Due to the amphiphilicity of this compound, Chol–PEG–Cy5 could form self-assembled nanoparticles in aqueous solutions, as displayed in the transmission electron microscopy image (Fig. S2†), with an average hydrodynamic size of 21.7 nm according to the dynamic light scattering result (Fig. S3†). The critical micelle concentration (CMC) of Chol–PEG–Cy5 was determined to be around 11.5 μM (Fig. 1d).In vitro plasma membrane imaging
It is well known that cholesterol is an excellent hydrophobic membrane anchor and suitable for cell surface modification.24,25,36,37 Due to the high affinity of cholesterol moieties for lipid bilayers, especially lipid rafts,38 only 0.2 μM Chol–PEG–Cy5 could label the cell surface, as evidenced by the red fluorescence-labelled cell boundaries, and 2 μM was enough to confer high-quality plasma membrane imaging because higher concentrations could cause an overstaining of the membranes (Fig. S4†). It was observed that Chol–PEG–Cy5 was stably retained on the cell surfaces for at least 2 h before being partially internalized (Fig. S5†). This performance surpasses that of commercial plasma membrane stains such as DiD and CellMask which have relatively short retention time on plasma membranes (Fig. S6†). The amount of plasma membrane-bound Chol–PEG–Cy5 molecules increased in a time-dependent manner, as suggested by the quantitative flow cytometric results (Fig. S7†). In addition, the Chol–PEG–Cy5 probe achieved universal plasma membrane labelling of different types of mammalian cells including AT II (alveolar epithelial cells), MCF-7 (human breast cancer cells), HepG2 (human liver cancer cells) and U14 (murine cervical cancer cells) (Fig. S8†). It should be noted that this probe is only applicable to live cells rather than fixed, permeabilized, or dead ones (e.g., doxorubicin-induced apoptotic cells), because plasma membranes with compromised integrity allow the dyes to enter the cells and substantially stain the cytoplasm (Fig. S9†).Wash-free imaging mechanism of Chol–PEG–Cy5
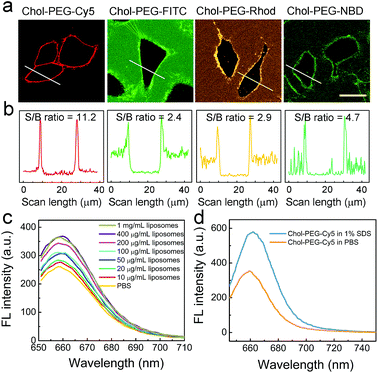
Typically, the plasma membrane-unbound Chol–PEG–Cy5 probes should be removed by phosphate-buffered saline (PBS) washing, which ensured a high S/B imaging contrast (Fig. S10†). Surprisingly, it was found that skipping the PBS washing step during Chol–PEG–Cy5 staining did not result in severe background interference to the final fluorescence imaging result (Fig. 2a). We believe that the wash-free imaging is closely related to the fluorescence property of Cy5. To confirm this, Chol–PEG–fluorescein (Chol–PEG–FITC) and Chol–PEG–nitrobenzoxadiazole (Chol–PEG–NBD) were purchased and Chol–PEG–rhodamine (Chol–PEG–Rhod) was synthesized. The molecular structures of these probes are shown in Fig. S11.† These stains all failed to achieve satisfactory wash-free imaging of plasma membranes (Fig. 2a) due to their strong background fluorescence signals, resulting in considerably low S/B ratios (Fig. 2b). To unveil the underlying mechanism, we employed 1-palmitoyl-2-oleoyl-sn-glycero-3-phosphocholine (POPC) liposomes as model cell membranes for fluorescence spectroscopic analysis. Interestingly, the fluorescence intensity of Chol–PEG–Cy5 in different concentrations of liposome solutions exhibited a liposomal concentration-dependent increase (Fig. 2c). The slightly increased hydrodynamic size (from 101.5 to 111.9 nm) of liposomes after incubation with Chol–PEG–Cy5 implied that the probes were hydrophobically bound to the surface of liposomes (Fig. S12†). In contrast, the other three membrane-anchorable probes showed a negligible or only a slight fluorescence increase in liposome solutions (Fig. S13†). It should be noted that the plasma membrane binding abilities of the four probes were basically equal (Fig. S14†), and therefore the membrane responsiveness of Chol–PEG–Cy5 was dominantly ascribed to the unique fluorescence property of Cy5. It has been reported that Cy5 can form stable dimers in aqueous solutions, resulting in fluorescence quenching due to the RET between two neighbouring Cy5 molecules.39 We deduce that the Cy5 moiety in Chol–PEG–Cy5 may share the same quenching mechanism. As expected, the fluorescence intensity of the probe showed an evident increase after the treatment with sodium dodecyl sulfate (SDS, 1%), a surfactant that can break the Cy5–Cy5 interaction,39 demonstrating the intermolecular RET-induced partial fluorescence quenching (Fig. 2d). Besides, based on a previous report,39 the decrease of the peak at ∼600 nm and the increase of the peak at ∼650 nm in the ultraviolet-visible spectra of Chol–PEG–Cy5 solutions in the absence and presence of SDS confirmed the transformation of Cy5 moieties from dimers to monomers (Fig. S15†). The quenching effect was not ascribed to the formation of micelles because the staining concentration of Chol–PEG–Cy5 (2 μM) was far below its CMC. We reason that when the hydrophobic cholesterol moieties of Chol–PEG–Cy5 molecules are anchored onto lipid membranes, the probes undergo lateral diffusion due to the fluidity of the lipid bilayers, as proved by our fluorescence recovery after photobleaching analysis (Fig. S16†). The compacted neighbouring Cy5 moieties are dissociated during this dynamic process and then regain their fluorescence with weakened intermolecular RET. We also studied the dose-dependent cytotoxicity of Chol–PEG–Cy5 toward AT II cells and no significant cell death was observed at 20 μM after incubation for 24 h (Fig. S17†), demonstrating its good safety for in vitro cell staining.Whole-mount labelling of epidermal cell membranes of zebrafish embryos
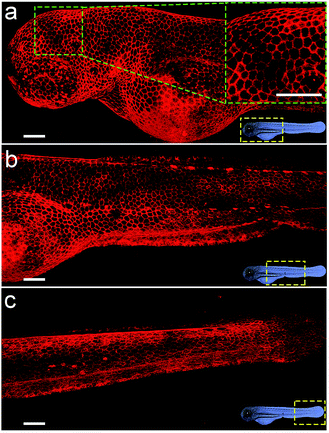
Considering the deep red fluorescence emission (∼670 nm) of Cy5, the Chol–PEG–Cy5 probe may be suitable for in vivo fluorescence imaging, because long wavelength-emitting dyes can minimize both the phototoxicity to biological samples and the background autofluorescence of cells and tissues.40 To investigate this feasibility, we began by bathing zebrafish embryos at 48 hpf (hours post fertilization) in Chol–PEG–Cy5-containing media (2 μM) for 15 min. Confocal z-stack fluorescence images at different focal planes reveal that the probes were confined to the skin of the embryo without further entering the interior and clearly stained the contours of skin cells (Fig. S18†). During embryonic developmental stages, the zebrafish skin consists of an outer layer (epidermis) and an inner layer (dermis),41 and thus Chol–PEG–Cy5 realized the plasma membrane labelling of epidermal cells (or skin epithelial cells). We then carried out three-dimensional (3D) image reconstruction for better observation. Strikingly, the Chol–PEG–Cy5 probes clearly visualized the boundary of every single cell residing on the surface of the embryo, achieving excellent whole-mount plasma membrane labelling of the zebrafish embryonic epidermis (Fig. 3). For comparison, we also investigated the staining performance of DiD and CellMask Green on zebrafish embryos. However, the embryos were scarcely or only partially stained by these dyes (Fig. S19†). Generally, the skin of zebrafish is covered by mucus which is a complex hydrogel and can serve as a barrier to lipophilic substances to protect the underlying tissues.42,43 In this regard, the above hydrophobic dyes are difficult to penetrate the hydrophilic mucus layer on the surface of zebrafish embryos, while Chol–PEG–Cy5 with a hydrophilic PEG segment can easily cross the mucus and target the skin epithelial cells for plasma membrane labelling. The staining time of Chol–PEG–Cy5 was optimized to be 15 min to 2 h, and an incubation period longer than 3 h allowed the probes to be internalized by epithelial cells and thus compromised their imaging performance (Fig. S20†). It should be noted that the fluorescent probe is only applicable to hatched embryos because it cannot penetrate the chorion of unhatched ones (Fig. S21†).Cellular dynamics tracking with 3D visualization
We envision that the above 3D fluorescence imaging of the zebrafish embryonic epidermis may possess broad biological applications. Recently, studies on the embryonic development of zebrafish have attracted much attention, as they are very important to decipher the underlying mechanism of various human genetic diseases.44 Hence, as a proof-of-concept, we attempt to monitor the cellular dynamics of the epidermis during the ocular development of zebrafish embryos using Chol–PEG–Cy5. Zebrafish embryos/larvae at different developmental stages (28, 40, 72 and 96 hpf) were bathed in Chol–PEG–Cy5-containing media. It was found that the anterior surface of the eyes at 28 and 40 hpf was uniformly covered by a layer of epithelial cells (Fig. 4a and b). Additionally, the morphology of the cells in the eye regions showed no discernible differences compared to that in other parts of the epidermis (Fig. S22†). This observation is consistent with some reported conclusions that the anterior cells covering the cornea are a group of undifferentiated epithelial cells in early developed embryos.45,46 As the development progressed, several heavily stained red dots (marked by white arrows) started to appear (Fig. 4c). We reason that these dots represent dead cells on the basis of the previous in vitro imaging results, as the probes could easily cross their deficient plasma membranes. Expectedly, relevant studies have demonstrated that cell apoptosis typically occurs in the cornea of embryos to facilitate the detachment of the developing lens from the surface.45–47 At 96 hpf, the peripheral eye region could not be clearly labelled using Chol–PEG–Cy5 (Fig. 4d), possibly due to the presence of collagenous lamellae over the epithelium for eye protection.47 Electron microscopy has been used to investigate the ocular development of zebrafish embryos,45–47 but it requires laborious embedding and sectioning procedures and is limited to two-dimensional views. In this system, the fluorescent probe Chol–PEG–Cy5 enables us to dynamically track this development process in a noninvasive manner, with 3D visualization and in real time, intuitively unveiling the fate of epithelial cells during the maturation of the zebrafish visual system. With these advantages, this imaging technique may open new doors for the study of zebrafish embryonic development.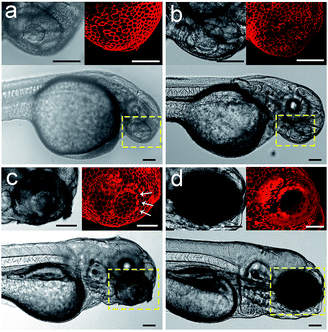 | ||
| Fig. 4 Confocal images of Chol–PEG–Cy5-stained zebrafish embryos at (a) 28, (b) 40, (c) 72 and (d) 96 hpf. The yellow dotted rectangles indicate the eye regions of embryos. Scale bars = 100 μm. | ||
Epidermal toxicity of nanomaterials toward zebrafish embryos
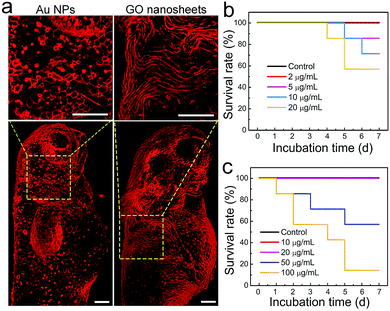
Another application of zebrafish is to serve as a reliable in vivo model for toxicity studies because of their inexpensiveness, rapid maturation and high homology to the human genome.48 In particular, zebrafish have been widely used to evaluate the biocompatibility and toxicity of various nanomaterials, such as metal nanoparticles (NPs), silica NPs and upconversion NPs.49–52 Generally, the forms of toxicity studies in zebrafish include developmental toxicity, cardiotoxicity, nephrotoxicity, hepatotoxicity and genotoxicity.53 However, the toxic effect of external nanomaterials on the zebrafish epidermis was largely unexplored. This issue is undoubtedly worth investigating because the epidermis, the outermost tissue layer, acts as the first barrier of zebrafish to aquatic infections and is a crucial part of the fish mucosal immune system.42 Given that Chol–PEG–Cy5 can clearly label the zebrafish epidermis, it may be suitable to evaluate the epidermal toxic effect of nanomaterials, e.g., Au NPs and graphene oxide (GO) nanosheets. Next, zebrafish embryos in the gastrula period (7 hpf) were cultured in embryo media containing various concentrations of Au NPs (∼50 nm) or GO nanosheets (∼200 nm), and then were subjected to Chol–PEG–Cy5 staining at 72 hpf which is typically recognized as the end of the embryonic stage. We surprisingly observed that many bright red dots occurred on the surface of embryos after treatment with Au NPs and the number of dots increased in a concentration-dependent manner (Fig. S23†). As we explained previously, the red dots were actually heavily stained dead cells, which can be clearly observed in Fig. 5a. These results explicitly demonstrate the potential long-term toxicity of Au NPs toward the epidermal cells of zebrafish embryos. Regarding GO nanosheets, similar phenomena were found at high GO concentrations (Fig. S20†). Interestingly, we occasionally observed that in a proportion of treated embryos, the morphology of some epidermal cells became severely twisted and deformed (Fig. 5a). This morphological abnormality of epidermal cells implies the possible side effects of GO nanosheets on the epidermal development of embryos. The survival rates of treated embryos/larvae were recorded for a week, revealing that 5 μg mL−1 Au NPs or 50 μg mL−1 GO nanosheets could induce mortality in zebrafish (Fig. 5b and c). Based on the above observations, we believe that the epidermal damage caused by these nanomaterials contributes to the final death of the zebrafish.Conclusions
In summary, we developed a red-fluorescent probe Chol–PEG–Cy5 for wash-free plasma membrane labelling both in vitro and in vivo. The probes dissolved in aqueous solutions were significantly quenched due to the intermolecular RET between neighbouring Cy5 moieties; however, after membrane anchoring, the probes underwent lateral diffusion in lipid bilayers and the compacted Cy5 moieties were dissociated with weakened RET, thereby realizing enhanced fluorescence and high S/B contrast. The deep-red fluorescence emission and wash-free properties of the probe are particularly beneficial for in vivo imaging applications. Using Chol–PEG–Cy5, we achieved for the first time the whole-mount in situ labelling of epidermal cell membranes of live zebrafish embryos via a simple bathing method. Compared with commercial hydrophobic plasma membrane stains, this probe could easily cross the mucus-covered surface of embryos. The superb in vivo plasma membrane imaging guaranteed the tracking of the cellular dynamics of the epidermis during the development of zebrafish embryos/larvae with 3D visualization, in real time and in a noninvasive manner, showing great advantages over traditional imaging techniques. The rapid and clear whole-embryo epidermal imaging also inspired us to evaluate the epidermal toxicity of nanomaterials such as Au NPs and GO nanosheets toward zebrafish embryos, providing a new perspective for nanotoxicity studies. Overall, we believe that this general plasma membrane labelling probe will find more biomedical applications in the near future.Conflicts of interest
There are no conflicts to declare.Acknowledgements
The financial support of the grants from the National Natural Science Foundation of China (21673037), the Natural Science Foundation of Jiangsu Province (BK20170078) and the Scientific Research Foundation of Graduate School of Southeast University (YBPY1874) is gratefully acknowledged.Notes and references
- T. Kowada, H. Maeda and K. Kikuchi, Chem. Soc. Rev., 2015, 44, 4953 RSC.
- H. Zhu, J. L. Fan, J. J. Du and X. J. Peng, Acc. Chem. Res., 2016, 49, 2115 CrossRef CAS PubMed.
- H. W. Liu, L. L. Chen, C. Y. Xu, Z. Li, H. Y. Zhang, X. B. Zhang and W. H. Tan, Chem. Soc. Rev., 2018, 47, 7140 RSC.
- H. Liang, X. B. Zhang, Y. F. Lv, L. Gong, R. W. Wang, X. Y. Zhu, R. H. Yang and W. H. Tan, Acc. Chem. Res., 2014, 47, 1891 CrossRef CAS PubMed.
- X. D. Zhang, F. G. Wu, P. D. Liu, N. Gu and Z. Chen, Small, 2014, 10, 5170 CAS.
- G. Gao, Y. W. Jiang, H. R. Jia, J. J. Yang and F. G. Wu, Carbon, 2018, 134, 232 CrossRef CAS.
- S. Leng, Q. L. Qiao, L. Miao, W. G. Deng, J. N. Cui and Z. C. Xu, Chem. Commun., 2017, 53, 6448 RSC.
- L. Yuan, L. Wang, B. K. Agrawalla, S. J. Park, H. Zhu, B. Sivaraman, J. J. Peng, Q. H. Xu and Y. T. Chang, J. Am. Chem. Soc., 2015, 137, 5930 CrossRef CAS PubMed.
- X. M. Liu and G. L. Liang, Chem. Commun., 2017, 53, 1037 RSC.
- H. H. He, Z. W. Ye, Y. Zheng, X. Xu, C. L. Guo, Y. Xiao, W. Yang, X. H. Qian and Y. J. Yang, Chem. Commun., 2018, 54, 2842 RSC.
- X. K. Chen, X. D. Zhang, L. Y. Xia, H. Y. Wang, Z. Chen and F. G. Wu, Nano Lett., 2018, 18, 1159 CrossRef CAS PubMed.
- Y. Liu, J. Zhou, L. L. Wang, X. X. Hu, X. J. Liu, M. R. Liu, Z. H. Cao, D. H. Shangguan and W. H. Tan, J. Am. Chem. Soc., 2016, 138, 12368 CrossRef CAS PubMed.
- D. Pan, Z. Hu, F. W. Qiu, Z. L. Huang, Y. L. Ma, Y. N. Wang, L. S. Qin, Z. H. Zhang, S. Q. Zeng and Y. H. Zhang, Nat. Commun., 2014, 5, 5573 CrossRef CAS PubMed.
- Y. B. Han, M. H. Li, F. W. Qiu, M. Zhang and Y. H. Zhang, Nat. Commun., 2017, 8, 1307 CrossRef PubMed.
- X. F. Zhang, B. L. Wang, Y. Xiao, C. Wang and L. He, Analyst, 2018, 143, 4180 RSC.
- H. M. Wang, Z. Q. Q. Feng, S. J. Del Signore, A. A. Rodal and B. Xu, J. Am. Chem. Soc., 2018, 140, 3505 CrossRef CAS PubMed.
- Z. Q. Q. Feng, H. M. Wang, S. Y. Wang, Q. Zhang, X. X. Zhang, A. A. Rodal and B. Xu, J. Am. Chem. Soc., 2018, 140, 9566 CrossRef CAS PubMed.
- M. X. You, Y. F. Lyu, D. Han, L. P. Qiu, Q. L. Liu, T. Chen, C. C. S. Wu, L. Peng, L. Q. Zhang, G. Bao and W. H. Tan, Nat. Nanotechnol., 2017, 12, 453 CrossRef CAS PubMed.
- X. F. Zhang, C. Wang, L. J. Jin, Z. Han and Y. Xiao, ACS Appl. Mater. Interfaces, 2014, 6, 12372 CrossRef CAS PubMed.
- D. Wang, H. F. Su, R. T. K. Kwok, X. L. Hu, H. Zou, Q. X. Luo, M. M. S. Lee, W. H. Xu, J. W. Y. Lam and B. Z. Tang, Chem. Sci., 2018, 9, 3685 RSC.
- E. Prifti, L. Reymond, M. Umebayashi, R. Hovius, H. Riezman and K. Johnsson, ACS Chem. Biol., 2014, 9, 606 CrossRef CAS PubMed.
- Y. Hori, K. Nakaki, M. Sato, S. Mizukami and K. Kikuchi, Angew. Chem., Int. Ed., 2012, 51, 5611 CrossRef CAS PubMed.
- M. Matsuda, W. Hatanaka, M. Takeo, C. W. Kim, T. Niidome, T. Yamamoto, A. Kishimura, T. Mori and Y. Katayama, Bioconjugate Chem., 2014, 25, 2134 CrossRef CAS PubMed.
- H. Y. Wang, H. R. Jia, X. L. Lu, B. Chen, G. X. Zhou, N. Y. He, Z. Chen and F. G. Wu, J. Mater. Chem. B, 2015, 3, 6165 RSC.
- H. R. Jia, H. Y. Wang, Z. W. Yu, Z. Chen and F. G. Wu, Bioconjugate Chem., 2016, 27, 782 CrossRef CAS PubMed.
- S. K. Ko, X. Q. Chen, J. Yoon and I. Shin, Chem. Soc. Rev., 2011, 40, 2120 RSC.
- H. J. Zhu, Y. Fang, X. Zhen, N. Wei, Y. Gao, K. Q. Luo, C. J. Xu, H. W. Duan, D. Ding, P. Chen and K. Y. Pu, Chem. Sci., 2016, 7, 5118 RSC.
- M. D. Hammers, M. J. Taormina, M. M. Cerda, L. A. Montoya, D. T. Seidenkranz, R. Parthasarathy and M. D. Pluth, J. Am. Chem. Soc., 2015, 137, 10216 CrossRef CAS PubMed.
- M. Santra, D. Ryu, A. Chatterjee, S. K. Ko, I. Shin and K. H. Ahn, Chem. Commun., 2009, 2115 RSC.
- N. D. Lawson and B. M. Weinstein, Dev. Biol., 2002, 248, 307 CrossRef CAS PubMed.
- B. Situ, S. J. Chen, E. G. Zhao, C. W. T. Leung, Y. L. Chen, Y. N. Hong, J. W. Y. Lam, Z. L. Wen, W. Liu, W. Q. Zhang, L. Zheng and B. Z. Tang, Adv. Funct. Mater., 2016, 26, 7132 CrossRef CAS.
- S. T. Laughlin, J. M. Baskin, S. L. Amacher and C. R. Bertozzi, Science, 2008, 320, 664 CrossRef CAS PubMed.
- P. Agarwal, B. J. Beahm, P. Shieh and C. R. Bertozzi, Angew. Chem., Int. Ed., 2015, 54, 11504 CrossRef CAS PubMed.
- H. Blaser, M. Reichman-Fried, I. Castanon, K. Dumstrei, F. L. Marlow, K. Kawakami, L. Solnica-Krezel, C. P. Heisenberg and E. Raz, Dev. Cell, 2006, 11, 613 CrossRef CAS PubMed.
- S. E. Lepage, M. Tada and A. E. E. Bruce, Dev. Biol., 2014, 385, 52 CrossRef CAS PubMed.
- H. R. Jia, Y. X. Zhu, K. F. Xu, X. Y. Liu and F. G. Wu, J. Controlled Release, 2018, 286, 103 CrossRef CAS PubMed.
- H. R. Zope, F. Versluis, A. Ordas, J. Voskuhl, H. P. Spaink and A. Kros, Angew. Chem., Int. Ed., 2013, 52, 14247 CrossRef CAS PubMed.
- W. H. Binder, V. Barragan and F. M. Menger, Angew. Chem., Int. Ed., 2003, 42, 5802 CrossRef CAS PubMed.
- H. J. Gruber, C. D. Hahn, G. Kada, C. K. Riener, G. S. Harms, W. Ahrer, T. G. Dax and H. G. Knaus, Bioconjugate Chem., 2000, 11, 696 CrossRef CAS PubMed.
- Z. Q. Guo, S. Park, J. Yoon and I. Shin, Chem. Soc. Rev., 2014, 43, 16 RSC.
- Q. L. Li, M. Frank, C. I. Thisse, B. V. Thisse and J. Uitto, J. Invest. Dermatol., 2011, 131, 565 CrossRef CAS PubMed.
- M. Á. Esteban and R. Cerezuela, Mucosal Health in Aquaculture, Academic Press, 2015, p. 67 Search PubMed.
- H. H. Sigurdsson, J. Kirch and C. M. Lehr, Int. J. Pharm., 2013, 453, 56 CrossRef CAS PubMed.
- G. J. Lieschke and P. D. Currie, Nat. Rev. Genet., 2007, 8, 353 CrossRef CAS PubMed.
- A. S. Glass and R. Dahm, Ophthalmic Res., 2004, 36, 4 CrossRef PubMed.
- K. A. Soules and B. A. Link, BMC Dev. Biol., 2005, 5, 12 CrossRef PubMed.
- X. P. C. Zhao, R. W. Yee, E. Norcom, H. Burgess, A. S. Avanesov, J. P. Barrish and J. Malicki, Invest. Ophthalmol. Visual Sci., 2006, 47, 4341 CrossRef PubMed.
- A. J. Hill, H. Teraoka, W. Heideman and R. E. Peterson, Toxicol. Sci., 2005, 86, 6 CrossRef CAS PubMed.
- P. V. Asharani, Y. Lianwu, Z. Y. Gong and S. Valiyaveettil, Nanotoxicology, 2011, 5, 43 CrossRef CAS PubMed.
- K. J. Lee, P. D. Nallathamby, L. M. Browning, C. J. Osgood and X. H. N. Xu, ACS Nano, 2007, 1, 133 CrossRef CAS PubMed.
- T. P. Liu, S. H. Wu, Y. P. Chen, C. M. Chou and C. T. Chen, Nanoscale, 2015, 7, 6471 RSC.
- Y. Sun, W. Feng, P. Y. Yang, C. H. Huang and F. Y. Li, Chem. Soc. Rev., 2015, 44, 1509 RSC.
- S. Chakravarthy, S. Sadagopan, A. Nair and S. K. Sukumaran, Zebrafish, 2014, 11, 154 CrossRef PubMed.
Footnotes |
| † Electronic supplementary information (ESI) available: Experimental details, Fig. S1–S23. See DOI: 10.1039/c8sc04884c |
| ‡ These authors contributed equally to this work. |
| This journal is © The Royal Society of Chemistry 2019 |

