
 Open Access Article
 This Open Access Article is licensed under a
 Creative Commons Attribution 3.0 Unported Licence
Probing the interaction of nanoparticles with small molecules in real time via quartz crystal microbalance monitoring†
Ye
Yang
 a,
Guillaume
Poss
b,
Yini
Weng
a,
Runzhang
Qi
a,
Hanrui
Zheng
a,
Nikolaos
Nianias
c,
Euan R.
Kay
b and
Stefan
Guldin
*a
a,
Guillaume
Poss
b,
Yini
Weng
a,
Runzhang
Qi
a,
Hanrui
Zheng
a,
Nikolaos
Nianias
c,
Euan R.
Kay
b and
Stefan
Guldin
*a
aDepartment of Chemical Engineering, University College London, Torrington Place, London, WC1E 7JE, UK. E-mail: s.guldin@ucl.ac.uk
bEaStCHEM School of Chemistry, University of St Andrews, St Andrews, KY16 9ST, UK
cInstitute of Materials, École Polytechnique Fédérale de Lausanne (EPFL), Station 12, 1015 Lausanne, Switzerland
First published on 27th May 2019
Abstract
Despite extensive advances in the field of molecular recognition, the real-time monitoring of small molecule binding to nanoparticles (NP) remains a challenge. To this end, we report on a versatile approach, based on quartz crystal microbalance with dissipation monitoring, for the stepwise in situ quantification of gold nanoparticle (AuNPs) immobilisation and subsequent uptake and release of binding partners. AuNPs stabilised by thiol-bound ligand shells of prescribed chemical composition were densely immobilised onto gold surfaces via dithiol linkers. The boronate ester formation between salicylic acid derivatives in solution and boronic acids in the AuNP ligand shell was then studied in real time, revealing a drastic effect of both ligand architecture and Lewis base concentration on the interaction strength. The binding kinetics were analysed with frequency response modelling for a thorough comparison of binding parameters including relaxation time as well as association rate constant. The results directly mirror those from previously reported in-depth studies using nuclear magnetic resonance spectroscopy. By achieving quantitative characterisation of selective binding of analytes with molecular weight below 300 Da, this new method enables rapid, low cost, rational screening of AuNP candidates for molecular recognition.
1. Introduction
Besides offering highly controllable sizes, shapes and optical properties, gold nanoparticles (AuNPs) can be prepared with various surface functionalities for the selective interaction with antibodies, peptides, proteins, drugs and other small molecules.1–6 Thiol-based surface stabilisation provides a vast library of ligands with functional groups such as alcohols, carboxylic acids, amino acids, and anions/cations.7–9 The self-assembly of ligand shells with biotic and abiotic molecules enables bottom-up morphology control at the nanoscale to study the structure–property-function interplay with biological entities.10–13 In analogy to biomolecular recognition prevalent in many biological processes,14,15 AuNPs have been developed for molecular recognition as well as drug delivery, alongside other synthetic supramolecular systems, such as nanocarriers and artificial molecular machines.16–18The screening of the affinity and selectivity of specifically designed AuNP ligand shells towards molecular targets is essential for any of the above mentioned applications. A number of characterisation techniques have been developed based on different transduction principles, such as optical, acoustic and calorimetric read-out.19 Molecular labelling, as often used in fluorescence and Raman-based spectroscopy, restricts the choice of materials and may also interfere with the target study.20 A label-free alternative is based on surface plasmon resonance (SPR), which provides excellent sensitivity and responsiveness but the signal interference by non-specific binding often renders the analysis rather challenging.21,22 Thermal calorimetry methods offer established routes for the determination of binding constants,23 but limitations exist regarding their low throughput and the requirement of large sample quantities. A number of suitable methodologies based on nuclear magnetic resonance (NMR) spectroscopy have recently emerged to study NP–analyte interaction, including specifically designed diffusion filter and magnetisation transfer methods.24–27 While it is meanwhile possible to verify detailed binding mechanisms and identify multiple analytes by NMR, challenges remain, such as the requirement for relatively high sample concentrations and the availability of a suitable instrumentation infrastructure.
Quartz crystal microbalance with dissipation monitoring (QCM-D) offers, in principle, a viable route for label-free monitoring of molecular adsorption at interfaces in real time.28–30 The established relationship between the change in the resonant frequency and adsorbed wet-mass enables accurate quantification of binding events. QCM-D was successfully implemented to probe binding events of AuNPs with macromolecules, such as proteins, nucleic acids, lipid bilayers, bacteria as well as solvent vapours (in multilayers).31–36 While it is possible to detect mass changes as low as 1 ng cm−2, the detection of molecules with low molecular weight remains challenging, often caused by either an insufficient interfacial area (due to a low grafting density), limited binding affinity, or a combination of these factors.
One type of molecular interaction, that has been applied in a variety of NP-based recognition systems, is the binding of NP-bound boronic acids (BAs) with cis-diol containing biomolecules or other dihydroxy compounds such as catechols.37–40 This dynamic covalent binding process results in the formation of NP-bound boronate esters.41,42 Typically, boronate ester formation is most favourable in the presence of Lewis bases, and various strategies have been explored for achieving stable complexation at near-neutral pH values, including adding electron-withdrawing groups and intramolecular tetracoordinated B–N bonds (Wulff-type BAs).43–47 Governed by similar principles, salicylic acids (SAs) and their derivatives also form boronate complexes.48 Unlike aerobically unstable catechols, SAs have recently been identified as ideal oxidatively inert candidates for selective dynamic covalent interactions with BAs.48,49 From measurements using 19F and 1H NMR spectroscopy, binding strength of SAs and catechols with BAs were found to be highly sensitive to experimental variables, including concentration of bases, as well as the molecular architecture of both BA ligands and their target binding partners.25,48 It is therefore crucial to develop a comparative screening method with simplicity and versatility for the study of BA binding partners, including the more complex nucleosides, saccharides, glycans and glycoproteins, all of which are of significant biological relevance.43,50,51
Herein, we explore in a methodical case study the screening of BA ligands, binding partners and base concentration via multichannel QCM-D to establish a suitable characterisation route for the real-time monitoring of AuNP–analyte interaction. By stepwise immobilisation of AuNPs and subsequent exposure to binding partners, we validate the ability to characterise uptake and release of small molecular weight binding partners and report on binding equilibrium constants obtained for different molecular ligand architectures, small molecule binding partners and Lewis base concentrations.
2. Results and discussion
The overall experimental protocol of the QCM-D based methodology described herein is presented in Fig. 1 and consists of three majors steps: (1) functionalisation of the QCM sensor surface by dithiols, (2) AuNP immobilisation, and (3) exposure to binding partners. In this study, two phenylboronic acid ligands were compared (PBA1 and PBA2 in Fig. 1). Electron-withdrawing fluoro and carboxy ester substituents make PBA1 more Lewis acidic than PBA2, which bears an electron-donating amido group.48 For oxidatively stable non-diol binding partners, 4-fluorosalicylic acid (FSA) and 3,5-dinitrosalicylic acid (DNSA) were assessed.48 | ||
| Fig. 1 Scheme of the QCM-D monitoring process and the molecular structure of PBAs and SAs used in this study. | ||
Prior to the assessment of analyte binding, reusable QCM sensors were prepared by grafting monolayer stabilised AuNPs onto dithiol functionalised surfaces.52 Fresh gold sensor surfaces (C2, C3 and C4) were first conditioned with methanol (MeOH) until stable baselines were obtained and offset for all overtones of frequency and dissipation. C2 and C3 were then exposed to 100 mM 1,8-octanedithiol (diOT) solutions in MeOH with subsequent rinsing by MeOH. C4 was used as control sample by flowing 10 mM MeOH solution of PBA1 in the disulfide form (dPBA1). As shown in Fig. 2(a), a decrease in frequency was observed with the flow of diOT, suggesting the attachment of the diOT molecules via gold–sulfur bonds. In comparison, the dissipation signal saw an increase during the process (Fig. S16†), which is likely attributed to a change in the bulk solution across the sensor surface. This is further supported by the fact that the dissipation shift returned to zero while the frequency shift stabilised at a certain level after rinsing with MeOH at 100 μl min−1, suggesting both the removal of the loosely attached diOT molecules but also the formation of a rigid layer on the sensor surface. The validity of the Sauerbrey equation allowed calculation of the areal mass (AM) change on the surface upon adsorption/desorption from the frequency shift (Fig. 2(b)).53 With AM change at 137 and 151 ng cm−2 for C2 and C3, similar diOT grafting densities of 4.6 and 5.1 per nm2, respectively, were achieved. Note that in comparison, the grafting of dPBA1 onto the sensor surface remained limited, with a mass change of 20 ng cm−2.
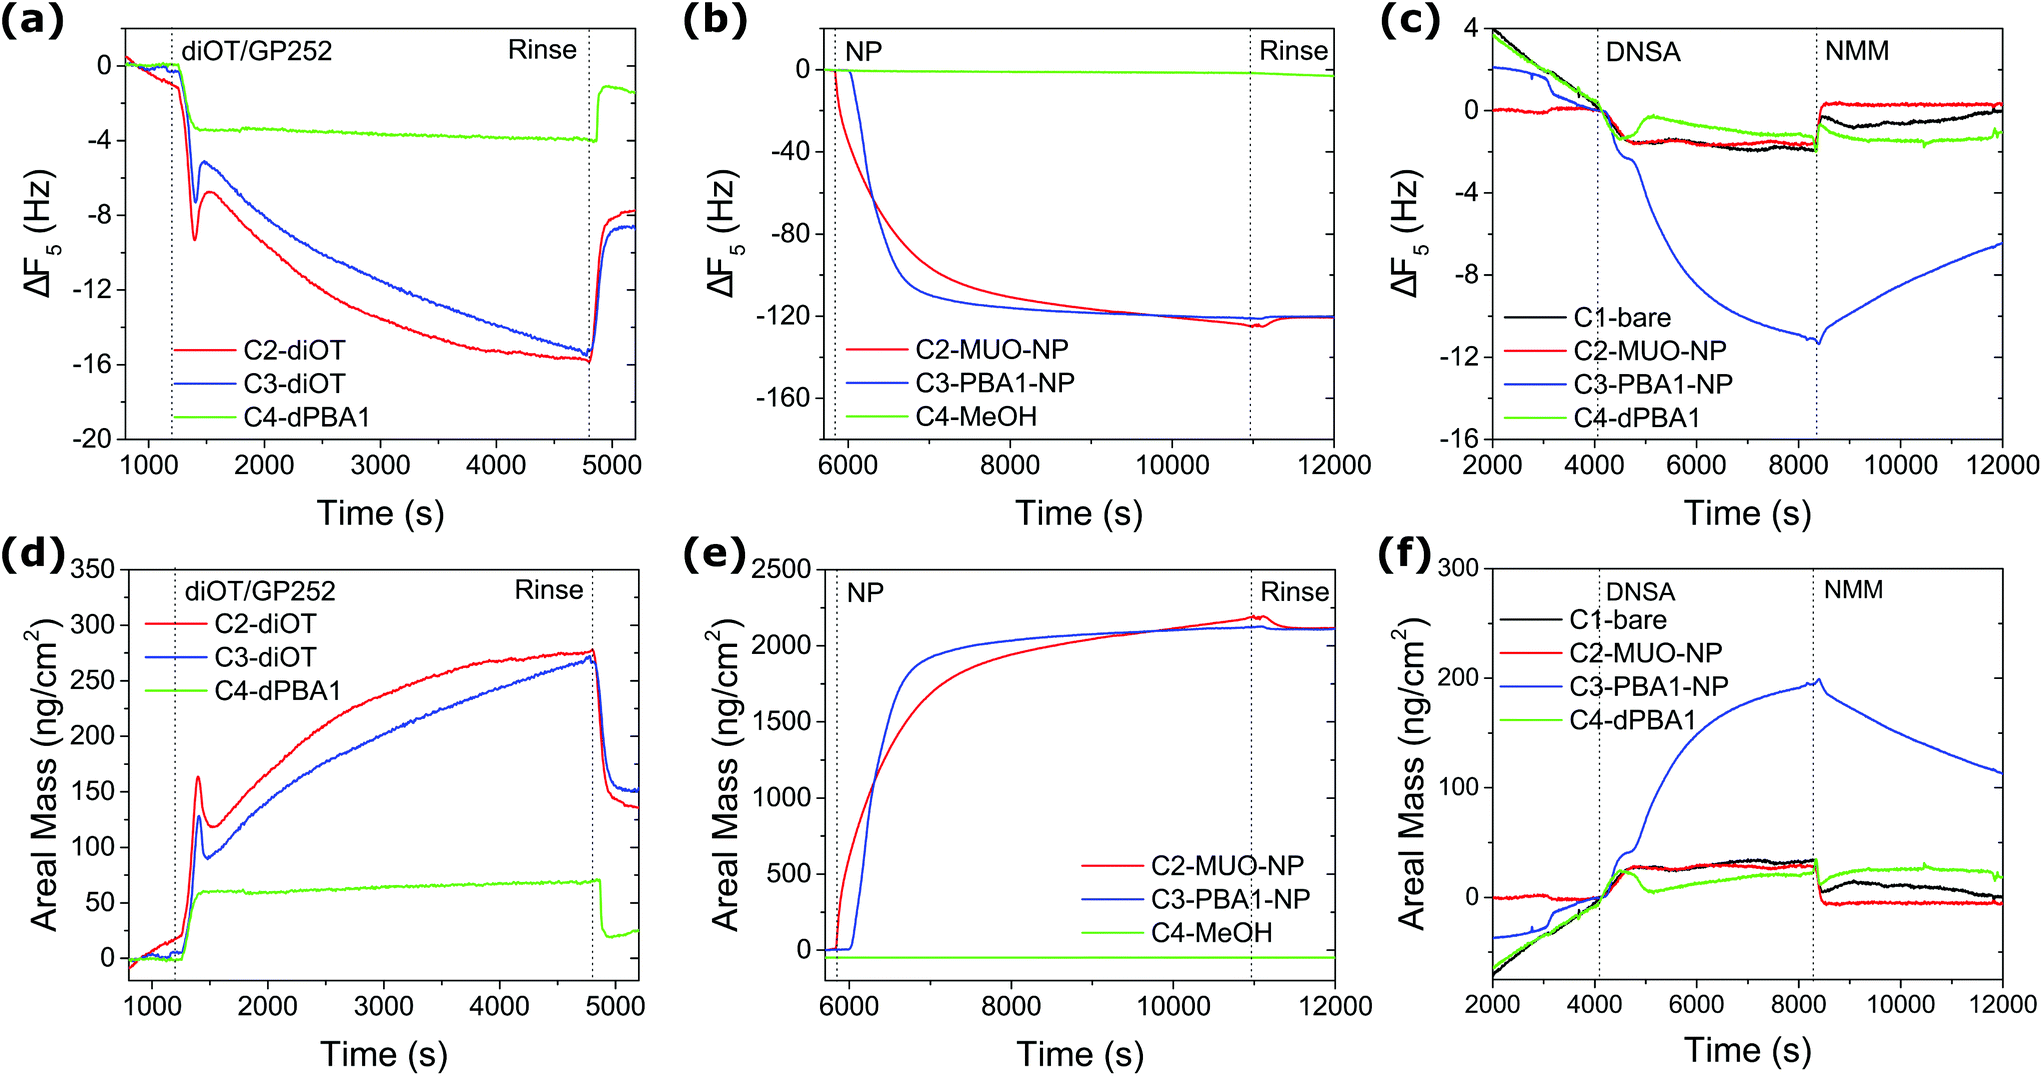 | ||
| Fig. 2 QCM monitoring of experimental procedure. Frequency shift and corresponding AM change (5th overtone): (a, d) grafting of diOT onto gold surface; (b, e) immobilisation of AuNPs and (c, f) detection of 10 mM DNSA in MeOH with 10 mM NMM. | ||
Following the dithiol functionalisation step, the C2 and C3 sensors were then exposed to MeOH solutions of AuNPs (0.1 mg ml−1) at a flow rate of 10 μl min−1. C2 was exposed to AuNPs capped with a homogeneous ligand layer of 11-mercapto-1-undecanol (MUO) (core size 3.7 nm in diameter) as a control, whilst PBA1-NPs (core size 3.6 nm in diameter) were flowed into C3. A significant decrease in frequency was recorded for both channels during the first 15 min and no further adsorption was detected after 1 h constant flow (Fig. 2(c)). Notably, no desorption was observed after the MeOH rinsing step, suggesting the robust immobilisation of AuNPs, with AM change of 2120 and 2109 ng cm−2 in each channel, respectively (Fig. 2(d)). This mass uptake is consistent with the formation of a densely packed layer of AuNPs. See ESI for calculation details (Tables S1 and S2†). Meanwhile, C4 control channel was flowed constantly with MeOH at flow rates matching those employed with C2 and C3; negligible background drift was observed. Whilst the AuNP immobilisation on Au surfaces builds on previous studies,54,55 we note that the herein reported method promoted a significantly more efficient and robust AuNP grafting, which in return provides a larger interfacial area for assessment of AuNP–analyte interactions.
To assess the reactivity of the prepared sensor surface, 10 mM DNSA in 10 mM N-methylmorpholine (NMM) MeOH solution was introduced to the system after conditioning and equilibration with the buffer solution of 10 mM NMM in MeOH. As shown in Fig. 2(e) and (f), the adsorption of DNSA onto the sensor with PBA1–AuNPs (C3) led to a drastic frequency shift of 11 Hz and an AM change of 192 ng cm−2, compared to negligible changes for control sensors C1 (bare gold) and C4 (dPBA1), which can be attributed to physical adsorption and changes in the bulk environment. Significantly, no substantial frequency shift was observed for the C2 sensor with MUO-NPs, suggesting the signal observed for C3 is the result of a specific dynamic covalent interaction with the NP-bound BAs. In approximation, the net AM change can be obtained by subtracting the contribution of non-specific physical adsorption and bulk solution obtained in control channels. Upon PBA–SA binding, the effective molecular weight of adsorbed species can be calculated as following:
| MWeff = MWSA − 2MWH2O + MWNMM | (1) |
The binding of two SAs (FSA or DNSA) to each of the PBA-functionalised NPs was assessed at three NMM base concentrations (0.05, 5 and 500 mM) in MeOH. Following the protocol described above, two sets of three fresh sensors were grafted with diOT and then immobilised with PBA1-NP or PBA2-NP, respectively. With the AM change for PBA1-NPs and PBA2-NPs measured at 2077 ± 38 and 1418 ± 40 ng cm−2, similar AuNP coverages were achieved for the sensors in the same group (Fig. S18–S21†). The grafting density of NP immobilisation as well as PBA ligand density calculation is shown in Table S3.† AM change (Table 1) for each boronate ester complex was calculated from the recorded frequency shift (Fig. 3), evidencing a strong dependence on base concentration. At minimal base concentration (0.05 mM NMM), the frequency shift was largely subject to non-specific physical adsorption and bulk solution change. The negligible boronate ester formation confirmed the requirement of a basic environment for stabilising boronate ester complexes. Significantly improved binding affinity was observed for all four complexes when increasing the base concentration to a 1![[thin space (1/6-em)]](https://www.rsc.org/images/entities/char_2009.gif) :1 molar ratio of NMM (5 mM) to binding partners. Meanwhile a reduced complex stability was observed at the higher NMM concentration of 500 mM, where the binding affinity for all four complexes was reduced compared to the values at 5 mM. These results are in direct agreement with studies of structurally analogous species in solution by quantitative NMR spectroscopy, which showed that a low base concentration (in the range of 1:1 molar ratio) was effective to induce strong boronate ester formation with SAs, contrary to the ultra-high concentrations (>100 molar equivalents) required to maximise binding with catechols.25,48 In relation to the low molecular weights of simple SAs, one limitation of the proposed platform is the detection at low concentrations by QCM-D, being a mass-based technique. The frequency shift of the 7th overtone was used for calculation to avoid noisy baselines and we managed to assess the binding strength comfortably at analyte concentration of 5 mM with tolerable experimental errors. We anticipate the limit of detection to be further decreased by alternative binding partners of larger molecular weight.
:1 molar ratio of NMM (5 mM) to binding partners. Meanwhile a reduced complex stability was observed at the higher NMM concentration of 500 mM, where the binding affinity for all four complexes was reduced compared to the values at 5 mM. These results are in direct agreement with studies of structurally analogous species in solution by quantitative NMR spectroscopy, which showed that a low base concentration (in the range of 1:1 molar ratio) was effective to induce strong boronate ester formation with SAs, contrary to the ultra-high concentrations (>100 molar equivalents) required to maximise binding with catechols.25,48 In relation to the low molecular weights of simple SAs, one limitation of the proposed platform is the detection at low concentrations by QCM-D, being a mass-based technique. The frequency shift of the 7th overtone was used for calculation to avoid noisy baselines and we managed to assess the binding strength comfortably at analyte concentration of 5 mM with tolerable experimental errors. We anticipate the limit of detection to be further decreased by alternative binding partners of larger molecular weight.
 | ||
| Fig. 3 Variable screening of PBA-AuNP and SA binding. Frequency shift (7th overtone) at NMM base concentration of 0.05, 5 and 500 mM: PBA1-NPs with 5 mM of (a) FSA and (b) DNSA; PBA2-NPs with 5 mM of (c) FSA and (d) DNSA. | ||
| Sensor type | AM change, ng cm−2 | ||
|---|---|---|---|
| Conc. NMM, mM | |||
| 0.05 | 5 | 500 | |
| PBA1-NP/FSA | 44 | 163 | 97 |
| PBA1-NP/DNSA | 20 | 102 | 36 |
| PBA2-NP/FSA | 32 | 103 | 88 |
| PBA2-NP/DNSA | 20 | 37 | 21 |
To account for physical adsorption and bulk solution change for the estimation of the net AM change from boronate ester formation, the control baseline was carefully chosen as the AM change when flowing 5 mM FSA or DNSA repetition of 5 mM NMM on sensors immobilised with non-interacting MUO-NPs (Fig. S22†). The impact of NMM was compensated for by frequency and dissipation offset for individual measurement. The density of bound SAs was thus calculated, with the effective molecular weight MWeff (from eqn (1)) for FSA and DNSA at 221.2 and 293.2 g mol−1, respectively (Table S4†). The binding ratios of bound SA to PBA receptors are summarised in Fig. 4. Direct comparison of the four complexes at 5 mM NMM reveals that PBA1-NP/FSA exhibited the strongest association under these conditions with a net binding of 3.54 ± 0.51 FSA molecules per nm2, corresponding to 61% of the surface-immobilised BAs. The quantitative binding is consistent with results from NMR studies on closely analogous model compounds.48 Also in line with solution-phase studies is the observation of weaker association exhibited by PBA2 complexes compared to each analogous PBA1 complex, which is a consequence of the lower Lewis acidity at the boron of PBA2.44,48,56,57 Under the same conditions, PBA1-NP/DNSA achieved a 32% binding ratio (falling to 8% for PBA2-NP/DNSA). For acidic binding partners such as SAs, boronate complex formation is maximised at an optimal concentration of base. Each of the complexes studied exhibited reduced stability at the high base concentration of 500 mM, with the more acidic DNSA binding partner most severely affected. Once more, this reflects the behaviour expected on the basis of solution-phase studies.48,56,57
 | ||
| Fig. 4 Binding ratio of SA to PBA calculated from net AM change of 5 mM SA at 0.05, 5 and 500 mM NMM. The error estimation is based on control subtraction and sensor ligand density variation. | ||
When rinsing with NMM MeOH solution, the release of both SAs was observed, resulting from the dissociation of the boronate esters, thus proving the reversible nature of this dynamic covalent condensation–hydrolysis reaction.43 After extended washing for 1 h, all pre-bound SA molecules were released as indicated by the net frequency shift returning to the same resonant frequency as during NMM MeOH equilibration (Fig. S23 and S24†). Quantitative information on the binding kinetics of boronate ester formation can be assessed by mass change over time with following equations:58–60
 | (2) |
| Δmt = Δmmax(1 − e−t/τ) | (3) |
| τ−1 = kon × [SA] + koff | (4) |
During rinsing, in particular, [SA] = 0, eqn (3) can be written as following:
| τoff−1 = koff. | (5) |
Therefore, the apparent binding constant Ka can be calculated from following equation:
 | (6) |
With local fitting of the dissociation and then the association process, the binding parameters for the experiments at 5 and 500 mM NMM solutions were modelled with exponential decay function as detailed in eqn (3). The obtained relaxation time τ for both association and dissociation was used to calculate association and dissociation rate constants (kon and koff) as well as apparent binding constant Ka. The fitting curves are shown in Fig. S25† and fitting results are summarised in Table 2. On top of the kinetic information provided by τ values, the binding constants further evidenced the observed effects of NMM concentration as well as the structure of both PBA and SA components. Boronate complex stability depends on the structure of each binding partner, as well as the concentration of base. The absolute complex stability, optimum base concentration, and sensitivity to changes away from these conditions all depend on the relative and absolute acidities of the two binding partners. To fully map this multi-dimensional variable space and optimise boronate complex formation, traditional methods such as NMR spectroscopy present a significantly time-consuming and costly challenge, which becomes even greater when examining NP-bound systems. Furthermore, it is not commonly possible to extract information on binding kinetics for such labile molecular interactions from NMR studies. Potentiometric methods have traditionally been used to characterise these aspects of boronate esters, however such approaches are non-trivial to apply to NP systems and are not well-suited to studies in non-aqueous solvents. By contrast, analysis by QCM-D is intrinsically surface based, with reusable AuNP-grafted sensor surfaces that are readily reactivated simply by extended washing. QCM-D thus presents a parallel and sample-efficient method for rapid screening and optimising complex formation for variations in both structural and experimental variables, while at the same time extracting detailed kinetic and thermodynamic information.
| Sensor type | Binding parameters | |||
|---|---|---|---|---|
| τ off −1 | τ on −1 | k on | K a | |
| 10–3 s−1 | 10–3 s−1 | s−1 M−1 | 106 M−1 | |
| 5 mM NMM | ||||
| PBA1-NP/FSA | 0.82 | 8.25 | 1487.2 | 1.82 |
| PBA1-NP/DNSA | 0.20 | 1.27 | 213.7 | 1.06 |
| PBA2-NP/FSA | 2.29 | 7.89 | 1121.6 | 0.49 |
| PBA2-NP/DNSA | 1.39 | 4.49 | 620.8 | 0.45 |
| 500 mM NMM | ||||
| PBA1-NP/FSA | 0.62 | 1.17 | 110.4 | 0.18 |
| PBA1-NP/DNSA | 1.52 | 2.49 | 194.6 | 0.13 |
| PBA2-NP/FSA | 2.42 | 4.23 | 360.5 | 0.15 |
| PBA2-NP/DNSA | 4.10 | 5.94 | 368.4 | 0.09 |
3. Conclusions
In conclusion, we demonstrate an effective route to study NP–analyte surface interactions in real time using a multichannel QCM-D platform. The method consists of essentially three steps, namely the functionalisation of gold coated quartz crystals with dithiol linkers, the grafting of thiol-stabilised AuNPs with functional end groups and the exposure to the binding partners of interest. We employ this approach for the study of boronate ester formation induced by the binding of SAs to AuNPs with BA ligands. Both variables, the molecular architecture of the BA ligands and the concentration of Lewis bases, led to significant changes to the equilibrium binding ratio. Furthermore, the frequency shift pattern was used to model the kinetics during association and dissociation events. Important information including relaxation time as well association/dissociation rate constants could be calculated from this detailed analysis. In contrast to previous QCM-D studies focusing on macromolecules in the kDa molecular weight range or the use of NPs as signal amplification labels, we were able to resolve frequency shifts induced by the binding of immobilised AuNPs to analytes in solution, with molecular weight as low as 100–300 Da. This represents an ideal characterisation platform for the rational screening and selection of AuNP candidates for molecular recognition, adding unique opportunities to the existing tool box for AuNP–analyte interaction.4. Experimental section
4.1. AuNP preparation
The preparation and characterisation of PBA ligands as well as PBA–NPs were detailed in ESI.† MUO-AuNPs were prepared via the oleylamine ligand-exchange approach. The synthesis and characterisation have been previously reported.614.2. QCM-D
All QCM-D studies were performed with 4.95 MHz AT-cut gold coated quartz QSensors on a QSense QCM-D Analyser (Biolin Scientific, Sweden) coupled with an Ismatec IPC-N 4 peristaltic pump. Fresh sensors were rinsed with ethanol and dried with N2 before installing into the flow module. All QCM-D experiments were measured at a controlled temperature of 20 °C. Different flow rates were used with 200 μl min−1 for MeOH, 100 μl min−1 for NMM buffer, 10 μl min−1 for thiols, AuNPs and binding partners. The data was collected and analysed with QSoft 401 and QTools 301 softwares developed by Biolin Scientific. The areal mass change data was calculated based on the Sauerbrey equation62 as follows:| Δm = −C × Δfn | (7) |
 | (8) |
Conflicts of interest
There are no conflicts to declare.Acknowledgements
Y. Y. acknowledges University College London (UCL) for the Overseas Research Scholarship and the Graduate Research Scholarship. The project received funding from the European Unions Horizon 2020 research and innovation programme under grant agreement no. 633635 (DIACHEMO) and the EPSRC (grant number EP/J500549/1). Mass spectrometry was carried out at the UK National Mass Spectrometry Facility (NMSF) at Swansea University. The authors are grateful to Jugal Suthar (UCL) for providing valuable feedback on the manuscript.References
- M.-C. Daniel and D. Astruc, Chem. Rev., 2004, 104, 293–346 CrossRef CAS PubMed.
- Y.-C. Yeh, B. Creran and V. M. Rotello, Nanoscale, 2012, 4, 1871–1880 RSC.
- R. Wilson, Chem. Soc. Rev., 2008, 37, 2028–2045 RSC.
- P. D. Howes, R. Chandrawati and M. M. Stevens, Science, 2014, 346, 1247390 CrossRef PubMed.
- V. Montes-García, J. Pérez-Juste, I. Pastoriza-Santos and L. M. Liz-Marzán, Chem. – Eur. J., 2014, 20, 10874–10883 CrossRef PubMed.
- F. Scaletti, J. Hardie, Y.-W. Lee, D. C. Luther, M. Ray and V. M. Rotello, Chem. Soc. Rev., 2018, 47, 3421–3432 RSC.
- V. Biju, Chem. Soc. Rev., 2014, 43, 744–764 RSC.
- R. A. Sperling and W. J. Parak, Philos. Trans. R. Soc., A, 2010, 368, 1333–1383 CrossRef CAS PubMed.
- S. Engel, E.-C. Fritz and B. J. Ravoo, Chem. Soc. Rev., 2017, 46, 2057–2075 RSC.
- Q. Mu, G. Jiang, L. Chen, H. Zhou, D. Fourches, A. Tropsha and B. Yan, Chem. Rev., 2014, 114, 7740–7781 CrossRef CAS PubMed.
- A. E. Nel, L. Mädler, D. Velegol, T. Xia, E. M. Hoek, P. Somasundaran, F. Klaessig, V. Castranova and M. Thompson, Nat. Mater., 2009, 8, 543 CrossRef CAS PubMed.
- M. P. Monopoli, C. Åberg, A. Salvati and K. A. Dawson, Nat. Nanotechnol., 2012, 7, 779 CrossRef CAS PubMed.
- D. Docter, D. Westmeier, M. Markiewicz, S. Stolte, S. Knauer and R. Stauber, Chem. Soc. Rev., 2015, 44, 6094–6121 RSC.
- J.-M. Lehn, Angew. Chem., Int. Ed. Engl., 1990, 29, 1304–1319 CrossRef.
- G. Yu, K. Jie and F. Huang, Chem. Rev., 2015, 115, 7240–7303 CrossRef CAS PubMed.
- G. Raschke, S. Kowarik, T. Franzl, C. Sönnichsen, T. Klar, J. Feldmann, A. Nichtl and K. Kürzinger, Nano Lett., 2003, 3, 935–938 CrossRef CAS.
- S. M. Simoes, A. Rey-Rico, A. Concheiro and C. Alvarez-Lorenzo, ChemComm, 2015, 51, 6275–6289 RSC.
- H. Yang, B. Yuan, X. Zhang and O. A. Scherman, Acc. Chem. Res., 2014, 47, 2106–2115 CrossRef CAS PubMed.
- M. A. Cooper, Anal. Bioanal. Chem., 2003, 377, 834–842 CrossRef CAS PubMed.
- S. Ray, G. Mehta and S. Srivastava, Proteomics, 2010, 10, 731–748 CrossRef CAS PubMed.
- H. Im, H. Shao, Y. I. Park, V. M. Peterson, C. M. Castro, R. Weissleder and H. Lee, Nat. Biotechnol., 2014, 32, 490 CrossRef CAS PubMed.
- H. H. Nguyen, J. Park, S. Kang and M. Kim, Sensors, 2015, 15, 10481–10510 CrossRef CAS PubMed.
- R. Huang, R. P. Carney, F. Stellacci and B. L. Lau, Nanoscale, 2013, 5, 6928–6935 RSC.
- B. Perrone, S. Springhetti, F. Ramadori, F. Rastrelli and F. Mancin, J. Am. Chem. Soc., 2013, 135, 11768–11771 CrossRef CAS PubMed.
- S. Borsley and E. R. Kay, Chem. Commun., 2016, 52, 9117–9120 RSC.
- L. Gabrielli, D. Rosa-Gastaldo, M.-V. Salvia, S. Springhetti, F. Rastrelli and F. Mancin, Chem. Sci., 2018, 9, 4777–4784 RSC.
- G. Salassa and T. Bürgi, Nanoscale Horiz., 2018, 3, 457–463 RSC.
- M. Nirschl, F. Reuter and J. Vörös, Biosensors, 2011, 1, 70–92 CrossRef CAS PubMed.
- R. P. Richter, R. Bérat and A. R. Brisson, Langmuir, 2006, 22, 3497–3505 CrossRef CAS PubMed.
- G. V. Dubacheva, C. Araya-Callis, A. Geert Volbeda, M. Fairhead, J. Codée, M. Howarth and R. P. Richter, J. Am. Chem. Soc., 2017, 139, 4157–4167 CrossRef CAS PubMed.
- S. H. Brewer, W. R. Glomm, M. C. Johnson, M. K. Knag and S. Franzen, Langmuir, 2005, 21, 9303–9307 CrossRef CAS PubMed.
- B. Tajik-Ahmadabad, A. Mechler, B. W. Muir, K. McLean, T. M. Hinton, F. Separovic and A. Polyzos, ChemBioChem, 2017, 18, 921–930 CrossRef CAS PubMed.
- C. M. Bailey, E. Kamaloo, K. L. Waterman, K. F. Wang, R. Nagarajan and T. A. Camesano, Biophys. Chem., 2015, 203, 51–61 CrossRef PubMed.
- F. Salam, Y. Uludag and I. E. Tothill, Talanta, 2013, 115, 761–767 CrossRef CAS PubMed.
- R. C. Van Lehn, M. Ricci, P. H. Silva, P. Andreozzi, J. Reguera, K. Voïtchovsky, F. Stellacci and A. Alexander-Katz, Nat. Commun., 2014, 5, 4482 CrossRef CAS PubMed.
- Z. M. Marsh, K. A. Lantz and M. Stefik, Nanoscale, 2018, 10, 19107–19116 RSC.
- N. Kanayama and H. Kitano, Langmuir, 2000, 16, 577–583 CrossRef CAS.
- W. Zhou, N. Yao, G. Yao, C. Deng, X. Zhang and P. Yang, Chem. Commun., 2008, 5577–5579 RSC.
- J. Liu, K. Yang, Y. Qu, S. Li, Q. Wu, Z. Liang, L. Zhang and Y. Zhang, Chem. Commun., 2015, 51, 3896–3898 RSC.
- L. Liang and Z. Liu, Chem. Commun., 2011, 47, 2255–2257 RSC.
- J. P. Lorand and J. O. Edwards, J. Org. Chem., 1959, 24, 769–774 CrossRef CAS.
- R. Pizer and L. Babcock, Inorg. Chem., 1977, 16, 1677–1681 CrossRef CAS.
- X. Wu, Z. Li, X.-X. Chen, J. S. Fossey, T. D. James and Y.-B. Jiang, Chem. Soc. Rev., 2013, 42, 8032–8048 RSC.
- J. Yan, G. Springsteen, S. Deeter and B. Wang, Tetrahedron, 2004, 60, 11205–11209 CrossRef CAS.
- L. Zhu, S. H. Shabbir, M. Gray, V. M. Lynch, S. Sorey and E. V. Anslyn, J. Am. Chem. Soc., 2006, 128, 1222–1232 CrossRef CAS PubMed.
- G. Wulff, Pure Appl. Chem., 1982, 54, 2093–2102 Search PubMed.
- M. Dowlut and D. G. Hall, J. Am. Chem. Soc., 2006, 128, 4226–4227 CrossRef CAS PubMed.
- S. Borsley, G. Poss, R. L. Spicer, E. Boudin and E. R. Kay, Supramol. Chem., 2018, 30, 772–781 CrossRef CAS.
- M. Arzt, C. Seidler, D. Y. Ng and T. Weil, Chem. – Asian J., 2014, 9, 1994–2003 CrossRef CAS PubMed.
- R. Nishiyabu, Y. Kubo, T. D. James and J. S. Fossey, Chem. Commun., 2011, 47, 1106–1123 RSC.
- D. Li, Y. Chen and Z. Liu, Chem. Soc. Rev., 2015, 44, 8097–8123 RSC.
- M. Brust, R. Etchenique, E. Calvo and G. Gordillo, Chem. Commun., 1996, 1949–1950 RSC.
- M. Rodahl, F. Höök, C. Fredriksson, C. A. Keller, A. Krozer, P. Brzezinski, M. Voinova and B. Kasemo, Faraday Discuss., 1997, 107, 229–246 RSC.
- L. Lin, H.-q. Zhao, J.-r. Li, J.-a. Tang, M.-x. Duan and L. Jiang, Biochem. Biophys. Res. Commun., 2000, 274, 817–820 CrossRef CAS PubMed.
- X. Li, Y. Yasutake, K. Kono, M. Kanehara, T. Teranishi and Y. Majima, Jpn. J. Appl. Phys., 2009, 48, 04C180 Search PubMed.
- M. A. Martinez-Aguirre, R. Villamil-Ramos, J. A. Guerrero-Alvarez and A. K. Yatsimirsky, J. Org. Chem., 2013, 78, 4674–4684 CrossRef CAS PubMed.
- Y. Furikado, T. Nagahata, T. Okamoto, T. Sugaya, S. Iwatsuki, M. Inamo, H. D. Takagi, A. Odani and K. Ishihara, Chem. – Eur. J., 2014, 20, 13194–13202 CrossRef CAS PubMed.
- Y. Ebara and Y. Okahata, J. Am. Chem. Soc., 1994, 116, 11209–11212 CrossRef CAS.
- Y. Okahata, M. Kawase, K. Niikura, F. Ohtake, H. Furusawa and Y. Ebara, Anal. Chem., 1998, 70, 1288–1296 CrossRef CAS PubMed.
- X. Turon, O. J. Rojas and R. S. Deinhammer, Langmuir, 2008, 24, 3880–3887 CrossRef CAS PubMed.
- Y. Yang, L. A. Serrano González and S. Guldin, Langmuir, 2018, 34, 6820–6826 CrossRef CAS PubMed.
- G. Sauerbrey, Z. Phys., 1959, 155, 206–222 CrossRef CAS.
Footnote |
| † Electronic supplementary information (ESI) available: Experimental details on synthetic procedures, sample preparation and characterisation techniques; further results on QCM-D characterisation. See DOI: 10.1039/C9NR03162F |
| This journal is © The Royal Society of Chemistry 2019 |