
Hyperspectral mapping of anisotropy†
Meguya
Ryu
 a,
Reo
Honda
a,
Armandas
Balčytis
b,
Jitraporn
Vongsvivut
c,
Mark J.
Tobin
c,
Saulius
Juodkazis
*bde and
Junko
Morikawa
*a
a,
Reo
Honda
a,
Armandas
Balčytis
b,
Jitraporn
Vongsvivut
c,
Mark J.
Tobin
c,
Saulius
Juodkazis
*bde and
Junko
Morikawa
*a
aSchool of Materials and Chemical Technology, Tokyo Institute of Technology, Meguro-ku, Tokyo 152-8550, Japan. E-mail: morikawa.j.aa@m.titech.ac.jp
bNanotechnology Facility, Swinburne University of Technology, John st., Hawthorn, 3122 Vic, Australia. E-mail: sjuodkazis@swin.edu.au
cInfrared Microspectroscopy Beamline, Australian Synchrotron, Clayton, Victoria 3168, Australia
dMelbourne Center for Nanofabrication, Australian National Fabrication Facility, Clayton 3168, Melbourne, Australia
eTokyo Tech World Research Hub Initiative (WRHI), School of Materials and Chemical Technology, Tokyo Institute of Technology, 2-12-1 Ookayama, Meguro-ku, Tokyo 152-8550, Japan
First published on 23rd July 2019
Abstract
Anisotropy of absorbance (dichroism) and birefringence limits spatial resolution, sensitivity during quantitative detection of trace analytes, as well as spectral imaging in the near-IR and mid-IR spectral ranges. Here we show hyperspectral imaging capable of determining retardance and absorbance due to small changes in the real and imaginary parts of the refractive index ∼Δn and ∼Δκ at each single point of a measurement at diffraction limited resolution. This single-beam technique allows the retrieval of the phase and amplitude information by virtue of a twice different angular dependence of Δn and Δκ on the sample orientation angle. It has potential applications in analytical science, multi-dimensional optical memory devices, and forensic/defense/sensor fields.
New conceptsWe show how the anisotropy of the real and imaginary parts of the refractive index can be extracted in hyperspectral imaging. The orientation of the absorbing dipoles as well as the orientation of the slow (fast) axis can be determined at each pixel in addition to the spectral information. It is shown that refractive index anisotropy – the birefringence – has a contribution in the transmission signal which is usually accounted as absorbance. Discrimination between birefingence and dichroism will improve the sensitivity of IR spectroscopy and sensors in the molecular fingerprint spectral range. This method is also applicable to the visual and terahertz spectral ranges. |
1 Introduction
Anisotropy, defined by directional dependence of mechanical, electrical, thermal, and optical properties as well as by the size of structural components, manifests itself when characterisation of materials is carried out at an increasingly high resolution.1,2 For optical performance, real and imaginary parts of the refractive index, ñ = n + iκ, together with corresponding anisotropies Δn and Δκ, define the optical response of materials through absorbance and phase delay (retardance). Depending on the characterisation method3 used, either based on refraction, scattering or absorption, the anisotropy becomes important for a wide range of modern microscopy techniques4,5 and sensors, where it leads to a loss of analytical precision unless directly determined.There is an increasing interest in the engineering of materials down to the sub-wavelength and atomic (e.g. graphene) scale with a defined set of n, κ. Applications are expanding to active optical devices such as lasers and perfect absorbers7,8 or optical elements that use the geometrical phase and rely on the orientation anisotropy9 (a change of orientation of the optical axis in the plane perpendicular to the light propagation).
Ellipsometry can retrieve information of the averaged surface nanoscale properties from the reflectivity ratio of the p- and s-components of the light field rp/rs = tan![[thin space (1/6-em)]](https://www.rsc.org/images/entities/char_2009.gif) ΨeiΔ, where parameters Δ and Ψ are related to the amplitude and phase, respectively. However, the knowledge of the pattern's geometry is a prerequisite for a nonambiguous result when surfaces have complex nanoscale structures/patterns. A true nanoscale characterisation is possible by nano-tip based scanning techniques. Optical properties (n + iκ) of nano-films with thickness of only 100 nm can be measured with a lateral resolution of tens-of-nm using the scanning near-field optical microscopy (SNOM) technique.10,11 In the fast growing field of 2D materials, a SNOM approach has been developed to measure the anisotropy of optical properties with nanoscale resolution on atomically thin films bound by van der Waals forces.12–14 How absorbance and retardance can be measured with high resolution using far-field methods is a continuing quest, which has led to the development of a number of super-resolution imaging techniques.15,16 The focus of this study was on improving the simplest far-field diffraction limited imaging in the IR molecular fingerprint spectral range by separation of the retardance and absorbance contributions in transmission.
ΨeiΔ, where parameters Δ and Ψ are related to the amplitude and phase, respectively. However, the knowledge of the pattern's geometry is a prerequisite for a nonambiguous result when surfaces have complex nanoscale structures/patterns. A true nanoscale characterisation is possible by nano-tip based scanning techniques. Optical properties (n + iκ) of nano-films with thickness of only 100 nm can be measured with a lateral resolution of tens-of-nm using the scanning near-field optical microscopy (SNOM) technique.10,11 In the fast growing field of 2D materials, a SNOM approach has been developed to measure the anisotropy of optical properties with nanoscale resolution on atomically thin films bound by van der Waals forces.12–14 How absorbance and retardance can be measured with high resolution using far-field methods is a continuing quest, which has led to the development of a number of super-resolution imaging techniques.15,16 The focus of this study was on improving the simplest far-field diffraction limited imaging in the IR molecular fingerprint spectral range by separation of the retardance and absorbance contributions in transmission.
Absorbance and retardance are both determined from the optical transmittance, T. Birefringence and optical activity, the birefringence of circularly polarised light, is visualised by cross-polarised imaging and defines the retardance Δn × d/λ at the chosen wavelength, λ, for the sample thickness, d. Retardance can also be determined when the polariser and analyser are parallel with a key advantage of a higher light transmission facilitating reliable detection. This becomes very important for chemical imaging in the IR-THz spectral range where absorbance of the sample lowers the transmittance in the cross-polarised measurements of T. The transmittance spectrum, T(λ), when reflectance and absorbance are negligible for the parallel polariser and analyser, is given by:
| Tθ(λ) = 1 − sin22(θ − θR)sin2(πΔnd/λ), | (1) |
The second term on the right-hand side (eqn (1)) defines T for the crossed polarisers. It is noteworthy that in terms of angular dependence of transmittance, the cross-polarised and parallel alignments of two polarisers are equivalent as they are shifted by π/4 with respect to each other. When the sample is rotated between two parallel polarisers, the anisotropy of absorbance can be measured in the same way as with one (the first) polariser, which is the usual way to measure absorbance from transmittance T. This particular feature is important for the method of separating absorbance from retardance contributions demonstrated in this study and discussed next.
The orientational anisotropy of absorbance, Aθ, can be determined from the fit of the angular dependence at four arbitrary angles with angular separation of π/4;17 more angles were used in this study for a better confidence fit. Absorbance at the orientation angle, θ, at the selected wavelength is given by:17
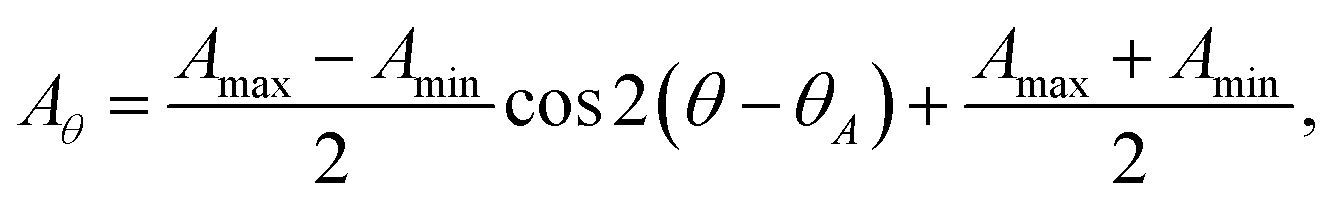 | (2) |
The origin of anisotropy of the real part of refractive index, or birefringence Δn, and that of the imaginary part expressed via the absorption coefficient, Δα ≡ 4πΔκ/λ, are both due to a change of alignment between polarisation of the light field and absorbing dipoles. The absorbance for a polarised light field E is determined by the dipole transition momentum M of a particular vibration as A ∝ (E·M)2. Hence, the orientation anisotropy defines both the refractive and absorptive properties. The orientation function used to evaluate ordering of the absorbing dipoles is directly obtained from:6,19
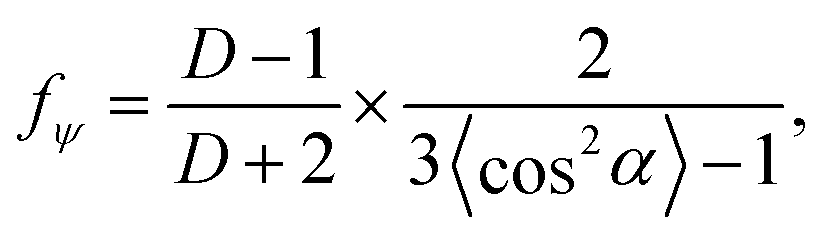 | (3) |
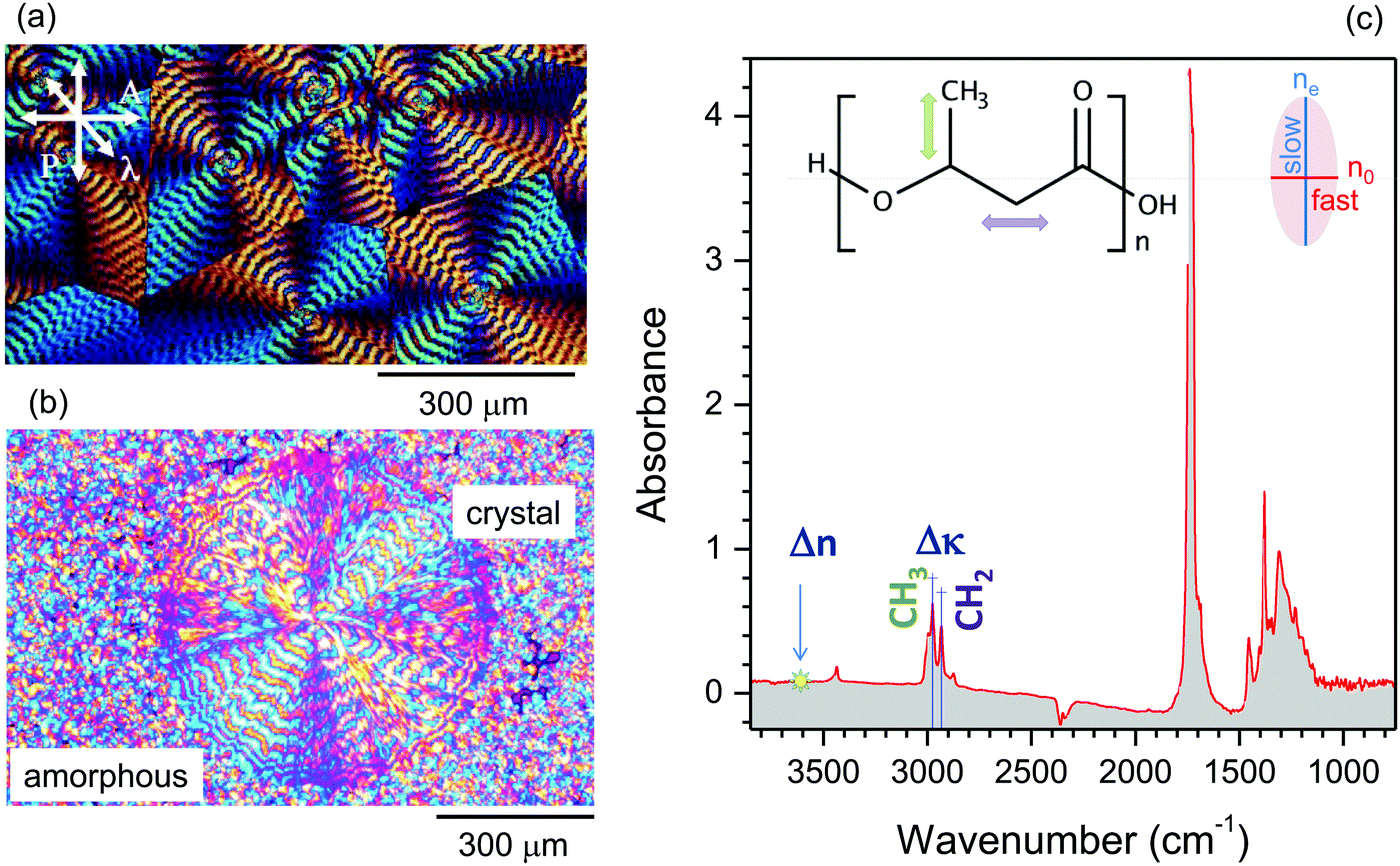 | ||
| Fig. 1 Poly-hydroxybutyrate (PHB) banded spherulites formed between two CaF2 substrates. Spherulite radius is 50–200 μm with a band pitch of 10 μm and thickness d ≃ 12 μm. Polycrystalline film (a) and a single crystalline spherulite grown from the molten amorphous phase (b) shown in color-shifted cross-polarised images; P and A mark the transmission of the linear polariser and analyser, respectively. (c) Integrated absorbance spectrum of PHB at θ = 90°; the inset shows the chemical structure. The long axis of the refractive index ellipsoid is perpendicular to the molecular chain with ne > no defined by extraordinary and ordinary refractive indices; note, this is particular to a PHB crystal while for the most common cases the structural chain alignment corresponds to the slow axis, hence, ne.6 Spectral positions of the perpendicular asymmetric stretching modes used for absorption anisotropy, Δκ; detections at CH3 at 2976 cm−1 and CH2 at 2933 cm−1 are marked. The refractive index anisotropy, Δn, was measured at 3600 cm−1. | ||
By complementing the angular dependence of the hyperspectral mapping of absorbance, Aθ(λ) (eqn (2)), with that of transmittance Tθ(λ) (eqn (1)) we show that Δn and Δκ can be determined in the region of the IR spectrum used for chemical imaging, where usually the absorption is strong.
Here, we introduce an augmented hyperspectral imaging capability to interrogate retardance and absorbance (∼Δn and ∼Δκ) together with the orientation function defined for each single point of measurement down to a diffraction limited resolution. This single-beam technique allows the retrieval of phase and amplitude information by virtue of a twice different angular dependence of Δn and Δκ on the sample orientation angle. This phase and amplitude sensitive technique has potential applications in analytical science, multi-dimensional optical memory devices, and classification of optical materials not only by refractive index but also by absorbance symmetries.18
2 Experimental
2.1 Materials
Samples of poly-hydroxybutyrate (PHB), poly-L-lactic acid (PLLA), paracetamol and silk, which have different degrees of structural complexity, were used for this study (see also the ESI† for details of other samples). The PHB and PLLA samples were 10–15 μm-thick, while silk was prepared using a cryo-microtome and was only 0.1 μm to test the sub-wavelength capability of the hyperspectral imaging in the sub-wavelength mode. An optical profilometer was used to measure the height of the PHB and PLLA samples. The difference in height over the IR mapped area was negligible (±2%) compared with the average height.To validate the method and to calibrate and test the calculation algorithm, circular and linear Au grating patterns milled using a focussed ion beam (FIB; Raith IonLiNE) in a 100 μm-thick Au film sputtered on 30 μm-thick c-cut sapphire were prepared (ESI,† Fig. SII.1 and SII.2). A circular grating provides a model of orientational anisotropy and enables the testing of variable anisotropic conditions for single point hyperspectral mapping, i.e. the central regions are more homogeneous in terms of orientation anisotropy per single pixel as compared with the outside regions.
2.2 Polarisation measurements using synchrotron radiation
Hyperspectral imaging of the absorbance and retardance was performed on the IR Microspectroscopy Beamline of the Australian Synchrotron, Melbourne. IR microspectroscopic measurements were performed using a Bruker Hyperion 2000 FT-IR microscope (Bruker Optik GmbH, Ettlingen, Germany) coupled to a Vertex V80v FT-IR spectrometer equipped with a liquid nitrogen-cooled narrow-band mercury cadmium telluride (MCT) detector. Holographic ZnSe wire-grid polarisers (Edmund) were used to set polarisation and for its analysis after the sample (Fig. 2) in the IR spectral range of λ = 4000–750 cm−1 (2.5–13.3 μm). The extinction of polarisers was Tmax/Tmin ≃ 150 and the overall transmittance was ∼49 and 57% for the two polarisers used for the polariscopy. The far-field transmission measurements were carried out with a numerical aperture NA = 0.5, 36× magnification Cassegrain reflecting objective and matching condenser; the corresponding resolution at the 3000 cm−1 band (λ = 3.33 μm) was 0.61λ/NA ≃ 4.1 μm. Mapping of the region of interest (ROI) was carried out by a point-by-point transmittance mapping in steps of 2–5 μm. The typical time required to take an image over a typical 50 × 50 μm2 area in steps of 5 μm was 2–3 hours. Depending on the S/N ratio, resolution and ROI area faster scans were optimised to reduce the acquisition time.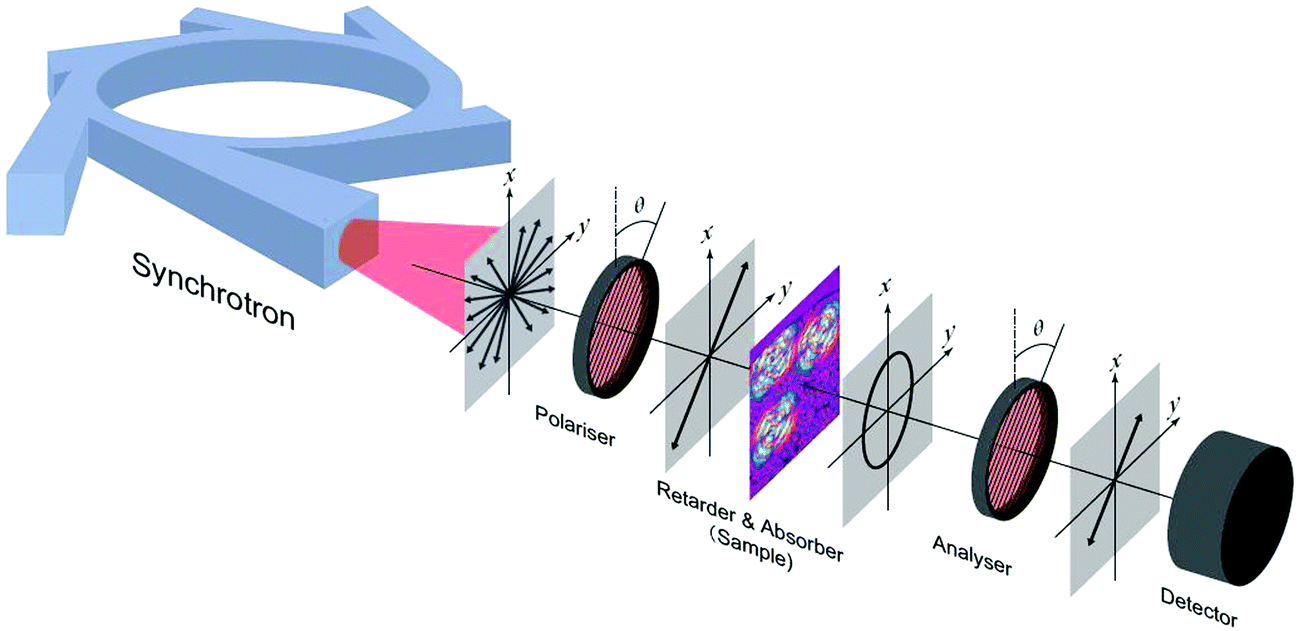 | ||
| Fig. 2 Setup and principle of the hyperspectral measurements of birefringence and absorption anisotropies Δn and Δα related to the retardance and dichroism. The angle θ = 0° was set along the metallic grid lines of the polariser. The polariser and analyser were set parallel (eqn (1)). | ||
Eqn (1) based on the Malus law is used for transparent samples and measurements were carried out with a polariser–analyser (crossed or parallel) setup. This equation does not take absorbance or its anisotropy into account, i.e., α → 0, Δα → 0. Eqn (2) based on the Beer–Lambert law is valid for the absorbing samples when transmission, T, is measured with one polariser (no analyser) and does not provide access to the retardance ∼Δn (nor n). Both anisotropic effects due to the retardance, ∼Δn, and absorbance, Δα, have orientational dependence and cannot be determined with eqn (1) and (2). Since the anisotropies Δn and Δα are inter-related, it is necessary to apply a combined Malus and Beer–Lambert expression (eqn (4)) for the angular transmission, Tθ. We measured transmittance Tθ(λ) with two parallel polarisers with and without the sample at eight different angles. The data Tθ were fitted with eqn (4) to determine the sample's absorbance Aθ and retardance ∼Δn × d.
Experimental hyperspectral pixel mapping (x,y) data were imported into a multidimensional matrix with each pixel representing the spectrum λ measured at the orientation θ using Matlab. The proposed method was also tested with a stretched polyethylene film using a single point measurement carried out with a table-top Spectrum One FT-IR spectrometer.
3 Results
Measurements of transmittance performed for each single pixel provide a hyperspectral mapping capability of anisotropy in refractive index, absorbance, and local molecular orientation. Synchrotron radiation was used for material characterisation in the chemical fingerprint spectral region where phase retardance could be measured in the presence of strong absorbance (Fig. 2). The phase and amplitude sensitive hyperspectral measurement in the IR spectral range of λ = 4000–750 cm−1 (2.5–13.3 μm) was tested on poly-hydroxybutyrate (PHB) (Fig. 1), poly-L-lactic acid (PLLA), paracetamol, and silk samples which have different degrees of structural complexity and thicknesses (see, ESI,†).Fig. 3 shows absorbance, A, (eqn (2)) maps at the CH3 and CH2 bands which have perpendicular orientation of the dipole transitions6,20 (Fig. 1(c)). Local orientation of the absorbing dipoles was calculated using the four polarisation method17,19 adopted for eight angles for a better fit. The parallel polariser setup was used to measure the transmission, Tθ, and Aθ = −lg(Tθ) were determined using eqn (2). The average absorbance (Amin + Amax)/2 is plotted as a color map in (b and e) together with the orientation, θA, where the length of markers represents the amplitude, Amp. The propensity of the molecular orientation, fψ, is shown in (c and f) and the orientation of the dipoles, θA, in (d and g). This analysis presents an augmented capability of hyperspectral imaging with addition of anisotropy in absorbance and local orientation which are usually not explored in the IR spectral range. In addition, a complementary capability to map birefringence Δn (eqn (1)) is demonstrated in Fig. 4. Diagonal cross sections through the spherulite (∼10–60 μm) show the order distribution at one wavelength and the birefringence at the other; both are anti-correlated. In terms of information recording, the anisotropy in n and κ at different wavelengths can be overlaid in the same pixel of the hyperspectral image.
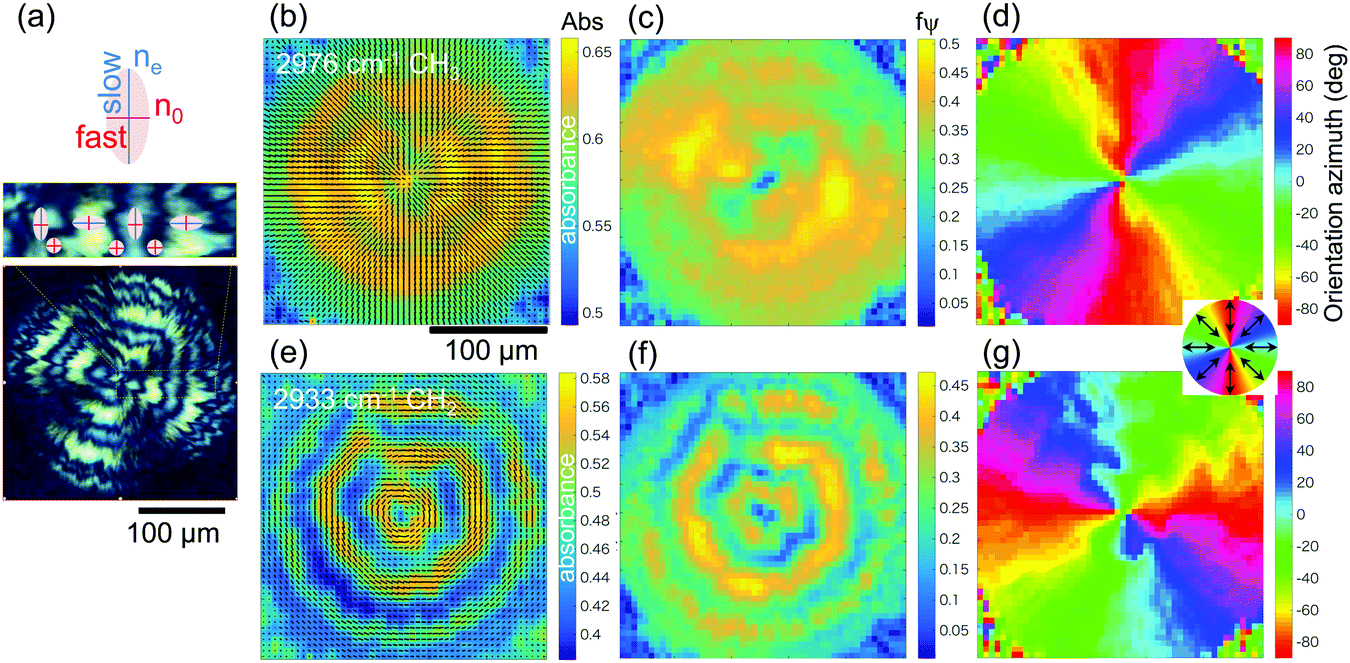 | ||
| Fig. 3 (a) Optical cross-polarised image of PHB spherulites and schematic presentation of the refractive index ellipsoid; there is no birefringence at the locations of the darkest rings, ne = no. (b) Orientation vector map (black lines) calculated from the absorbance fit at θ = 0, 30, 45, 60, and 90° angles overlaid with the average absorbance color map calculated from the 0° and 90° images (min and max absorbance). (c) The orientation function fψ [from 0 to 1]. (d) The orientation azimuth map θA for CH3 (inset shows the orientational color map). (e–g) Same for the CH2 band; note the perpendicular orientation of maps in (g) and (d). The step size in hyperspectral mapping was 5 μm; lateral resolution 6.9 μm, and spectral resolution 4 cm−1. The scale bar is 100 μm for (b–g). | ||
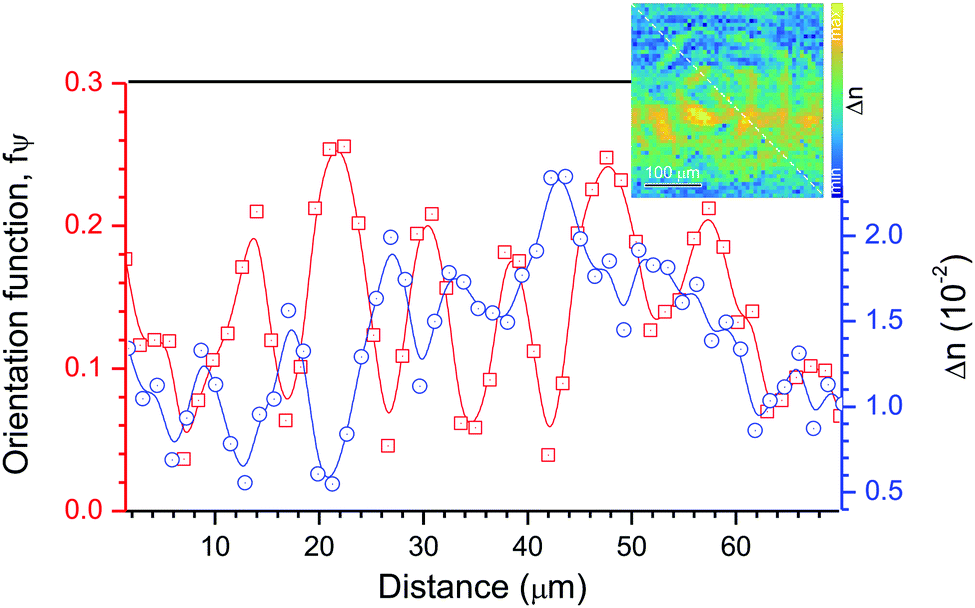 | ||
| Fig. 4 The diagonal cross sections of the maps of the orientation function fψ at 2933 cm−1 (Fig. 3(f)) and birefringence Δn at 3600 cm−1 (inset). | ||
The anisotropy in both real and imaginary parts of the refractive index can be retrieved by the best fit as is shown next for a single point measurement using a desktop Fourier transform infrared (FT-IR) spectrometer. Transmittance through the parallel polarisers (see, eqn (1) assuming Δκ = 0) is affected by the retardance and absorbance of the sample and can be exactly fit by a generic expression of combined Malus and Beer–Lambert laws,21 which accounts for the orientational dependence of transmittance and absorption losses, respectively. It has been established that spectral positions of the measured molecular vibration peaks are affected by the refractive index as well as by the intrinsic absorbance of the molecular vibrations.22 Absorption peaks are dependent on the method of optical measurement and molecular environment22 which we observed in the IR spectra of silk when measured by different far- and near-field techniques.10,11 Similar to ellipsometry, we introduce a generic expression which combines the Malus and Beer–Lambert laws in the following form:
| Tθ = ancos22(θ − bn) × 10aκcos2(θ−bκ) + o ≡ Ret × Abs + o | (4) |
Eqn (4) reflects the twice different angular dependence of the retardance ∼Δn and absorbance ∼κ when measured in a crossed (or parallel) polariser setup and is the key for separation of the two contributions by the best fit. The double angle 2θ-dependence of Δn reflects the fact that the transmittance is minimum when a linearly polarised E-field of light is aligned or is perpendicular to the parallel polariser setup (eqn (1)), while the absorbance is always defined by E-field projection onto the axis of the dipole transition (hence a θ-dependence).
The principle of additive contributions to transmittance due to phase delay (retardance) and absorbance (losses) is demonstrated for polyethylene at two different absorption bands of the CH2 vibrations (Fig. 5) measured with a table-top FT-IR spectrometer (SpectrumOne, PerkinEmler). The amplitudes of the two harmonics for Δn and Δκ are retrieved by the best fit eqn (4) regardless of the average values which are proportional to n and κ. A self-referenced character of the measurement provides high fidelity hyperspectral information of anisotropies Δn and Δκ together with the orientation function per single measured pixel/point. This shows the principle of anisotropy detection and can be carried out in the hyperspectral mapping mode (Fig. 3 and 4). This validates the conjecture expressed by eqn (4).
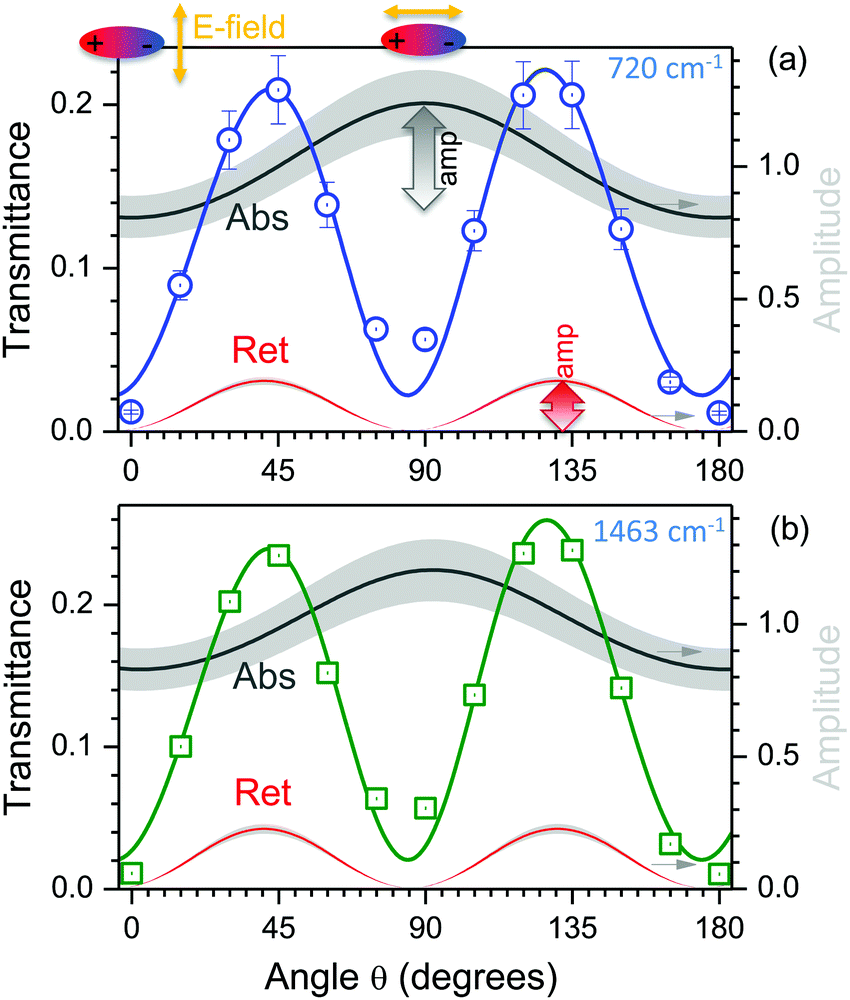 | ||
Fig. 5 Experimental ( and and  dots) and best fit (line) transmission through a cross-polarised setup (second term in eqn (1)) of polyethylene (PE) at two different wavenumbers of CH2 (720 cm−1 rocking and 1463 cm−1 bending vibrations) decoupled into two contributions due to the retardance, Ret, and absorbance, Abs (eqn (4)); the corresponding amplitudes, amp, are shown on the right axis. The bands of ±10% around the best fit Ret and Abs are shown in gray. Eqn (4) fit was used with parameters for (a): an = 0.19, bn = 0.69 rad, aκ = 0.09, bκ = −0.02 rad, o = 0.02 and (b): an = 0.22, bn = 2.26 rad, aκ = 0.08, bκ = 0.02 rad, o = 0.01. The thickness of the stretched PE film was 12 μm. The top insets show mutual orientations of a dipole and light E-field at 0° (⊥) and 90° (‖) corresponding to the minimum and maximum absorption, respectively, while the retardance is minimal. dots) and best fit (line) transmission through a cross-polarised setup (second term in eqn (1)) of polyethylene (PE) at two different wavenumbers of CH2 (720 cm−1 rocking and 1463 cm−1 bending vibrations) decoupled into two contributions due to the retardance, Ret, and absorbance, Abs (eqn (4)); the corresponding amplitudes, amp, are shown on the right axis. The bands of ±10% around the best fit Ret and Abs are shown in gray. Eqn (4) fit was used with parameters for (a): an = 0.19, bn = 0.69 rad, aκ = 0.09, bκ = −0.02 rad, o = 0.02 and (b): an = 0.22, bn = 2.26 rad, aκ = 0.08, bκ = 0.02 rad, o = 0.01. The thickness of the stretched PE film was 12 μm. The top insets show mutual orientations of a dipole and light E-field at 0° (⊥) and 90° (‖) corresponding to the minimum and maximum absorption, respectively, while the retardance is minimal. | ||
Next, the introduced fitting procedure, validated for a single-point spectral measurement (eqn (4)), was tested for the hyperspectral mapping of anisotropy using a single transmission measurement, Tθ, with parallel polarisers at selected orientation angles, θ. Paracetamol crystals23 were chosen due to their well defined domain structure, and mapping at the 3205 cm−1 OH band24 responsible for the hydrogen bonding was carried out. Fig. 6 shows the retrieved best fit data for the amplitudes, an,κ, and orientation angles, bn,κ. The orientation map for the corresponding retardance, Ret, and dichroism, Abs, and parts of eqn (4) were overlaid with an optical cross-polarised image. The domain structure and prevailing orientation are revealed and show the orientational dependence of birefringence and dichroism. Additionally, such hyperspectral imaging shows the retardance in the standard absorbance map (see ESI,† for details). The amplitude of the angular dependence Tθ (eqn (1)) is directly related to the optical retardance, Δnd/λ, via Tmax − Tmin = sin2(πΔnd/λ). The amplitude of the absorbance in eqn (4) is related to the dichroism, Δ′′, as:
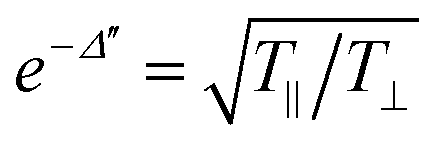
| (A‖ − A⊥)/2 = k(κ‖ − κ⊥)d ≡ Δ′′, | (5) |
 . This shows the possibility of imaging the absorbance and retardance for any wavelength used for the hyperspectral imaging at a single pixel level.
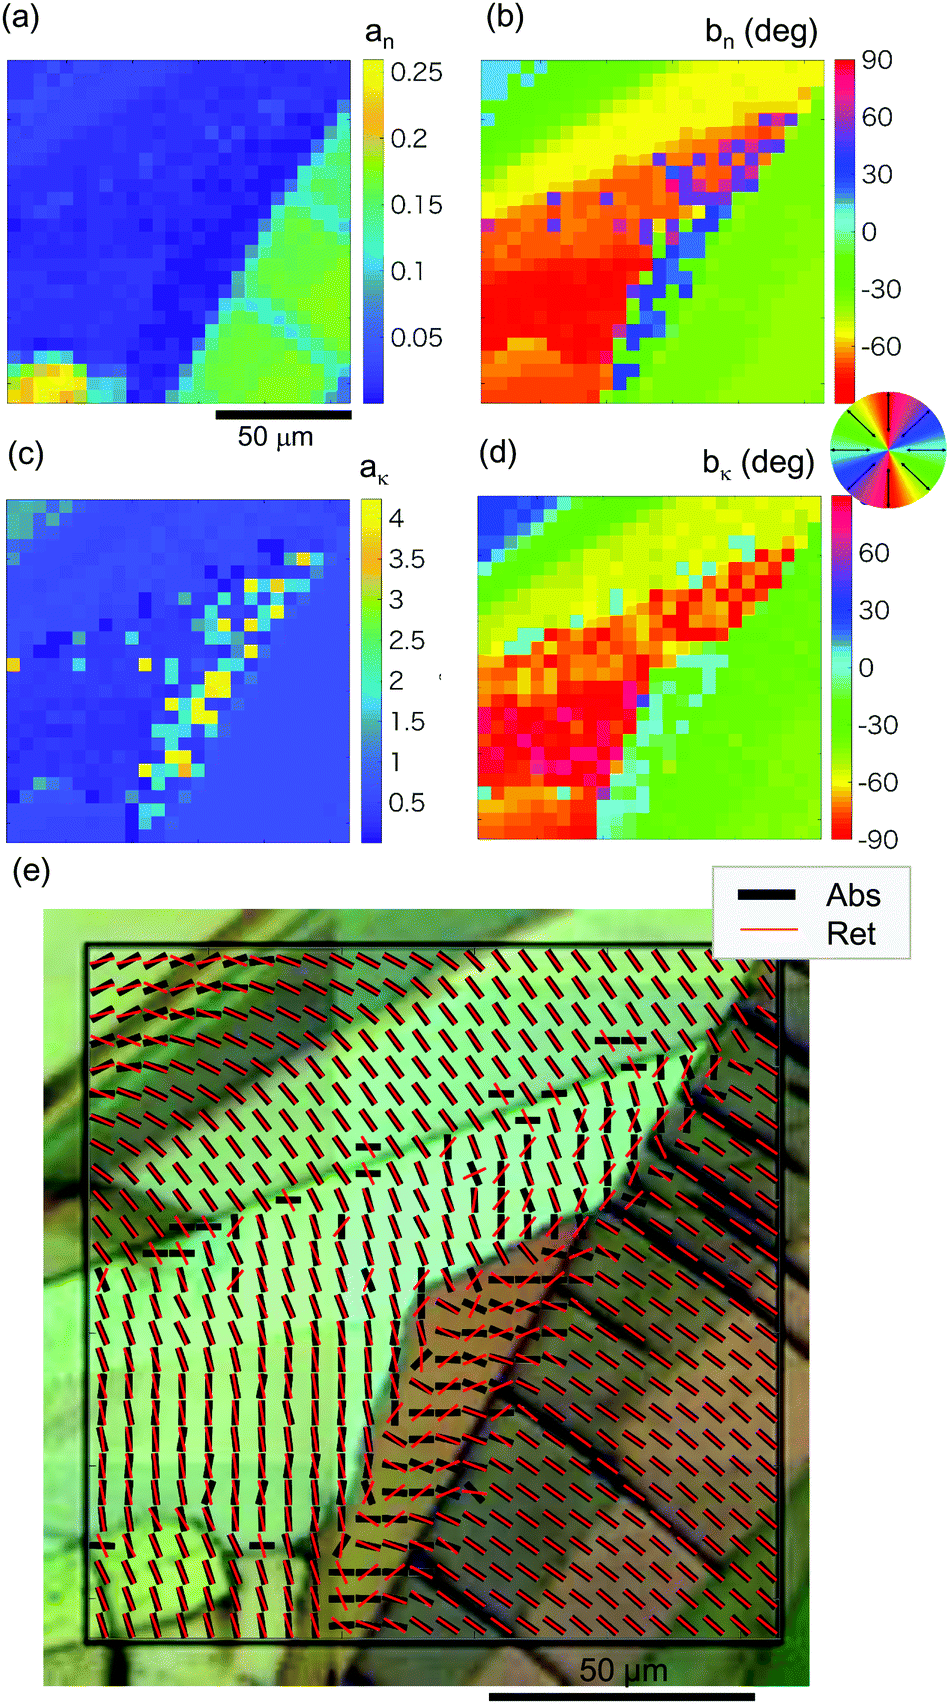 | ||
| Fig. 6 Hyperspectral mapping of anisotropy in paracetamol (form II) at the OH vibration band of 3205 cm−1: the birefringence Δn (the retardance Ret in eqn (4)) and dichroism ∼Δκ (the Abs in eqn (4)) using the best fit to eqn (4). The retrieved an (a), bn [deg] (b), aκ (c), bκ [deg] (d). (e) Overlaid optical cross polarised image of paracetamol crystals with the orientation vector map of bn and bκ. The pixel pitch was 5 μm. | ||
4 Conclusions and outlook
In summary, the anisotropy in n and κ together with the orientation function fψ at different wavelengths can be measured at a single irradiation point as well as by hyperspectral mapping with sub-wavelength resolution in the IR fingerprint spectral range (see ESI†). The retardance and absorbance related to the phase and amplitude of the transmitted light can be retrieved using a two parallel polariser setup. We show that two contributions in the transmitted signal due to retardance and absorbance are inherently inter-related but can be measured separately by applying a combined Malus and Beer–Lambert law introduced in this study. Separation of contributions due to the real and imaginary parts of the refractive index become possible due to their different angular dependences as shown by the proposed expression (eqn (4)) of the combined law. This expands the application potential of the hyperspectral mapping in multi-dimensional optical memory25 applications and sensors where high sensitivity measurements are anisotropy dependent.As is shown here, the phase-related measurement is always affected by the presence of birefringence and anisotropy of absorption. Likewise, the absorbance is affected by the phase retardance. The presented technique of hyperspectral mapping of Δn and Δκ can be further enhanced by ultra-fast spectral acquisition using dual-comb spectroscopy.26 The hyperspectral character of spectral mapping when each pixel has all spectral information is now enriched by the measured absorber orientation and its strength with separated contributions due to the real and imaginary parts of the refractive index. This multi-data characterisation of materials at the nano-/micro-scales can be further utilised by emerging materials characterisation techniques based on the big data approach.27 Recently, we introduced the four polarisation method at the Australian Synchrotron for measurements using a focal plane array which dramatically reduced the image acquisition time28 as compared with point-by-point mapping used in this study. One can expect that hyperspectral imaging in the near-IR, visible and terahertz spectral ranges using the proposed method will reveal more details about molecular alignment and anisotropy. Also, we envisage applications in aerial and satellite spectral mapping for defence and environmental monitoring.
Contributions
S. J. and J. M. came up with the idea of experiments, M. R., R. H., A. B., J. M., and S. J. carried out the experiments at the Melbourne Synchrotron on the beamline under the supervision of J. V. and M. T., M. R. carried out microtome and spectral analysis, R. H. worked on data and image processing. All the authors participated in discussions and analysis of the results and contributed to editing of the manuscript.Conflicts of interest
There are no conflicts of interest to declare.Acknowledgements
JM acknowledges a partial support by JSPS KAKENHI Grant No. 18H04506 and JST CREST JPMJCR18I7 grant, Japan. MR acknowledges a partial support by JSPS KAKENHI Grant No. 18J14350, Japan. We acknowledge partial support via ARC Discovery DP170100131 grant. Experiments were carried out via beamtime project No. 12107 on the IR Microspectroscopy Beamline at the Australian Synchrotron, part of ANSTO. We are grateful to Jingliang Li for the silk sample.Notes and references
- E. A. Muller, B. Pollard, H. A. Bechtel, P. van Blerkom and M. B. Raschke, Sci. Adv., 2016, 2, e1601006 CrossRef PubMed.
- J. Chae, S. An, G. Ramer, V. Stavila, G. Holland, Y. Yoon, A. A. Talin, M. Allendorf, V. A. Aksyuk and A. Centrone, Nano Lett., 2017, 17, 5587–5594 CrossRef CAS PubMed.
- E. Bertie and K. H. Michaelian, J. Chem. Phys., 1998, 109, 6764–6771 CrossRef.
- R. M. Power and J. Huisken, Nat. Methods, 2017, 14, 360–373 CrossRef CAS PubMed.
- M. Padgett, Opt. Express, 2017, 25, 11265–11274 CrossRef CAS PubMed.
- Y. Hikima, J. Morikawa and T. Hashimoto, Macromolecules, 2013, 46, 1582–1590 CrossRef CAS.
- L. Zhang, Z. Bai, H. Ban and L. Liu, Phys. Chem. Chem. Phys., 2015, 17, 29007 RSC.
- N. I. Landy, S. Sajuyigbe, J. J. Mock, D. R. Smith and W. J. Padilla, Phys. Rev. Lett., 2008, 100, 207402 CrossRef CAS PubMed.
- M. Khorasaninejad and F. Capasso, Science, 2017, 358, 1146 CrossRef CAS PubMed.
- M. Ryu, H. Kobayashi, A. Balcytis, X. Wang, J. Vongsvivut, J. Li, N. Urayama, V. Mizeikis, M. Tobin and S. Juodkazis, Mater. Res. Express, 2017, 4, 115028 CrossRef.
- M. Ryu, R. Honda, A. Cernescu, A. Vailionis, A. Balcytis, J. Vongsvivut, J.-L. Li, D. Linklater, E. Ivanova, V. Mizeikis, M. Tobin, J. Morikawa and S. Juodkazis, Beilstein J. Nanotechnol., 2019, 10, 922–929 CrossRef CAS PubMed.
- D. Hu, X. Yang, C. Li, R. Liu, Z. Yao, H. Hu, S. G. Corder, J. Chen, Z. Sun, M. Liu and Q. Dai, Nat. Commun., 2017, 8, 1471 CrossRef PubMed.
- P. Li, I. Dolado, F. Alfaro-Mozaz, F. Casanova, L. Hueso, S. Liu, J. Edgar, A. Nikitin, S. Vélez and R. Hillenbrand, Science, 2018, 359, 892–896 CrossRef CAS PubMed.
- W. Ma, P. Alonso-González, S. Li, A. Nikitin, J. Yuan, J. Martín-Sánchez, J. Taboada-Gutiérrez, I. Amenabar, P. Li, S. Vélez, C. Tollan, Z. Dai, Y. Zhang, S. Sriram, K. Kalantar-Zadeh, S.-T. Lee, R. Hillenbrand and Q. Bao, Nature, 2018, 562, 557–562 CrossRef CAS PubMed.
- S. W. Hell and J. Wichmann, Opt. Lett., 1994, 19, 780–782 CrossRef CAS PubMed.
- P. R. Nicovich, D. M. Owen and K. Gaus, Nat. Protoc., 2017, 12, 453–460 CrossRef PubMed.
- Y. Hikima, J. Morikawa and T. Hashimoto, Macromolecules, 2011, 44, 3950–3957 CrossRef CAS.
- M. V. Berry and M. R. Denn, Proc. R. Soc. London, Ser. A, 2003, 459, 1261–1292 CrossRef.
- M. Ryu, A. Bačytis, X. Wang, J. Vongsvivut, Y. Hikima, J. Li, M. J. Tobin, S. Juodkazis and J. Morikawa, Sci. Rep., 2017, 7, 7419 CrossRef PubMed.
- C. Merten, T. Kowalik, S. J. Aßhoff and A. Hartwig, Macromol. Chem. Phys., 2010, 211, 1627–1631 CrossRef CAS.
- M. Born and E. Wolf, Principles of Optics: Electromagnetic Theory of Propagation, Interference and Diffraction of Light, 7th edn, 1999 Search PubMed.
- J. E. Bertie and K. H. Michaelian, J. Chem. Phys., 1998, 109, 6764–6771 CrossRef CAS.
- M. Haisa, S. Kashino and H. Maeda, Acta Crystallogr., Sect. B: Struct. Crystallogr. Cryst. Chem., 1974, 30, 2510–2512 CrossRef.
- E. B. Burgina, V. P. Baltakhinov, E. V. Boldyreva and T. P. Shakhtschneider, J. Struct. Chem., 2004, 45, 64–73 CrossRef CAS.
- P. Zijlstra, J. Chon and M. Gu, Nature, 2009, 459, 410–413 CrossRef CAS PubMed.
- M. Yu, Y. Okawachi, A. G. Griffith, N. Picqué, M. Lipson and A. L. Gaeta, arXiv, 2016, arXiv:1610.01121.
- S. Wu, Y. Kondo, M.-A. Kakimoto, B. Yang, H. Yamada, I. Kuwajima, G. Lambard, K. Hongo, Y. Xu, J. Shiomi, C. Schick, J. Morikawa and R. Yoshida, npj Comput. Mater., 2019, 5, 66 CrossRef.
- R. Honda, M. Ryu, M. Moritake, V. M. A. Balcytis, J. Vongsvivut, M. J. Tobin, D. Appadoo, J.-L. Li, S.-H. Ng, S. Juodkazis and J. Morikawa, Nanomaterials, 2019, 9, 732 CrossRef CAS PubMed.
Footnote |
| † Electronic supplementary information (ESI) available. See DOI: 10.1039/c9nh00340a |
| This journal is © The Royal Society of Chemistry 2019 |