 Open Access Article
Correspondence between electronic structure calculations and simulations: nonadiabatic dynamics in CS2†
Darren
Bellshaw
a,
Russell S.
Minns
b and
Adam
Kirrander
 *a
*a
aEaStCHEM, School of Chemistry, University of Edinburgh, David Brewster Road, EH9 3FJ Edinburgh, UK. E-mail: Adam.Kirrander@ed.ac.uk; Tel: +44 (0)131 6504716
bChemistry, University of Southampton, Highfield, Southampton SO17 1BJ, UK
First published on 29th November 2018
Abstract
The choice of ab initio electronic structure method is an important factor in determining the fidelity of nonadiabatic dynamics simulations. We present an in-depth comparison of two simulations of photodissociation in the CS2 molecule following excitation to the 11B2 state. The simulations account for nonadiabatic and spin–orbit coupling, and are performed using the SHARC surface-hopping approach combined with state-averaged SA8-CASSCF(8,6)/SVP and SA8-CASSCF(10,8)/SVP ab initio calculations, with additional reference calculations at the MRCI(14,10)/aug-cc-pvTZ level. The relative performance and veracity of the simulations can be assessed by inspection of the potential energy curves along specific coordinates. The simulations demonstrate direct competition between internal conversion and intersystem crossing, with strong correlation between molecular geometry, electronic state density, and dynamics.
1 Introduction
Photochemical processes are ubiquitous in nature as well as increasingly important for new technologies.1,2 The initial stages of photochemical dynamics occur on ultrashort timescales and generally involve rapid electronic relaxation via internal conversion mediated by nonadiabatic couplings3,4 or intersystem crossing by spin–orbit couplings.5,6 Over the past decade, remarkable progress has been made in experimental techniques capable of following the dynamics, including ultrafast spectroscopy7–12 and diffraction.13–19 Mechanistic interpretation of the experimental observations often involves comparison to simulations, making it possible to pull out features not immediately obvious from experiments alone.20–25 There are also increasing efforts towards the calculation of observables directly from simulations,20,25–29 further strengthening the links between experiments and theory.Given the importance of simulations for the interpretation of experiments, it is vital to consider the approximations inherent in most simulations. Numerically exact propagation of the full molecular wavefunction30–32 is not feasible in general due to the exponential scaling of the wavepacket propagation with the number of vibrational degrees of freedom in the system. Benchmark methods such as MCTDH33 are in many cases only feasible for reduced-dimensionality models that are based on prior assumptions about the dynamics and require precalculated potential energy surfaces with significant up-front investment of computational resources. In contrast, trajectory-based methods,34–40 which calculate the electronic structure of the molecule on-the-fly, often provide sensible results at viable computational expense without resorting to reduced dimensionality models even for comparatively large molecules. These methods are therefore increasingly becoming the default choice for the interpretation of experiments.7,20–22,25,41–43 However, the ab initio electronic structure calculations, which ultimately constrain the fidelity of the simulations,44 remain a severe computational bottleneck. Invariably, a compromise between the ideal level of electronic structure theory for the simulations and the level commensurate with available computational resources must be struck. We set out in this article to examine how the quality of electronic structure calculations influences the dynamics observed in trajectory-based simulations, and provide a detailed analysis of the resulting dynamics.
The selected model system is the CS2 molecule, which is an important benchmark for ultrafast dynamics. Upon excitation, a complicated interplay between the nuclear and electronic motions ensues, dictated by the dense manifold of singlet and triplet electronic states that coexist in the Franck–Condon region. Important experimental studies of the CS2 molecule in the time-domain include seminal molecular-alignment and UV photoelectron imaging work,11,12 and extensive studies using photoelectron spectroscopy.10,45–47 We simulate the photodissociation dynamics of CS2 with the surface-hopping SHARC method,36,48,49 which is based on Tully's semiclassical fewest switches algorithm50 and accounts for both nonadiabatic couplings (internal conversion) and spin–orbit coupling (intersystem crossing). This process is shown schematically in Fig. 1. Here, the molecule is excited to the 11B2 state rather than the 21B2 state of most experiments, which reduces the number of interacting states from 19 to 8 in our multiconfigurational calculations, reducing computational cost while retaining much of the complexity of the dynamics. Interestingly, many of the qualitative aspects of the dynamics bear a strong resemblance to those observed upon excitation to the higher lying 21B2 state. Previous experiments on the 11B2 state, whose absorption is about four orders of magnitude weaker than the 21B2 state at its absorption peak, have focused on photolysis and fluorescence quantum yield studies,51–53 often in the context of atmospheric chemistry. Furthermore, the high kinetic energy initial conditions limit the validity of direct comparison to experiments (see Computational details). The simulations reported here do not intend to be a direct comparison between experiment and theory, but rather an analysis of the impact of the level of theory on complex dynamics simulations.
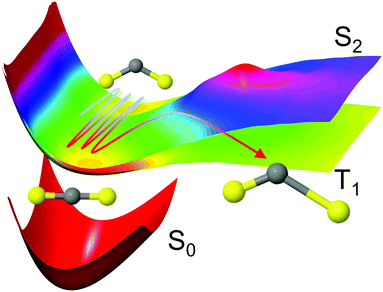 | ||
Fig. 1 Schematic representation of the CS2 photodissociation, showing a small subset of the potential energy surfaces included in the simulations: the molecule is excited from the ground electronic state S0 (11A′, 11A1, ![[X with combining tilde]](https://www.rsc.org/images/entities/char_0058_0303.gif) 1Σ+g) to the S2 (21A′, 11B2, 1Δu) state, with the main pathway to dissociation being via intersystem crossing to the triplet states which have a lower barrier to dissociation, here represented by the T1 (13A′, 13B2, 3Σ+u) state. For a full conversion table of electronic state labels in each point group, see Table 2. 1Σ+g) to the S2 (21A′, 11B2, 1Δu) state, with the main pathway to dissociation being via intersystem crossing to the triplet states which have a lower barrier to dissociation, here represented by the T1 (13A′, 13B2, 3Σ+u) state. For a full conversion table of electronic state labels in each point group, see Table 2. | ||
2 Method
The SHARC method36,48,49 was developed to account for arbitrary couplings such as spin–orbit coupling or those induced by a laser field via a reformulation of surface-hopping in terms of an unitary transformation matrix. Electrons are treated quantum mechanically while nuclear motion is treated classically. At each time step an algorithm is followed to determine the active state to which a trajectory is localised, based on the evolution of the electronic wavefunction along the nuclear trajectory. This involves choosing a model space that covers the necessary manifold of electronic states on which the dynamics of the system will evolve. Equations-of-motion for the electronic states are determined by expansion of the electronic wavefunction and insertion into the time-dependent Schrödinger equation (see ref. 36 and 49 for derivation and a full description of the method), and may be written in compact matrix form as, | (1) |
| Hdiag = U†HMCHU, | (2) |
3 Computational details
The differences between the setup parameters of the two sets of simulations (herein labelled simulations A and B) are summarised in Table 1. First, in Section 3.1 below, we discuss the ab initio electronic structure calculations, and second, in Section 3.2, we discuss the simulations.| Simulation | A | B |
|---|---|---|
| Active space | (8,6) | (10,8) |
| Number of trajectories | 571 | 1024 |
3.1 Ab initio electronic structure calculations
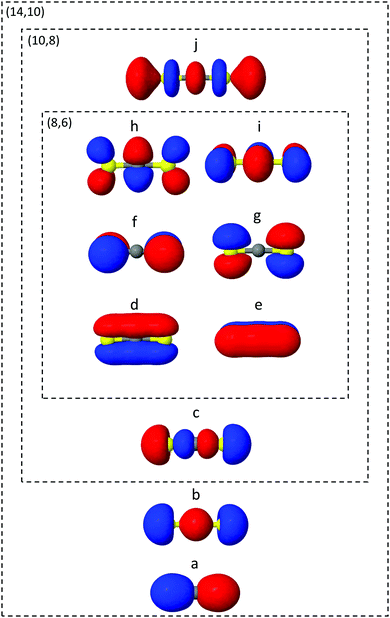
The ab initio electronic structure calculations are carried out using the Molpro software package.54 The simulations use the turbomole SVP basis set and the state-averaged complete active space self-consistent field (SA-CASSCF) method. SA-CASSCF is a post Hartree–Fock approach that captures most of the static correlation neglected in Hartree–Fock (however not dynamic correlation) via a truncation of the full configuration interaction (CI) set of Slater determinants into a chosen active space of electrons and orbitals, within which all possible permutations are allowed. Orbitals are optimised and each configuration weighted to give the best variational description of the electronic state of interest. In the state-averaged form, the orbitals are optimised to simultaneously describe a manifold of excited states with equal or comparable degree of accuracy. In the current case, the four lowest singlet and triplet states are included in the state-averaging (SA8).The orbitals included in the active spaces used in the calculations are shown in Fig. 2. The (8,6) active space in simulation A contains eight electrons distributed among six orbitals, and expands to a (10,8) active space in simulation B. Both active spaces contain the degenerate sulfur lone pair highest occupied molecular orbitals (HOMOs), the σ bonding molecular orbitals (MO) and the π* lowest unoccupied molecular orbital (LUMO) pair, labelled d–i in Fig. 2. The (10,8) active space features an additional electron pair in the second-highest occupied MO (HOMO−1), and a σ* antibonding virtual MO (c and j). In total the (8,6) active space comprises 345 determinants (225 singlet, 120 triplet) and (10,8) 5096 determinants (3136 singlet, 1960 triplet), illustrating the factorial scaling of computational cost with the size of the active space in CASSCF calculations. It is therefore important to minimise the active space to keep computations tractable, while balancing the quality of the outcomes. Finally, Fig. 2 shows the (14,10) active space used to calculate one-dimensional potential energy curves in radial and angular coordinates using MRCI(14,10)/aug-cc-pvTZ. While this is too expensive a level of theory on which to run the on-the-fly dynamics, such curves serve as a useful benchmark with which to compare the lower levels of theory.
The calculated adiabatic electronic states can be labeled according to the energy ordering (S0, S1etc. for the singlets and T1, T2etc. for the triplets), but also according to the symmetry labels in Table 2, which shows the correspondence between the diabatic and adiabatic state labels at the ground state equilibrium geometry.
| Point group | C 1 | C s | C 2v | D ∞h |
|---|---|---|---|---|
| State/notation | S0 | 1A′ | 1A1 | 1Σ+g |
| S1 | 1A′′ | 1A2 | 1Σ−u | |
| S2 | 1A′ | 1B2 | 1Δu | |
| S3 | 1A′′ | 1A2 | 1Δu | |
| T1 | 3A′ | 3B2 | 3Σ+u | |
| T2 | 3A′′ | 3A2 | 3Δu | |
| T3 | 3A′ | 3B2 | 3Δu | |
| T4 | 3A′′ | 3A2 | 3Σ−u |
3.2 Simulation parameters and initial condition selection
The simulations are performed using the surface-hopping code SHARC,48 and are combined with electronic structure calculations as already mentioned using the Molpro software package.54 To circumvent the severe computational bottleneck imposed by the calculation of full nonadiabatic coupling matrix elements (NACMEs) we turn to wavefunction overlaps, which may be generated by an efficient code integrated in the SHARC package56 and offer a faster alternative to full NACME calculation while offering stable numerical propagation of the wavefunction.For each simulation, trajectories are run for 1 ps with a time step of 0.5 fs. After a surface hop, velocities are rescaled to adjust the kinetic energy in order to conserve the total energy and a decoherence correction is applied.57 Initial positions are taken from a Wigner distribution, and initial momenta are assigned to each atom such that the total kinetic energy per molecule approximates the excess kinetic energy from excitation by excitation by a 200 nm pump pulse to the S2 state, using an in-built algorithm in SHARC. In reality such a pulse would access higher-lying electronic states of CS2 that are not included in the current simulations, but here the excess energy serves to ensure that the total energy in the system is sufficient to allow barrier crossing. Initial occupied electronic states are assigned to each trajectory by a probabilistic scheme account for the excitation energies and oscillator strengths at each initial position, again using a built-in algorithm in SHARC originally taken from ref. 58.
In simulation A, 500 initial conditions are generated from the Wigner distribution, from which 573 trajectories are launched (an initial condition may be used to launch trajectories on more than one state due to the probabilistic selection of initial states). Trajectories that fail to reach tmax = 1 ps, for instance due to convergence problems of the CASSCF electronic structure calculations at a particular time step, are treated in the following manner. If prematurely-terminated trajectories have dissociated before the point of failure, the dissociating sulfur atom is propagated to tmax at the average velocity between the point of dissociation and the last successful time step, with the last recorded MCH state taken as final (since surface hops within a particular spin multiplicity beyond dissociation have no meaningful effect on the branching ratio). Trajectories that have not dissociated before failure are discarded. By this procedure, 571 successful trajectories were obtained.
In simulation B, a larger set of 1000 initial conditions are generated from the Wigner distribution to compensate for more frequent CASSCF failures due to the larger active space. A restart procedure is applied to trajectories which fail to reach 1 ps as follows:
(1) Re-running the point-of-failure time step with internal orbital optimisation in the CASSCF step turned off, and turning it back on if the step is successful.
(2) Failing that, if the trajectory is dissociative (defined as one bond being 3 Å or longer), that bond is extended by a small percentage (1%, 2% or 5% depending on the severity of the case) and continued from the new coordinates.
Following these steps, the same assumptions in terms of propagation of the dissociated sulfur atom and its MCH state as in simulation A are applied. Since the restart procedure inevitably reduces the quality of the trajectory, the whole dataset was scanned for trajectories exhibiting discontinuous behaviour, such as unphysically large jumps in bond length during a single time step (seen most prevalently where step 2 of the above procedure was applied to trajectories with already large C–S distances). Such trajectories, comprising approximately 8% of the bunch, were filtered out, resulting in no qualitative change in the final results. Because the restart procedure applied only to trajectories past the dissociation barrier, it had no effect on the final singlet/triplet branching ratio or pre-barrier dynamics. These procedures gave a total of 1024 included trajectories for simulation B.
4 Results and discussion
4.1 Ab initio calculations
To get an idea of the performance of each level of theory, it is instructive to examine one-dimensional potential energy cuts along coordinates of interest, as shown in Fig. 3 and 4. What is immediately obvious is that despite the relatively simple premise of photodissociation in a small triatomic molecule, the underlying potential energy landscape is complex with many degeneracies, near-degeneracies, conical intersections and Renner–Teller splittings.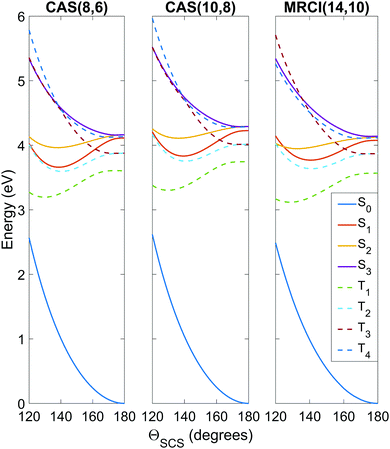 | ||
| Fig. 3 Potential energy curves as a function of the ΘSCS bending coordinate, calculated at the SA8-CAS(8,6)/SVP (simulation A), SA8-CAS(10,8)/SVP (simulation B), and MRCI(14,10)/aug-cc-pvTZ (reference) levels of theory, shown in the left, center and right panels. Bond lengths are fixed at the CASSCF(16,12)/aug-cc-pvQZ optimised value of 1.569 Å. For compactness, only the range 120° ≤ ΘSCS ≤ 180° is shown as the curves are symmetric about the linear geometry at ΘSCS = 180°. Here the states are labelled adiabatically. A full conversion table of adiabatic and diabatic state labels is given in Table 2. | ||
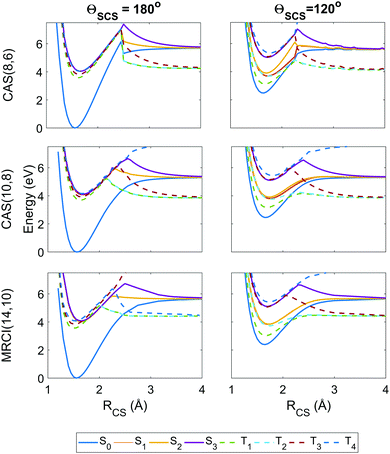 | ||
| Fig. 4 Potential energy curves as a function of the RCS stretch coordinate, with the second bond length fixed at RCS = 1.569 Å and the angle ΘSCS fixed at linear 180° (left column) and bent 120° (right column), with calculations at the SA8-CAS(8,6)/SVP (simulation A), SA8-CAS(10,8)/SVP (simulation B), and MRCI(14,10)/aug-cc-pvTZ (reference) level shown in the top, middle and bottom rows. Here the states are labelled adiabatically. A full conversion table of adiabatic and diabatic state labels is given in Table 2. | ||
Fig. 3 shows the potentials along the ΘSCS bending coordinate. Both the (8,6) and (10,8) levels of theory replicate the angular potentials of the benchmark MRCI(14,10) calculations rather well, with the predicted vertical S2 ← S0 excitation energy 4.16 eV for (8,6), 4.29 eV for (10,8), and 4.12 eV for MRCI(14,10) (see also Table 3). From the closely-packed nature of the states in the excitation region, one would expect rapid redistribution of the excited population via nonadiabatic and spin–orbit coupling already in the early stages of the dynamics. Combined with the high kinetic energy enforced on the system (2.5 eV, to make the barrier clearly accessible) and the tendency of the excited states to have their minimum energy at bent geometry, one would hazard to predict strong bending motion to be observed in the simulations. In this regard, the stories presented by the (8,6) and (10,8) levels of theory used in simulations A and B are consistent, and their angular potentials show comparatively small qualitative differences.
| CAS(8,6) | CAS(10,8) | MRCI(14,10) | ||||
|---|---|---|---|---|---|---|
| ΔE (eV) | f ij (×10−4) | ΔE (eV) | f ij (×10−4) | ΔE (eV) | f ij (×10−4) | |
| S1 ← S0 | 4.11 | 0 | 4.23 | 5.89 × 10⁻⁴ | 4.08 | 0 |
| S2 ← S0 | 4.16 | 1.38 | 4.29 | 1.70 | 4.12 | 2.13 |
| S3 ← S0 | 4.16 | 0 | 4.29 | 2.48 × 10⁻² | 4.14 | 0 |
Fig. 4 shows the radial potential energy curves along the RCS stretch coordinate corresponding to dissociation of one sulfur. In contrast to the angular curves, the active space must describe accurately not just the reactant but also the products while accounting for the electron correlation during bond breaking. The deficiencies in the (8,6) active space used in simulation A begin to manifest as discontinuities and severe exaggerations of the barrier height towards dissociation. This is particularly prevalent in the highest state considered, T4, however this state is energetically inaccessible during the simulations. Also noteworthy are unphysical undulations in the potential energy curves beyond the barrier in the smaller (8,6) calculations at ΘSCS = 120°, but these have negligible effect on the predissociation dynamics. The potential wells for the (8,6) calculations have sharper gradients along the stretch coordinate than in (10,8), so one may expect the vibrational motion to be faster in simulation A. Overall, the radial potential energy curves are much smoother in the (10,8) calculations (i.e. simulation B), with no discontinuities and a closer match to the MRCI(14,10) reference potentials. This suggests the inclusion of the antibonding occupied and virtual orbitals (c) and (j) in Fig. 2 is crucial to a proper description of bond breaking in this system; test calculations show that the extra electron pair is primarily responsible for lowering the barrier height while the extra virtual orbital serves to smooth out the potentials in the barrier region. This effect is further observed in the recent work of Trabelsi et al.62 where higher-level MRCI calculations yield even smoother potential energy curves. For a more general discussion on active space selection in CASSCF problems, the reader is directed to ref. 59–61 and citations therein.
The importance of spin–orbit coupling in this system is emphasised by the strong mixing between individual components of different triplet manifolds at equilibrium geometry e.g. the 5th spin-coupled state (corresponding to one of the states in the degeneracy between T2 and T3) consisting of ≈50% each of the T−2 and T+3 multiplet components, or the 16th spin-free state comprising 98.4% of S3 and the remainder a non-negligible contribution from T02. Such effects are extremely dependent on geometry but feature markedly in the dynamics.
Predicted oscillator strengths at each level of theory at ΘSCS = 170° are shown in Table 3 together with excitation energies. These off-linear appearances of non-zero oscillator strengths for transitions formally forbidden are a well-known effect, accounted for here by Wigner initial conditions sampling.
4.2 Simulations (population dynamics)
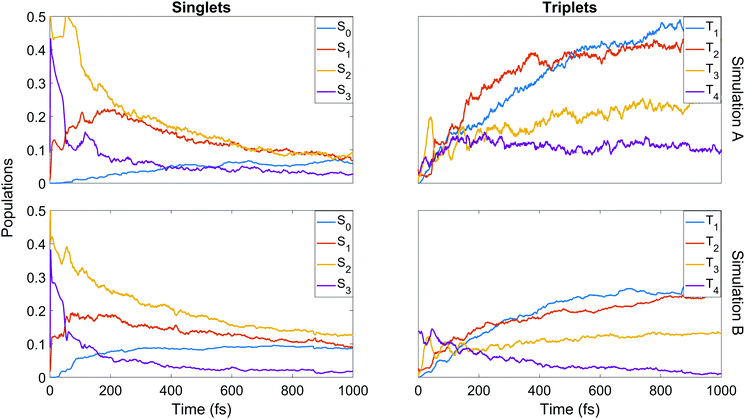
We now turn to the simulations, and begin by considering the populations on the electronic states as a function of time. The total populations on all singlet and triplet states are shown in Fig. 5, with the data taken from simulations A and B. Here, the populations are defined as the normalised summed squares of the MCH coefficients of each state. In both simulations there is a rapid decay in the singlet population (and commensurate rise in the triplet) for t > 0, which is greater in simulation A. By the end of the simulations at 1 ps, the singlet/triplet fraction for simulation A is 0.25/0.75 compared to 0.32/0.68 in simulation B, although the curves have not quite reached a plateau by 1 ps.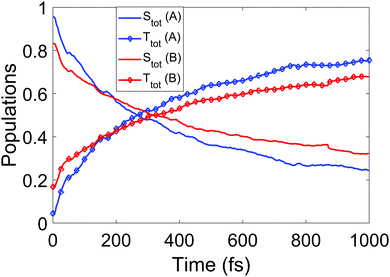 | ||
| Fig. 5 Total singlet and triplet populations (quantum) as a function of time, defined as the sum of the squares the MCH state coefficients, for simulations A and B. | ||
We continue towards a more mechanistic picture of the dynamics where the singlet and triplet populations are categorised as bound or dissociated, as shown in Fig. 6. The populations are calculated classically, i.e. using a straightforward normalised sum of the number of trajectories occupying singlet or triplet MCH states, with dissociation defined as one of the CS distances being longer than 2.73 or 2.96 Å in simulation A or B, respectively. The thresholds are defined as the minimum CS distance at which dissociation is irreversible in each simulation. The decay of the bound singlet population follows a similar profile in both simulations, decaying exponentially to approximately 15–20% of the total population by 1 ps. The other curves are qualitatively similar but differ in magnitude. The initial transfer into bound triplet at very early times is similar in both simulations, but is followed by a further rise before maintaining steadily near 50% in simulation A. This is in contrast to simulation B, where the initial rise is followed by a steady decay into the dissociation channels. Both dissociation channels are slower to rise in A, with the triplet channel activating well before the singlet. The opposite is true in B, where both channels activate at 50 fs into the dynamics with the singlet channel initially dominating, before shutting off while the triplet channel continues to rise until the end of the simulation. This latter pattern of behaviour is seen qualitatively in A, but the dissociation fractions are lower.
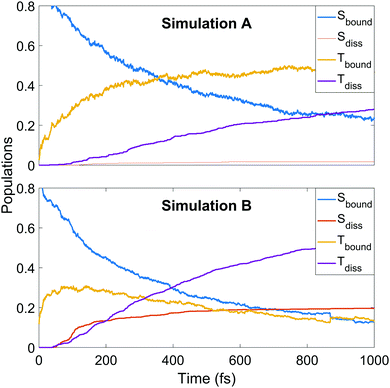 | ||
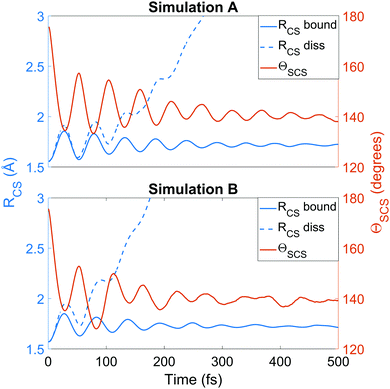
| Fig. 6 Populations of singlet and triplet states in simulation A (upper panel) and B (lower panel), separated into contributions from bound and dissociated trajectories. | ||
Thus the conclusions drawn in Section 4.1 from the simple one-dimensional potential energy cuts earlier are borne out, in that the higher barriers and steeper potentials in simulation A lead to a trapping of population in the triplet states (mediated by the spin–orbit coupling) and frustrated dissociation. The difference in the potential energy landscape have significant effect on the final reported dissociation fractions (1.8% singlet and 28% triplet in A, and 20% singlet and 54% triplet in B as fractions of the total trajectory ensembles) and corresponding ratios (singlet![[thin space (1/6-em)]](https://www.rsc.org/images/entities/char_2009.gif) :
:![[thin space (1/6-em)]](https://www.rsc.org/images/entities/char_2009.gif) triplet ratio 1
triplet ratio 1![[thin space (1/6-em)]](https://www.rsc.org/images/entities/char_2009.gif) :
:![[thin space (1/6-em)]](https://www.rsc.org/images/entities/char_2009.gif) 15.6 for A and 1
15.6 for A and 1![[thin space (1/6-em)]](https://www.rsc.org/images/entities/char_2009.gif) :
:![[thin space (1/6-em)]](https://www.rsc.org/images/entities/char_2009.gif) 2.8 for B). Therefore the exaggerated barriers to dissociation in A, while obviously impacting the overall dissociated population, also emphasise the easier access to the triplet channel, which accounts for a far higher proportion of the dissociated population in A with respect to B, where the singlet dissociation barrier is even harder to overcome.
2.8 for B). Therefore the exaggerated barriers to dissociation in A, while obviously impacting the overall dissociated population, also emphasise the easier access to the triplet channel, which accounts for a far higher proportion of the dissociated population in A with respect to B, where the singlet dissociation barrier is even harder to overcome.
We finish the discussion of the populations with a detailed view of the state-by-state populations as shown in Fig. 7. Most of the initial population in both simulations is naturally found in the bright S2 state. There is an extremely rapid distribution of population from this state (whose population drops to below 50% in less than 50 fs in both cases) amongst the other singlet states, mainly into S3 and S1. After the initial redistribution, S3 quickly loses its accrued population while S1 continues a slight rise until ≈200 fs. From this point, S1–3 all decay steadily. The ground state population is slower to rise in A, taking around 90 fs before remaining steady for the rest of the dynamics at about 7%. In B, there is an initial rise in S0 after 30 fs, a short plateau, and a second rise before leveling out at about 9%. It should be noted that after approximately 500 fs in both cases, major activity in the singlet states has ceased. This is most pronounced in A, while in B some very slow decay in S1 and S2 remains even at later times.
Some distinct fluctuations are visible in the populations, most notably an increase in S2 population in the interval 40 to 75 fs. Analysis of the surface hops in and out of S2 in this period reveal that the net flux gain is due to an influx of population from S3 and a relatively minor contribution from T3 (93% and 7% of net flux in B, where flux is simply defined as the difference between the number of hops into and hops out of S2). Looking at the state-resolved triplet populations one sees that these states also play a strong role in the early redistribution of population, reinforcing the importance of spin–orbit coupling in the early-time dynamics of the system. Other features that emerge in the first 100 fs are early out-of-phase oscillations between T3 and T4, the secondary role of T3 (whose barrier to dissociation tends to lie higher in energy than that of T1 and T2) at later times, the near-commensurate rise in T1 and T2 (clearer in simulation B) reflecting the closely-spaced nature of the respective potential energy surfaces of those states, and the steady hold of population in T4, whose high barrier to dissociation allows this state to act as a reservoir before the stored population eventually is transferred elsewhere. Analysis of the origin of hops into T3 over the first 50 fs shows that the largest contributions come from S3 and T4 (55% and 37% of net flux respectively in simulation B). The hopping analysis explains why S3, after gaining so much population in the initial redistribution via internal conversion, decays as rapidly as it does: first to T3 until ≈50 fs, then back to S2 up to ≈75 fs. This analysis shows clearly the direct competition between internal conversion and intersystem crossing characteristic of this molecule.
4.3 Simulations (structural dynamics)
We now turn to the structural dynamics. Shown in Fig. 8 are the average CS bond lengths separated into contributions from bound and dissociated trajectories, and the average ΘSCS angle for the bound trajectories. Again, similar behaviours are seen in both simulations A and B. In terms of the bond lengths, it is clear that initially it is the symmetric stretch that is excited, and it takes around 300 fs before these clear oscillations disperse. The impact of the higher dissociation barrier on the predicted dynamics in simulation A can be seen by the two clear oscillations seen in the bound RCS curve, compared to only one in simulation B, reflecting the difficulty trajectories have in getting over the barrier in A. A similar effect is seen in the average angle in that it is slower to damp in A than B.In Fig. 9, snapshots of the nuclear densities associated with the sulfur atoms are shown at a series of time points (0, 50, 100 and 1000 fs) for each simulation. These are calculated by projecting the internal coordinates onto the (x, y > 0) plane with the carbon atom placed at the origin. Only the probability density associated with the two sulfur atoms is shown, and this is calculated at each point in the plane as,
 | (3) |
![[Q with combining right harpoon above (vector)]](https://www.rsc.org/images/entities/i_char_0051_20d1.gif) ij are the coordinates of sulfur atom j in trajectory i in the plane, γ is a Gaussian width parameter equal to 1/(2σ2) where σ = 0.05, NS is the number of sulfur atoms and Ntraj is the number of trajectories. The probability density P(x,y) thus amounts to a convolution of the classical coordinates of the sulfur atoms with a normalised Gaussian function. This manner of plotting the evolution of the molecular structure provides a simple way of visualising nuclear motion and its dispersion as the reaction unfolds, while separating out electronic effects. In both simulations, at time zero all atoms are nicely localised around the equilibrium geometry, taking into account the spread of the Wigner distribution of initial positions. By 50 fs the dissociation pathway is clearly manifesting, notably to a greater extent in simulation B (albeit that the shape of the non-dissociated part of the wavepacket is approximately the same in both simulations). The spread of the vibrational wavepacket is rapid, with ΘSCS ranging from 180° to 120°. This theme continues in the two remaining snapshots, with the extent of dissociation clearly growing at 100 fs before greatly reducing by the end of the simulations at 1000 fs (reflecting the evolution of populations in Fig. 6). In simulation A, the dissociative pathway has completely stalled; this is not the case in simulation B where the dissociation of the sulfur atom is clearly still active. Full movies constructed from such snapshots are available as Movie CS2A and Movie CS2B in the ESI.†
ij are the coordinates of sulfur atom j in trajectory i in the plane, γ is a Gaussian width parameter equal to 1/(2σ2) where σ = 0.05, NS is the number of sulfur atoms and Ntraj is the number of trajectories. The probability density P(x,y) thus amounts to a convolution of the classical coordinates of the sulfur atoms with a normalised Gaussian function. This manner of plotting the evolution of the molecular structure provides a simple way of visualising nuclear motion and its dispersion as the reaction unfolds, while separating out electronic effects. In both simulations, at time zero all atoms are nicely localised around the equilibrium geometry, taking into account the spread of the Wigner distribution of initial positions. By 50 fs the dissociation pathway is clearly manifesting, notably to a greater extent in simulation B (albeit that the shape of the non-dissociated part of the wavepacket is approximately the same in both simulations). The spread of the vibrational wavepacket is rapid, with ΘSCS ranging from 180° to 120°. This theme continues in the two remaining snapshots, with the extent of dissociation clearly growing at 100 fs before greatly reducing by the end of the simulations at 1000 fs (reflecting the evolution of populations in Fig. 6). In simulation A, the dissociative pathway has completely stalled; this is not the case in simulation B where the dissociation of the sulfur atom is clearly still active. Full movies constructed from such snapshots are available as Movie CS2A and Movie CS2B in the ESI.†
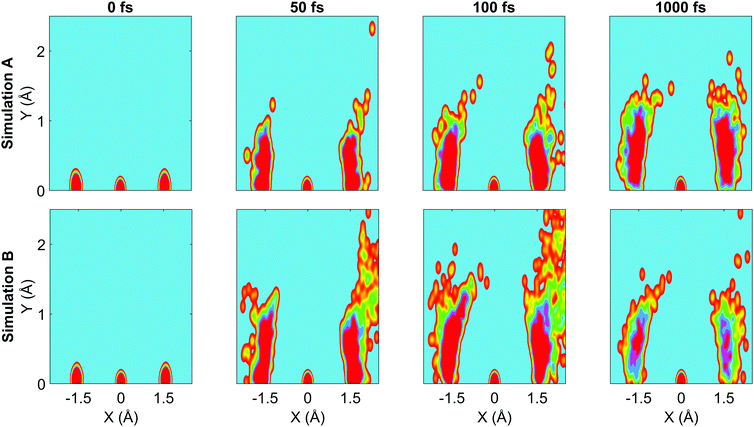 | ||
| Fig. 9 Nuclear probability density snapshots at selected time points in each simulation. These are generated by projecting the nuclear coordinates onto the XY plane and calculating the subsequent atomic densities, with the carbon atom fixed at the origin. Top row: Simulation A, bottom row: simulation B. Full movies for each simulation available in ESI.† | ||
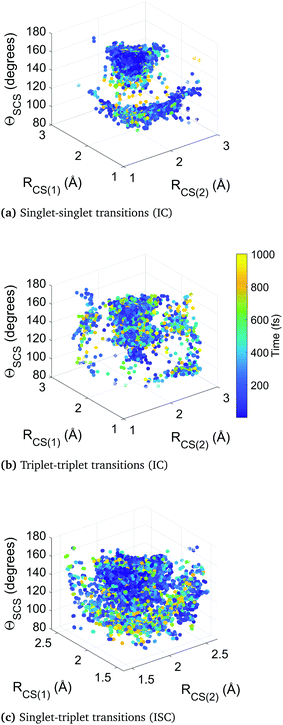
Fig. 10 collates the molecular geometry and time-point for each surface hop in the higher-level simulation B. Each data point represents an individual surface hop, defined by the two CS bond lengths, the bending angle, and the time of occurrence. The three panels show all hops within singlet states, triplet states, and between singlet and triplet states. The clusters provide insight into the correlation between nonadiabatic and spin–orbit coupling effects and the molecular geometry, as well as the evolution of the dynamics. Common to each subfigure is a dense cluster centered around early times at near equilibrium geometry, representative of the rapid internal conversion and intersystem crossing at early times and the concurrent competition between these two distinct processes. This feature is naturally less pronounced in the plot of triplet–triplet hops only, as nonadiabatic hops within the triplet manifold must be preceded by a intersystem crossing into that manifold (barring the small number of trajectories that originate in a triplet state). There is an additional well-defined cluster in the singlet-to-singlet panel corresponding to one elongated CS bond and a narrow distribution of acute bending angles, reflective of the other main region the different singlet electronic states come closer together in energy as they approach and exceed the barrier crossing region. This is seen to be broadly symmetric across both bonds. A similar effect is seen in the triplet-to-triplet panel, but here it is not nearly as restricted in terms of angular range due to the smaller variation of energy spacing with bending angle in the triplet states. The spin–orbit coupling (intersystem crossing) surface hops in the singlet–triplet panel are in contrast are far more tightly clustered in the Franck–Condon region because trajectories spending time is this region are constantly exposed to singlet and triplet states lying close to each other.
4.4 Branching ratios, convergence, and timings
The final branching ratio between singlet and triplet dissociation is given in Table 4. Both simulations show the same qualitative trend, in that the triplet pathway is the dominant dissociation pathway due to its lower barrier to dissociation supported by the strength of spin–orbit coupling in the system. This ratio is exaggerated in simulation A, as a consequence of the overestimation of the barriers to dissociation in the singlet states. We note that although a pathway that results in C+S2 fragments is possible,62 this dissociation channel is not observed in our simulations.| Simulation | S branch | T branch |
|---|---|---|
| A | 0.059 | 0.941 |
| B | 0.267 | 0.733 |
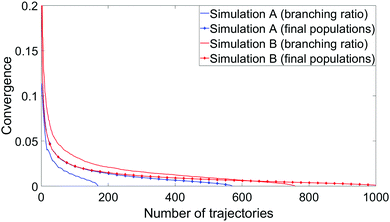
To measure convergence of each simulation, we use two measures; the branching ratio as a function of the number of dissociated trajectories, and the state populations at t = 1 ps as a function of all trajectories. For each metric, we calculate the variance V(N) (or the mean of all the V(N) in the case of final state populations) for random subsets of trajectories for N ∈ [1,Ntraj], with,
 | (4) |
Example timing information between the two simulations is shown in Table 5. For simplicity, these are based on four representative trajectories with identical initial conditions, run with either the (8,6) or (10,8) active spaces and either the overlap or NACME coupling schemes. Whilst merely illustrative, these give approximate measures as to the growth in expense from method to method. Changing the coupling scheme from overlaps to NACMEs increases per-time step expense by 78% and 119% for the (8,6) and (10,8) active spaces respectively, while increasing the active space from (8,6) to (10,8) increases expense by 337% and 434% for overlap and NACME simulations respectively. Accounting for the fact that multiple NACMEs and gradients are calculated at each step, it is those components which contribute the most to total compute time.
| Wall clock time (s) | (8,6)/overlap | (8,6)/NACME | (10,8)/overlap | (10,8)/NACME |
|---|---|---|---|---|
| a In NACME simulations no separate CASSCF-only calculation is carried out, but this value can be approximated by the corresponding overlap simulation. | ||||
| Integrals | 0.696 | 0.701 | 0.749 | 0.813 |
| CASSCF | 1.620 | 1.620a | 3.942 | 3.942a |
| Gradients | 2.689 | 2.476 | 14.037 | 11.905 |
| Spin–orbit coupling | 3.379 | 3.347 | 7.449 | 7.831 |
| NACMEs | — | 2.318 | — | 14.365 |
| WF overlaps | 1.017 | — | 1.152 | — |
| Total ab initio time | 28.970 | 51.791 | 126.470 | 276.625 |
5 Conclusions
We have compared two different simulations of the photodissociation of CS2 when the molecule is excited to the first 1B2 state. The simulations consist of swarms of surface-hopping trajectories evolving on potential energy surfaces generated on-the-fly as implemented in SHARC,48 with electronic structure calculations at the SA-CASSCF level in Molpro.54 The chief difference between the simulations lies in the choice of active space, (8,6) versus (10,8), and we examine the impact this has on the dynamical outcomes. The smaller active space is shown to exhibit frustrated dissociation primarily due to the excessively high potential barriers wrought by the more limited active space, whose orbitals fail to describe the bond-breaking regime of the potential energy landscape adequately. This deficiency is not observed in the larger active space, where the addition of only two extra orbitals (one occupied, one virtual) greatly enhances the description of the chemistry. Naturally, further improvements could be made with an even larger active space, as exemplified by the reference ab initio potential energy curves calculated at the MRCI(14,10)/aug-cc-pvTZ level. However, the computational cost would be extreme if the goal was to include both nonadiabatic and spin–orbit coupling in the on-the-fly dynamics at this level.An important observation is that examination of potential energy curves along key coordinates provides a reasonably reliable prediction of the nature and shortcomings of the dynamics in systems whose potential energy landscape contains distinct topological features such as dissociation barriers, especially if more accurate potential energy curves are available for reference. Therefore, it is often valuable to include such representative potential energy curves (which may correspond to minimum energy paths for systems of high dimensionality where the reaction coordinate is not obvious) alongside published simulations, preferably accompanied by accurate reference calculations. The observed correlation between potential energy surfaces and dynamics is hardly surprising, but intriguingly, one might argue that lower-level ab initio calculations can still produce dynamics that yields qualitative insights into the photochemistry, especially if the shortcomings of the electronic structure calculations have been properly assessed and are considered during the analysis—but careful attention must be paid to the subtle effects which may be lost, for example in this case the switch in order between the rise of each dissociation channel. While the most important benchmark of any simulation is relevant experimental data, a particular experiment provides only a partial view of a given process. As such, in most cases it is difficult to conclusively prove or disprove the results of simulations and complementary quality measures (such as for instance evaluation of the potential energy curves) can provide important guidance on the veracity of the simulations.
In providing a detailed analysis of the CS2 dissociation dynamics, we have made extensive use of mappings of the population and structural dynamics. We particularly wish to highlight the spatio-temporal mapping of the nonadiabatic (singlet–singlet and triplet–triplet) transitions, corresponding to internal conversion, as well as the singlet–triplet spin–orbit coupled transitions, corresponding to intersystem crossing, which provide interesting insight into the dynamics (such as the direct competition between IC and ISC, processes conventionally considered sequential) that is otherwise hard to disentangle from the abundant data produced by the simulations. It is worth emphasising that even in an apparently simple molecule such as CS2, remarkable complexity lies hidden in the interplay between spin–orbit-coupled electronic states and nuclear motion, a topic on which there remains much work to be done in terms of trajectory-based dynamics simulation methods.
Conflicts of interest
There are no conflicts to declare.Acknowledgements
The authors acknowledge helpful discussions with Dr Sebastian Mai (SHARC) and Dr David Rogers (ab initio electronic structure calculations). A. K. acknowledges support from a Royal Society of Edinburgh Sabbatical Fellowship (58507) and a research grant from the Carnegie Trust for the Universities of Scotland (CRG050414). R. S. M. acknowledges funding from the Royal Society (UF100047 and UF150655). D. B. acknowledges an EPSRC studentship from the University of Edinburgh. The computational work reported used the ARCHER UK National Supercomputing Service (http://www.archer.ac.uk) and the Edinburgh Compute and Data Facility ECDF (http://www.ecdf.ed.ac.uk).References
- R. S. Minns and A. Kirrander, Faraday Discuss., 2016, 194, 11–13 RSC.
- A. Stolow, Faraday Discuss., 2013, 163, 9 RSC.
- G. A. Worth and L. S. Cederbaum, Annu. Rev. Phys. Chem., 2004, 55, 127 CrossRef CAS PubMed.
- W. Domcke and D. R. Yarkony, Annu. Rev. Phys. Chem., 2012, 63, 325 CrossRef CAS PubMed.
- D. G. Fedorov, S. Koseki, M. W. Schmidt and M. S. Gordon, Int. Rev. Phys. Chem., 2003, 22, 551–592 Search PubMed.
- C. M. Marian, WIREs Comput. Mol. Sci., 2012, 2, 187–203 Search PubMed.
- A. R. Attar, A. Bhattacherjee, C. D. Pemmaraju, K. Schnorr, K. D. Closser, D. Prendergast and S. R. Leone, Science, 2017, 356, 54–59 CrossRef CAS PubMed.
- H. J. Wörner, J. B. Bertrand, B. Fabre, J. Higuet, H. Ruf, A. Dubrouil, S. Patchkovskii, M. Spanner, Y. Mairesse, V. Blanchet, E. Mevel, E. Constant, P. B. Corkum and D. M. Villeneuve, Science, 2011, 334, 208–212 CrossRef PubMed.
- Y. Pertot, C. Schmidt, M. Matthews, A. Chauvet, M. Huppert, V. Svoboda, A. von Conta, A. Tehlar, D. Baykusheva, J.-P. Wolf and H. J. Wörner, Science, 2017, 355, 264–267 CrossRef CAS PubMed.
- A. D. Smith, E. M. Warne, D. Bellshaw, D. A. Horke, M. Tudorovskya, E. Springate, A. J. H. Jones, C. Cacho, R. T. Chapman, A. Kirrander and R. S. Minns, Phys. Rev. Lett., 2018, 120, 183003 CrossRef PubMed.
- C. Z. Bisgaard, O. J. Clarkin, G. Wu, A. M. D. Lee, O. Gessner, C. C. Hayden and A. Stolow, Science, 2009, 323, 1464–1468 CrossRef CAS PubMed.
- P. Hockett, C. Z. Bisgaard, O. J. Clarkin and A. Stolow, Nat. Phys., 2011, 7, 612–615 Search PubMed.
- M. P. Minitti, J. M. Budarz, A. Kirrander, J. S. Robinson, D. Ratner, T. J. Lane, D. Zhu, J. M. Glownia, M. Kozina, H. T. Lemke, M. Sikorski, Y. Feng, S. Nelson, K. Saita, B. Stankus, T. Northey, J. B. Hastings and P. M. Weber, Phys. Rev. Lett., 2015, 114, 255501 CrossRef CAS PubMed.
- J. Yang, J. Beck, C. J. Uiterwaal and M. Centurion, Nat. Commun., 2015, 6, 8172 CrossRef PubMed.
- T. Ishikawa, S. A. Hayes, S. Keskin, G. Corthey, M. Hada, K. Pichugin, A. Marx, J. Hirscht, K. Shionuma, K. Onda, Y. Okimoto, S.-y. Koshihara, T. Yamamoto, H. Cui, M. Nomura, Y. Oshima, M. Abdel-Jawad, R. Kato and R. J. D. Miller, Science, 2015, 350, 1501–1505 CrossRef CAS PubMed.
- M. P. Minitti, J. M. Budarz, A. Kirrander, J. Robinson, T. J. Lane, D. Ratner, K. Saita, T. Northey, B. Stankus, V. Cofer-Shabica, J. Hastings and P. M. Weber, Faraday Discuss., 2014, 171, 81 RSC.
- C. C. Pemberton, Y. Zhang, K. Saita, A. Kirrander and P. M. Weber, J. Phys. Chem. A, 2015, 119, 8832 CrossRef CAS PubMed.
- B. Stankus, J. M. Budarz, A. Kirrander, D. Rogers, J. Robinson, T. J. Lane, D. Ratner, J. Hastings, M. P. Minitti and P. M. Weber, Faraday Discuss., 2016, 194, 525–536 RSC.
- J. M. Budarz, M. P. Minitti, D. V. Cofer-Shabica, B. Stankus, A. Kirrander, J. B. Hastings and P. M. Weber, J. Phys. B: At., Mol. Opt. Phys., 2016, 49, 034001 CrossRef.
- T. J. A. Wolf, T. S. Kuhlman, O. Schalk, T. J. Martinez, K. B. Møller, A. Stolow and A.-N. Unterreiner, Phys. Chem. Chem. Phys., 2014, 16, 11770 RSC.
- K. Wang, V. McKoy, P. Hockett and M. S. Schuurman, Phys. Rev. Lett., 2014, 112, 113007 CrossRef PubMed.
- D. V. Makhov, K. Saita, T. J. Martinez and D. V. Shalashilin, Phys. Chem. Chem. Phys., 2015, 17, 3316 RSC.
- G. Wu, S. P. Neville, O. Schalk, T. Sekikawa, M. N. R. Ashfold, G. A. Worth and A. Stolow, J. Chem. Phys., 2015, 142, 074302 CrossRef PubMed.
- M. Ruckenbauer, S. Mai, P. Marquetand and L. González, Sci. Rep., 2016, 6, 35522 CrossRef CAS PubMed.
- M. Tudorovskaya, R. S. Minns and A. Kirrander, Phys. Chem. Chem. Phys., 2018, 20, 17714–17726 RSC.
- G. W. Richings and G. A. Worth, J. Chem. Phys., 2014, 141, 244115 CrossRef PubMed.
- G. Capano, C. J. Milne, M. Chergui, U. Rothlisberger, I. Tavernelli and T. J. Penfold, J. Phys. B: At., Mol. Opt. Phys., 2015, 48, 214001 CrossRef.
- A. Kirrander, K. Saita and D. V. Shalashilin, J. Chem. Theory Comput., 2016, 12, 957–967 CrossRef CAS PubMed.
- S. P. Neville, M. Chergui, A. Stolow and M. S. Schuurman, Phys. Rev. Lett., 2018, 120, 243001 CrossRef PubMed.
- S. Y. Grebenshchikov, J. Chem. Phys., 2012, 137, 021101 CrossRef PubMed.
- A. Kirrander, H. H. Fielding and Ch. Jungen, J. Chem. Phys., 2007, 127, 164301 CrossRef CAS PubMed.
- A. Kirrander, H. H. Fielding and Ch. Jungen, J. Chem. Phys., 2010, 132, 024313 CrossRef CAS PubMed.
- M. H. Beck, A. Jäckle, G. A. Worth and H.-D. Meyer, Phys. Rep., 2000, 324, 1–105 CrossRef CAS.
- B. G. Levine, J. D. Coe, A. M. Virshup and T. J. Martinez, Chem. Phys., 2008, 347, 3 CrossRef CAS.
- G. Worth, M. Robb and B. Lasorne, Mol. Phys., 2008, 106, 2077–2091 CrossRef CAS.
- M. Richter, P. Marquetand, J. González-Vázquez, I. Sola and L. González, J. Chem. Theory Comput., 2011, 7, 1253–1258 CrossRef CAS PubMed.
- J. C. Tully, J. Chem. Phys., 2012, 137, 22A301 CrossRef PubMed.
- M. Persico and G. Granucci, Theor. Chem. Acc., 2014, 133, 1526 Search PubMed.
- G. Richings, I. Polyak, K. Spinlove, G. Worth, I. Burghardt and B. Lasorne, Int. Rev. Phys. Chem., 2015, 34, 269–308 Search PubMed.
- D. V. Makhov, C. Symonds, S. Fernandez-Alberti and D. V. Shalashilin, Chem. Phys., 2017, 493, 200–218 CrossRef CAS.
- O. Schalk, T. Geng, T. Thompson, N. Baluyot, R. D. Thomas, E. Tapavicza and T. Hansson, J. Phys. Chem. A, 2016, 120, 2320–2329 CrossRef CAS PubMed.
- S. Mai, M. Richter, P. Marquetand and L. González, Chem. Phys., 2017, 482, 9–15 CrossRef CAS.
- R. J. Squibb, M. Sapunar, A. Ponzi, R. Richter, A. Kivimäki, O. Plekan, P. Finetti, N. Sisourat, V. Zhaunerchyk, T. Marchenko, L. Journel, R. Guillemin, R. Cucini, M. Coreno, C. Grazioli, M. D. Fraia, C. Callegari, K. C. Prince, P. Decleva, M. Simon, J. H. D. Eland, N. Doslić, R. Feifel and M. N. Piancastelli, Nat. Commun., 2018, 9, 63 CrossRef CAS PubMed.
- M. Barbatti, Z. Lan, R. Crespo-Otero, J. J. Szymczak, H. Lischka and W. Thiel, J. Chem. Phys., 2012, 137, 22A503 CrossRef PubMed.
- T. Horio, R. Spesyvtsev and T. Suzuki, Opt. Express, 2013, 21, 22423–22428 CrossRef PubMed.
- R. Spesyvtsev, T. Horio, Y.-I. Suzuki and T. Suzuki, J. Chem. Phys., 2015, 142, 074308 CrossRef CAS PubMed.
- D. Bellshaw, D. A. Horke, A. D. Smith, H. M. Watts, E. Jager, E. Springate, O. Alexander, C. Cacho, R. T. Chapman, A. Kirrander and R. S. Minns, Chem. Phys. Lett., 2017, 683, 383–388 CrossRef CAS.
- S. Mai, M. Richter, M. Ruckenbauer, M. Oppel, P. Marquetand and L. González, SHARC: Surface Hopping Including Arbitrary Couplings – Program Package for Non-Adiabatic Dynamics, sharc-md.org, 2014.
- S. Mai, P. Marquetand and L. González, Int. J. Quantum Chem., 2015, 115, 1215–1231 CrossRef CAS.
- J. C. Tully, J. Chem. Phys., 1990, 93, 1061–1071 CrossRef CAS.
- S. P. McGlynn, J. W. Rabalais, J. R. McDonald and V. Scherr, Chem. Rev., 1971, 71, 73–108 CrossRef CAS.
- S. Ahmed and V. Kumar, Pramana, 1992, 39, 367–380 CrossRef CAS.
- L. M. Goss, G. J. Frost, D. Donaldson and V. Vaida, Geophys. Res. Lett., 1995, 22, 2609–2612 CrossRef CAS.
- H.-J. Werner, P. J. Knowles, G. Knizia, F. R. Manby and M. Schützet al., MOLPRO, version 2012.1, a package of ab initio programs Search PubMed.
- Q. Zhang and P. H. Vaccaro, J. Phys. Chem., 1995, 99, 1799–1813 CrossRef CAS.
- F. Plasser, M. Ruckenbauer, S. Mai, M. Oppel, P. Marquetand and L. González, J. Chem. Theory Comput., 2016, 12, 1207–1219 CrossRef CAS PubMed.
- G. Granucci, M. Persico and A. Zoccante, J. Chem. Phys., 2010, 133, 134111 CrossRef PubMed.
- M. Barbatti, M. Ruckenbauer, F. Plasser, J. Pittner, G. Granucci, M. Persico and H. Lischka, Wiley Interdiscip. Rev.: Comput. Mol. Sci., 2014, 4, 26–33 CAS.
- B. O. Roos, Adv. Chem. Phys., 1987, 69, 399–445 CAS.
- D. M. Rogers, C. Wells, M. Joseph, V. J. Boddington and J. J. McDouall, J. Mol. Struct.: THEOCHEM, 1998, 434, 239–245 CrossRef CAS.
- V. Veryazov, P. Å. Malmqvist and B. O. Roos, Int. J. Quantum Chem., 2011, 111, 3329–3338 CrossRef CAS.
- T. Trabelsi, M. M. Al-Mogren, M. Jochlaf and J. S. Francisco, J. Chem. Phys., 2018, 149, 064304 CrossRef PubMed.
Footnote |
| † Electronic supplementary information (ESI) available. See DOI: 10.1039/c8cp05693e |
| This journal is © the Owner Societies 2019 |

