 Open Access Article
First-principles theoretical assessment of catalysis by confinement: NO–O2 reactions within voids of molecular dimensions in siliceous crystalline frameworks†
Matteo
Maestri
 *a and
Enrique
Iglesia
 *b
*b
aLaboratory of Catalysis and Catalytic Processes, Dipartimento di Energia, Politecnico di Milano, via La Masa 34, 20156 Milano, Italy. E-mail: matteo.maestri@polimi.it
bDepartment of Chemical and Biomolecular Engineering, University of California at Berkeley and E.O. Lawrence National Laboratory, Berkeley, CA 94720, USA. E-mail: iglesia@berkeley.edu
First published on 1st June 2018
Abstract
Density functional theory methods that include dispersive forces are used to show how voids of molecular dimensions enhance reaction rates by the mere confinement of transition states analogous to those involved in homogeneous routes and without requiring specific binding sites or structural defects within confining voids. These van der Waals interactions account for the observed large rate enhancements for NO oxidation in the presence of purely siliceous crystalline frameworks. The minimum free energy paths for NO oxidation within chabazite (CHA) and silicalite (SIL) frameworks involve intermediates similar in stoichiometry, geometry, and kinetic relevance to those involved in the homogeneous route. The termolecular transition state for the kinetically-relevant cis-NOO2NO isomerization to trans-NOO2NO is strongly stabilized by confinement within CHA (by 36.3 kJ mol−1 in enthalpy) and SIL (by 39.2 kJ mol−1); such enthalpic stabilization is compensated, in part, by concomitant entropy losses brought forth by confinement (CHA: 44.9; SIL: 45.3, J mol−1 K−1 at 298 K). These enthalpy and entropy changes upon confinement agree well with those measured and combine to significantly decrease activation free energies and are consistent with the rate enhancements that become larger as temperature decreases because of the more negative apparent activation energies in confined systems compared with homogeneous routes. Calculated free energies of confinement are in quantitative agreement with measured rate enhancements and with their temperature sensitivity. Such quantitative agreements reflect preeminent effects of geometry in determining the van der Waals contributions from contacts between the transition states (TS) and the confining walls and the weak effects of the level of theory on TS geometries. NO oxidation reactions are chosen here to illustrate these remarkable effects of confinement because detailed kinetic analysis of rate data are available, but also because of their critical role in the treatment of combustion effluents and in the synthesis of nitric acid and nitrates. Similar effects are evident from rate enhancements by confinement observed for Diels–Alder and alkyne oligomerization reactions. These reactions also occur in gaseous media at near ambient temperatures, for which enthalpic stabilization upon confinement of their homogeneous transition states becomes the preeminent component of activation free energies.
Introduction
Zeotypes are effective catalysts for many chemical reactions, ranging from chemical transformations of hydrocarbons and oxygenates to the abatement of NOx emissions from combustion effluent streams. These materials, when present as silicate structures, consist of SiO4 tetrahedra that can be assembled into different framework arrangements to form periodic structures containing voids of molecular dimensions and diverse geometries. When Al3+ cations replace Si4+ in one of these tetrahedra, the net negative charge is balanced by cationic species, such as Na+, Cu+, Zn2+ or protons.1 A proton bound to the oxygen atom at a Si–O–Al bridge forms a Brønsted acid site, which provides the ubiquitous reactivity of zeolites in the practice of acid catalysis.Confinement effects mediated by van der Waals (vdW) forces give rise to shape selective effects in chemical reactions, thus accounting for the most consequential property of zeolites in their diverse use as catalysts.2,3 In spite of acid sites that are weaker than in many other mesoporous solids, turnover rates are often higher and quite sensitive to the size and shape of the voids and of reactants, intermediates, and transition states.4,5 Recent studies have shown that the catalytic consequences of confinement define reactivity and selectivity differently, depending on the reaction temperatures.4,6,7 In particular, microporous solids remarkably enhance rates (by >105-fold) through confinement effects for NO oxidation reactions at near ambient temperatures; such enhancements reflect enthalpic stabilization effects that compensate for the entropic penalties of confinement at these low temperatures.7 These rate enhancements by confinement are observed even in purely siliceous forms of pentasil (MFI), beta (BEA) and chabazite (CHA) frameworks, which consist of neutral frameworks without specific binding sites created by heteroatom framework substitutions. Some of these catalytic materials lack even traces of structural defects and their purposeful introduction in some samples did not lead to detectable catalytic consequences.
These observations indicate that microporous structures can act not only as sieving media by preventing access to intracrystalline active sites for large molecules, but also influence the Gibbs free energy of specific transition states (TS) by their mere confinement, without the specific involvement of distinct binding sites. Mechanistic interpretations and detailed assessments using theory are required to confirm these conclusions, as well as to link specific structural details with these remarkable reactivity enhancements. In doing so, these treatments must consider how the TS structures that mediate homogeneous reactions in unconfined spaces can be stabilized relative to their precursors only by their “adsorption” within voids, especially at low temperatures, for which enthalpic stabilization prevails over the entropic losses brought forth by confinement in determining the relevant activation free energies. Computational methods can provide such insights and confirmations, while also refining our current mechanistic interpretations of these phenomena at the molecular scale,8 but these systems must be treated at a level of theory that accounts for the weak dispersion forces that stabilize the relevant transition state.9–16
Here, we examine the role of dispersive interactions on catalytic reactivity in the context of NO oxidation catalysis within CHA and SIL zeolite voids using density functional theory (DFT) methods that account for van der Waals forces.8,17–19 We first examine the relevant reaction coordinate for the homogeneous reactions of NO with O2 and the termolecular transition states and precursor species by means of free energy calculations, thus making comparisons possible between calculated reaction parameters and measured rates. These pathways are then compared with those occurring within the voids of CHA and SIL frameworks. The contributions of confinement are assessed by calculations using functionals that either exclude or include corrections for dispersive forces, so as to clearly discern the effects that are specific to confinement.
These methods show that minimum energy paths (MEP) on CHA and SIL involve the same elementary steps in confined and homogeneous environments, in terms of both the geometry and the kinetic relevance of the stable intermediates and TS. For each individual elementary step that interconverts confined species, confinement within voids did not influence significantly the relevant energies because the reactants, products, and transition states are of similar molecularity and size, and are stabilized by confinement to similar extents. Measured rates reflect, however, the energy of the relevant termolecular transition states relative to those of their unconfined gaseous reactants. Enthalpic stabilization prevails over the concomitant losses in entropy upon confinement at the low temperatures of NO oxidation catalysis (<423 K), leading to effects of confinement that decrease the activation free energies relevant for reactivity. As a result, reactivity depends strongly on the enthalpic stabilization of transition states provided by vdW interactions conferred by confinement. Reaction rates are enhanced by the sole containment of the transition states that mediate homogeneous reactions without the involvement of any specific binding centers. DFT-derived rate enhancement factors from confinement are in quantitative agreement with measured values over a broad temperature range, even though state-of-the-art quantum mechanical treatments of the homogeneous NO oxidation minimum energy surfaces do not accurately capture the quantum mechanical components of energies for such systems.20–24 Such quantitative agreements reflect preeminent effects of geometry in determining the van der Waals contributions from contacts between the TS and the confining walls and the weak effects of the level of theory on TS geometries. These NO oxidation rate enhancements upon confinement are largest at low temperatures; as a result, such phenomena may contribute significantly to the conversion of NO to NO2 during cold-start conditions in selective catalytic reduction (SCR) of NO with NH3, a process that requires NO2 for fast-SCR routes often catalyzed by catalyst containing CHA frameworks.25–30 Such low-temperature routes also favor high equilibrium conversions, which are required in exothermic NO2 formation processes used in the production of nitric acid and nitrate salts.31 These findings may also play a role in the nitric oxide oxidation catalysed by microporous carbonaceous materials.32–34
Such “catalysis by confinement”, denoted in early studies as physical catalysis,35 is expected to be of consequence in other reactions with low enthalpic barriers but with large entropy losses upon formation of their transition states; such reactions include Diels–Alder and alkyne oligomerization reactions, which occur in gaseous media at low temperatures, making enthalpies the preeminent component of activation free energies. For instance, these results provide the mechanistic underpinnings for interpreting the rate enhancements for Diels–Alder cyclization of buta-1,3-diene to 4-vinyl-cyclohexene by physical confinement within the cages of purely siliceous zeolites.36
Methods
Density functional theory (DFT) calculations were performed within the generalized gradient approximation proposed by Perdew, Burke and Ernzerhof (PBE)37 using periodic plane-waves and ultrasoft pseudo-potentials (60 Ry energy cut-off) in the Quantum Espresso package.38 Brillouin zone sampling was restricted to the Γ-point. All the atoms in the unit cell were allowed to relax and the convergence criterion for the forces on each atom was set to 0.02 eV Å−1. The unit cells were constructed with 108 atoms (CHA, a = b = 1.368, c = 1.477 nm and α = 90°, β = 90°, γ = 120°) or 288 atoms (SIL, a = 2.009, b = 1.974, c = 1.314 nm and α = β = γ = 90°) using initial structures from the ZEOMICS database.39 These structures were relaxed to obtain optimized cell parameters for CHA (a = b = 1.371, c = 1.480 nm) and SIL (a = 2.006, b = 1.940, c = 1.308 nm).Quantum chemical methods describe dispersion forces accurately only with higher-level wave-function methods, such as second order Møller–Plesset (MP2) perturbation theory.40 Even with efficient embedding cluster schemes,41,42 MP2-level treatments remain computationally inaccessible for transition state sampling and for the analysis of all plausible reaction paths in complex many-atom structures, such as zeolites.19 Therefore, we use here Grimme-D2 methods, which account for dispersion forces directly at the DFT level by correcting the DFT-derived energy a posteriori for the dispersion effects.43,44 In structure optimizations and TS searches, these a posteriori corrections are included for each energy calculation in the iterative energy minimization algorithms.
The structures in the confined spaces were first optimized. Then, the converged structures were perturbed both in position and orientation in the cavity and re-optimized in order to ensure that structures represented global energy minima throughout a void space that lacks specific attachment points at which to locate the confined moieties. Reaction coordinates and transition state structures were identified using the Climbing Image Nudged Elastic Band (CI-NEB) method.45,46 First, the minimum energy paths (MEP) between two minima were identified using the NEB method with convergence criteria of 0.1 eV Å−1; the transition state along the converged NEB path was then further refined using CI-NEB with a more stringent convergence criterion (<0.05 eV Å−1). Each TS structure was confirmed by its presence as the only structure with one imaginary frequency along the reaction coordinate. Vibrational frequency calculations were performed for intermediates and transition states using a finite-difference approximation of the Hessian matrix as implemented in Atomic Simulation Environment (ASE).47
For gas-phase reactions, the relative energies and geometries of intermediates and transition states have been refined both with B3LYP functionals and at the MP2 level by using Gaussian0948 and the Berny algorithm.49 NO, O2 and NO2 are characterized by different spin multiplicities in their lowest energy configuration. This can lead to crossings of the potential energy surfaces along the reaction coordinate and to possible spin–spin coupling effects that can lead, in turn, to unexpected stabilization of specific TS structures.50–52 Thus, intermediates and transition states were isolated along the reaction coordinate by examining the full MEP for each spin state using NEB and spin-polarized calculations.53
Statistical thermodynamics formalisms were used to calculate entropies and enthalpies. For all gaseous species, the system was assumed to be thermodynamically ideal and contributions from translation, rotation, and vibration were accounted for by using anharmonic frequency calculations as implemented in Gaussian09.48 Confined species were assumed to be mobile within the entire volume of the voids.54–56 Thus, low frequencies modes (<100 cm−1) of the rotational and translational components for all confined species with only small coupling to internal vibrations were removed from the vibrational partition function and replaced by their “free” translational and rotational entropy contributions. Given the absence of specific binding sites, all three translational modes were assumed to be accessible to the confined structures. Thus, the corresponding partition functions require the definition of a three-dimensional volume, which is taken here as the volume of the largest possible sphere (diameter ds) that can be fully inscribed within the framework.39,57 The translation partition function then becomes:
 | (1) |
 | (2) |
Results and discussion
Rate enhancements upon confinement reflect free energy differences between confined and homogeneous (i.e., unconfined) TS structures, for which geometry and its consequences for van der Waals contacts between the TS and the confining voids are most relevant. Thus, theoretical treatments must first describe the geometries of the transition states in homogeneous routes, which are then embedded within voids in order to account for confinement effects. Therefore, here we examine the reaction coordinate of NO with O2 by means of free energy calculations both in unconfined spaces and within the voids of CHA and SIL frameworks.Minimum free energy pathway for homogeneous NO–O2 reactions in the unconfined gas phase
Homogeneous NO oxidation reactions| 2NO + O2 → 2NO2 | (3) |
Such mechanistic details become accessible only through theoretical treatments that seek to capture the details of the required making and breaking of chemical bonds. Previous theoretical studies have addressed the enthalpies of plausible intermediates and TS structures for homogeneous NO–O2 reactions using different levels of theory, ranging from DFT (PBE and B3LYP functionals) to coupled-cluster CCSD(T), complete active space self-consistent field (CASSCF) and complete active space with second order perturbation theory levels (CASPT2/cc-pVDZ).20–22,59 These studies share a strong consensus about the involvement of the various N2O4 isomers in the initial quasi-equilibrated steps that form the precursor to the termolecular TS. None of these treatments, however, leads to activation enthalpies (from −20.5 kJ mol−1 at DFT-B3LYP/6-311+G(2d)21 to +6.5 kJ mol−1 at CCSD(T,full)/aug-cc-pVTZ20) in quantitative agreement with reported experimental values (−4.4 kJ mol−1).58 The discrepancies between the measured values and theoretical estimates in these studies reflect the fact that currently available quantum mechanical treatments do not provide consistent and reliable energy estimates for N2O4 intermediates or transition state structures along the NO oxidation reaction coordinate. These inaccuracies reflect resonance effects that influence to different extents the energies of NO2, each N2O4 isomer and the termolecular transition states and which evolve in their relevance as bonds form and cleave.23,24 Multireference wavefunction treatments are required to describe these resonance effects as well as spin–spin coupling and dynamic correlations within the bond pairs.23 Also, these previous studies20–22,59 are based on the use of energy or enthalpy values, instead of free energies, to determine the kinetic relevance of each elementary step.
Here we have performed the analysis of the identity and kinetic relevance of plausible elementary steps based on the Gibbs free energies of intermediates and transition states. We followed the approach of Liu and Goddard,23 who examined the isomerization of gaseous N2O4 dimers by first locating all stationary points and TS along the reaction pathway at the DFT level.
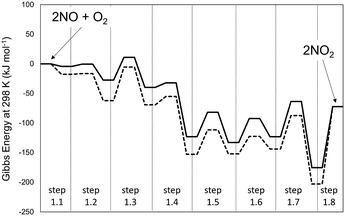
DFT-derived geometries, enthalpies, and entropies are reported here for plausible transition states and intermediates involved in the elementary steps that mediate homogeneous NO–O2 reactions. All the energies reported in the text of this section, unless noted otherwise, are free energies at 298 K and 1 bar using B3LYP/cc-pVTZ with Grimme D2 corrections to account for dispersive interactions. Fig. 1 shows the minimum energy path (MEP) that defines the reaction coordinate between reactants (2 NO + O2) and products (2NO2) in terms of energies evaluated at 0 K (Fig. 1a) and Gibbs free energies (298 K, 1 bar; Fig. 1b).
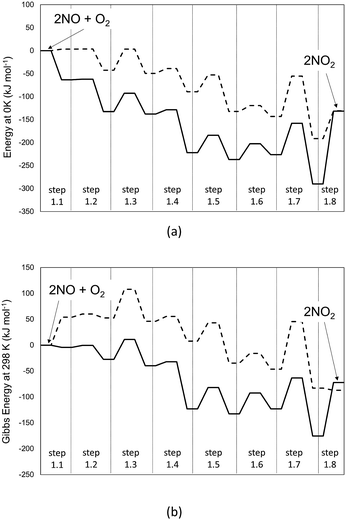 | ||
| Fig. 1 Profile of the MEP for energy at 0 K (panel a) and Gibbs free energy at 298 K and 1 bar (panel b) for the homogeneous reaction 2NO + O2 → 2NO2, obtained at different levels of theory. Dashed-lines: B3LYP-cc-pVTZ (Gaussian09). Solid line: PBE ultrasoft pseudo-potentials (Quantum Espresso – cut-off energy: 60 Ry). van der Waals dispersion forces are included by means of Grimme D2 method. Details on the steps are reported in Scheme 1. | ||
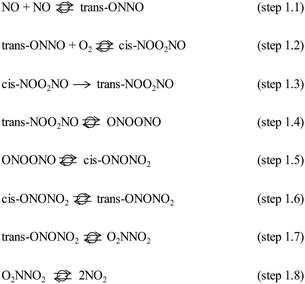
The MEP includes the intermediates and TS for the elementary steps in Scheme 1 and their corresponding energies. The corresponding structures for each step of Scheme 1 are reported in Table S1 of the ESI.† These results show that the formation of the trans-NOO2NO intermediates from one O2 and two NO molecules is, in fact, not barrierless at the DFT level. In contrast with previous findings,21 this step proceeds via the formation of a cis-NOO2NO intermediate that is unable to rearrange to form NO2 products without an intervening isomerization step. The cis-isomer forms via the dimerization of NO to form a N2O2 complex (ONNO), as the first stable intermediate in a barrierless elementary step (step 1.1). These ONNO complexes exist both in their trans (+39 kJ mol−1) and cis (+38 kJ mol−1) configurations.
The singlet configuration of ONNO complex is higher in energy by 28 kJ mol−1 and 16 kJ mol−1 for trans and cis isomers, respectively. The alternate formation of a ONOO peroxo-radical by NO–O2 reactions was also examined, but no stable ONOO structures could be isolated at the DFT level, as also reported in an earlier study.22 The trans-ONNO intermediates subsequently react with a gaseous O2 molecule (in its more stable triplet state) to form the cis-NOO2NO intermediate (step 1.2), which, in contrast with the trans-ONNO isomer and the O2 molecule, exists in its singlet state. Each reactant in step 1.2 contains two unpaired electrons (thus leading to five-fold spin multiplicity) and the product molecule formed is in the singlet state. As a result, a spin change must occur along the reaction coordinate and this transition can interfere with the accurate isolation of the transition state structure along the reaction path.50–52 These different spin multiplicities lead to crossings of the potential energy surfaces for the different spin states between reactant and product states and to possible spin–spin coupling effects that can lead to an unexpected stabilization of specific TS structures that occur at the spin crossing point.53 These possible crossing points are examined here at the DFT-level by using the MEP for step 1.2 in Scheme 1 for species in singlet and quintuplet multiplicities (Fig. 2). The open squares in Fig. 2 show the MEP derived from singlet NEB calculations for this step. The filled squares correspond to the analogous calculations for the quintuplet NEB calculations.
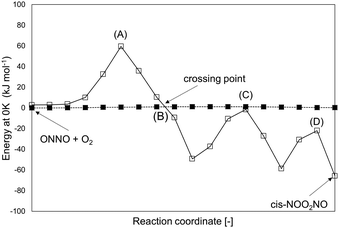 | ||
| Fig. 2 MEP (total energy at 0 K) of step 1.2 (Scheme 1) at two different multiplicities: 5 (filled squares) and 1 (open squares). Values are at the level of PBE (Quantum Espresso – ultrasoft pseudopotentials – cut-off energy: 60 Ry) and are reported relative to (ONNO + O2) at quintuplet multiplicity. Points (A), (B), (C) and (D) are possible TS structures along the two MEPs. | ||
The singlet MEP is characterized by three possible saddle points (A, C and D in Fig. 2). The quintuplet MEP is very flat along the reaction coordinate, with only one saddle point (point B in Fig. 2), corresponding to the crossing point of the two MEP. At this crossing, the O2 molecule forms a bond with each of the two N-atoms of the ONNO complex. All energies in the MEP are lower in the higher spin state than in the singlet state before the crossing point (point B in Fig. 2). After this crossing, the singlet spin state energy remains lower than for the higher spin state. Four different TS candidates were examined along the reaction coordinate. Point A is not a TS along the path, because it is located on the singlet state MEP, which is higher in energy than the quintuplet MEP at this point along the reaction coordinate. After the crossing point, there are two possible saddle points (C and D) along the MEP; both are lower in energy than the crossing point. Therefore, the fourth plausible TS structure, at the crossing between the quintuplet and singlet states, is, in fact, the TS. The structure at the crossing point was used as the starting structure for the TS search and refined using the Berny algorithm49 in Gaussian0948 considering singlet and quintuplet multiplicities. This refinement converged to a transition state structure with quintuplet multiplicity for step 1.2. After the cis-NOO2NO intermediate forms (step 1.2) and isomerizes to the trans-NOO2NO isomer (step 1.3), the reaction path proceeds along the singlet MEP to form the ONOONO intermediate (step 1.4) and then, through sequential rotational interconversions, the cis-ONONO2 (step 1.5) and trans-ONONO2 (step 1.6) isomers; the latter decomposes to form the two NO2 product molecules (steps 1.7 and 1.8). The energies (Fig. 1) and entropies (Fig. 3) along the reaction coordinate combine to give the free energy path shown in Fig. 1b (298 K, 1 bar), which accounts for the rates of each elementary step. These free energies (Fig. 1b) show that step 1.3 – the elementary step with the largest entropy loss (Fig. 3) and with the highest energy TS along the reaction coordinate (Fig. 1) – exhibits the highest Gibbs free energy among the elementary steps in Scheme 1. Thus, we conclude that this step is the sole kinetically-relevant step, leading to NO oxidation rates given by:
 | (4) |
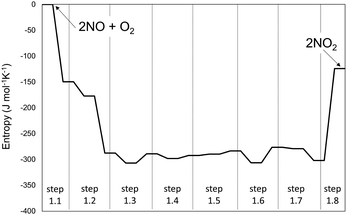 | ||
| Fig. 3 Entropy variations along the homogenous 2NO + O2 → 2NO2 reaction path at 1 bar and 298 K. The system is assumed to be thermodynamically ideal. | ||
The respective second-order and first-order kinetic dependences on NO and O2 in eqn (4) agree with measurements.7 The apparent activation enthalpies and entropies are then given by:
 | (5) |
 | (6) |
| ΔEapp [kJ mol−1] | ΔEapp [kJ mol−1] + GD2 | |
|---|---|---|
| PBE uspp | −87.5 | −80.8 |
| B3LYP 6-31-G | +12.4 | +5.3 |
| B3LYP 6-311-G-2d | +8.0 | +1.3 |
| B3LYP cc-pVTZ | +9.9 | +3.2 |
| MP2 cc-pVTZ | −5.6 | −5.6 |
Table 1 shows that dispersion effects on the activation barriers are very similar for all levels of theory (∼7 kJ mol−1). This reflects TS geometries, which are the predominant descriptors of van der Waals contacts and of their contributions to activation barriers, depend weakly on the level of theory. In fact, Fig. 4 shows that bond distances and angles in the kinetically-relevant TS differ by less than 4% among theoretical methods with respect to the values at the MP2 level, in spite of their different quantum mechanical energies (Table 1).
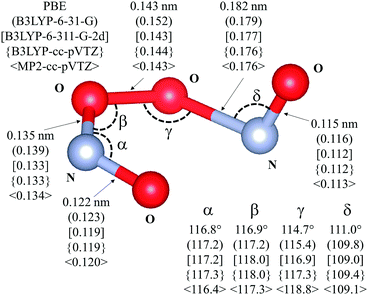 | ||
| Fig. 4 Transition state for the isomerization of cis-NOO2NO to trans-NOO2NO (step 1.3 of Scheme 1). Drawing produced using VESTA. Angles and distances reported are given for different levels of theory: PBE – ultrasoft pseudopotentials; PBE-ultrasoft pseudopotentials; (B3LYP-6-31-G); [B3LYP-6-311-G-2d]; {B3LYP-cc-pVTZ}; 〈MP2-cc-pVTZ〉. van der Waals dispersion contribution is included in DFT by means of Grimme-D2 method. | ||
In contrast with the previous work,20,21 in which enthalpies and energies were used to determine the identity and kinetic relevance of homogeneous elementary steps, free energy values reported here allow estimates of rates for direct benchmarking with measurements (Fig. 5). Differences of about 40 J mol−1 K−1 between experimental and predicted activation entropies and of the order of ±10 kJ mol−1 between experimental and predicted activation enthalpies result in rates that are 102 (MP2-cc-p-VTZ) to 105 (B3LYP-cc-p-VTZ) lower than measured values. Similar differences in rates are expected even for higher levels of theory, such as the CCSD(T) calculations of Gadzhiev and co-workers,20 which predict differences between experimental and theoretical activation energies that are between 10 kJ mol−1 (CCSD(T,full)/aug-cc-pCVTZ//CCSD(T,full)/cc-pCVTZ) and 15 kJ mol−1 (CCSD(T)/cc-pVDZ). Such differences are in line with the fact that current quantum mechanical treatments do not provide consistent and reliable energy estimates for N2O4 intermediates or transition state structures along the NO oxidation reaction coordinate.23 However, such inaccuracies brought forth by inaccurate treatments of these resonance effects influence the energies of all species involved but not their geometries,23 which are most relevant for the accurate evaluation of van der Waals contacts and energies in confined structures. In fact, the weak effects of the level of theory on the geometry of the transition states (Fig. 4) indicate that the inherent inaccuracy of the theoretical treatments (±10 kJ mol−1 in enthalpy of activation and ±40 J mol−1 K−1 in entropy of activation), evident from the comparisons in Fig. 5 and especially consequential for species that differ only slightly in energy, would become much less consequential in estimating rate enhancements upon confinement. Such effects, indeed, reflect free energy differences between the confined and homogeneous TS structures, for which geometry and its consequences for van der Waals contacts between the TS and the confining voids, instead of quantum mechanical effects, are most relevant. In fact, given the absence of specific binding sites, if confinement does not significant alter TS structures, then the inaccuracies in the theoretical methods would affect unconfined and confined rates to similar extents.
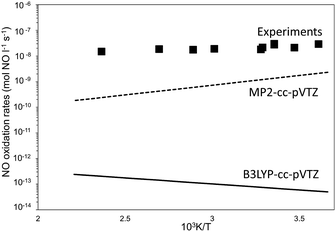 | ||
| Fig. 5 Forward NO oxidation rates (100 Pa NO, 5 kPa O2) as a function of temperature. Filled squares: experimental measurements.7 Full line: eqn (4) with rate parameters at B3LYP-cc-pVTZ and Grimme-D2 correction. Dashed-line: eqn (4) with rate parameters at MP2-cc-pVTZ. | ||
To this aim, next we examine the reaction coordinate of NO oxidation within voids of molecular dimensions in order to calculate the magnitude of the rate enhancements brought forth by their confinement within crystalline silicates that lack specific binding sites.
NO–O2 minimum free energy reaction paths within confined spaces
The intermediates and TS structures that mediate homogeneous gas-phase NO oxidation reactions were placed within silicate voids to determine the effects of confinement on NO–O2 reaction rates. Given the weak effect of the level of theory on the geometry of the TS (Fig. 4), NO oxidation pathways were first examined within CHA cages (0.74 nm diameter39) using CI-NEB methods at the DFT-PBE level with Grimme D2 dispersion corrections.43,44For each elementary step identified in the gas phase calculations, the reactant and product structures were relaxed within CHA voids using their homogeneous counterparts as the starting structures. Then, the converged structures were perturbed in both position and orientation within the cavity and re-optimized to ensure that the structures isolated upon optimization represent global energy minima throughout the entire void space. CI-NEB calculations were then carried out to determine the MEP and the TS that connect the relaxed reactant and product states along the reaction coordinate.
Fig. 6 shows the corresponding Gibbs free energies along the reaction coordinate for NO oxidation within CHA cages and in the extracrystalline homogeneous gas phase. The MEP for NO oxidation within the CHA voids evolves along the same sequence of elementary steps as in the homogeneous phase. The activation energies for each elementary step are given in Table 2 for CHA frameworks together with the respective values for the homogeneous reaction path. As in the case of the homogeneous routes, the free energies along the reaction coordinate show that the isomerization of the trans-NOO2NO isomer (step 1.3 of Scheme 1) represents the sole kinetically-relevant step (Fig. 6, dashed lines).
| E f,gas [kJ mol−1] | E f,CHA [kJ mol−1] | E b,gas [kJ mol−1] | E b,CHA [kJ mol−1] | |
|---|---|---|---|---|
| NO + NO → trans-ONNO (step 1.1) | 0.0 | 0.0 | 62.7 | 62.7 |
| trans-ONNO + O2 → cis-NOO2NO (step 1.2) | 1.0 | 1.0 | 70.4 | 73.3 |
| cis-NOO2NO → trans-NOO2NO (step 1.3) | 39.6 | 40.5 | 45.3 | 47.3 |
| trans-NOO2NO → ONOONO (step 1.4) | 9.6 | 8.7 | 93.6 | 97.5 |
| ONOONO → cis-ONONO2 (step 1.5) | 37.6 | 39.6 | 53.1 | 48.2 |
| cis-ONONO2 → trans-ONONO2 (step 1.6) | 34.7 | 29.9 | 24.1 | 21.2 |
| trans-ONONO2 → O2NNO2 (step 1.7) | 68.5 | 78.2 | 131.2 | 139.9 |
| O2NNO2 → 2NO2 (step 1.8) | 158.2 | 158.2 | 0.0 | 0.0 |
Fig. 7 shows that bond lengths and angles are also very similar in confined and unconfined spaces (differences lower than 2% with respect to the geometry in unconfined spaces), and, thus confinement did not lead to detectable changes in the geometry of this TS structure upon relaxation.
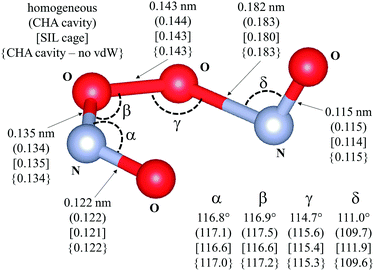 | ||
| Fig. 7 Transition state for the isomerization of cis-NOO2NO to trans-NOO2NO (step 1.3. Scheme 1). Drawing produced using VESTA. Angles and distances reported are given for different reaction environments: unconfined space; (CHA cavity); [SIL cage]; {CHA cavity and no Grimme D2}. Calculations have been performed at the PBE level. van der Waals dispersion contribution is included by means of Grimme-D2 method, unless otherwise. | ||
Such mechanistic similarities between homogeneous and confined routes lead to the same functional form of the rate equation, consistent with the similar NO and O2 pressure effects for all silicates and homogeneous reactions,7 but to different kinetic and thermodynamic parameters within and outside confining voids. NO oxidation rates for reactions occurring within CHA voids are given by:
 | (7) |
 | (8) |
 | (9) |
 | (10) |
 | (11) |
 | (12) |
The confinement of the kinetically-relevant TS (step 1.3 of Scheme 1) within CHA voids led to an enthalpic stabilization of 36.3 kJ mol−1 at 298 K, in excellent agreement with the enthalpy component of the measured rate enhancements on CHA (37 ± 1.6 kJ mol−1).7 The estimated entropic loss upon confinement is 44.9 J mol−1 K−1, also in agreement with measured values (46.9 ± 4.7 J mol−1 K−1);7 such entropic losses are compensated by the enthalpic stabilization to favor the confined TS by a free energy stabilization of 13.4 kJ mol−1 at 298 K. Such entropic losses predominantly reflect the loss of translational entropy upon confinement within voids of molecular dimensions (43.7 J mol−1 K−1) because of the reduced distance over which the molecule can translate defined by the void size. Fig. 8 shows the rate ratios (η, eqn (10)) measured and derived from the DFT treatments used in this study. The magnitude of the rate enhancements increases with decreasing temperature (in the experiments from 102 at 423 K to 2 × 10⁴ at 288 K), because the exothermic nature of confinement favors TS adsorption within CHA cages at lower temperatures. The enthalpic stabilization of the TS (ΔHconf, eqn (11)) dominates over the concomitant losses in entropy (ΔSconf, eqn (12)) at such low temperatures, thus decreasing the activation free energy for NO oxidation reactions by the mere act of confinement and without requiring any specific binding of any species present along the reaction coordinate. These rate enhancements reflect non-specific interactions mediated by induced dipoles created as the electron clouds in molecules and void walls perturb each other as they reach interacting distances.
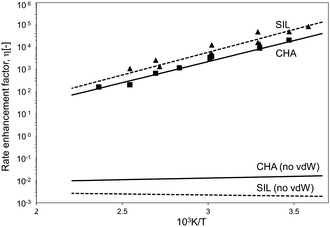 | ||
| Fig. 8 Ratio between forward NO oxidation rates in confined and unconfined spaces as a function of temperature. Filled triangles: experimental measurements on SIL.7 Filled squares: experimental measurements on CHA.7 Dashed line: theoretical calculations on SIL. Full line: theoretical calculations on CHA. Calculations are at the level of PBE (Quantum Espresso – ultrasoft pseudopotentials – cut-off energy: 60 Ry) with Grimme D2 for dispersion forces, unless otherwise. | ||
The preeminence of such dispersive interactions becomes evident from NO oxidation MEP surfaces within CHA cages calculated without dispersion corrections, specifically by excluding the Grimme D2 corrections at each energy calculation (DFT-PBE, Quantum Espresso). Structural minimizations of reactants and products and CI-NEB TS searches were performed (as described in Methods section) in order to ensure that all structures and energies represent true minima or saddle points along the reaction coordinate. Neglecting dispersive interactions leads to a small enthalpic gain upon confinement (ΔHconf, eqn (11); 2.9 kJ mol−1), which is much smaller than that calculated when dispersive forces are included (36.3 kJ mol−1, Table 3), but the structure of the TS is essentially the same with or without the inclusion of dispersive forces. Fig. 7 shows that bond lengths and angles in the TS are very similar with and without the Grimme D2 correction to the DFT energy (differences lower than 1% with respect to the case with Grimme D2 correction). Dispersion-corrected confinement entropies (44.9 J mol−1 K−1) are only slightly different than those obtained without dispersion contributions (44.3 J mol−1 K−1), because translational modes predominantly account for entropy losses upon confinement (eqn (1)). DFT-derived rate enhancements become smaller than unity at all temperatures when van der Waals forces are ignored (Fig. 8) because the entropic losses upon confinement (44.3 J mol−1 K−1) dominate over the small enthalpic stabilization for confined structures treated without including van der Waals stabilization (2.9 kJ mol−1). Such evidence attests to the preeminent effects of van der Waals forces in mediating such confinement effects.
The excellent agreement between measured and DFT-PBE derived rate enhancements (Fig. 8) stands in sharp contrast with larger differences between theory and experiments in activation free energies for homogeneous NO oxidation routes, for which PBE was found to dramatically fail in predicting the activation energy of the NO oxidation rate (Table 1). The inaccuracies in entropies and enthalpies in these theoretical methods appear to affect unconfined and confined rates to similar extents, thus making rate enhancements depend solely on the compensating enthalpic and entropic effects brought forth by van der Waals contacts upon confinement. In particular, confinement does not affect the quantum mechanical description of the NO oxidation path and depends on it only weakly through the DFT-derived geometry of the kinetically relevant TS (Fig. 4), which influences the magnitude of the van der Waals stabilization brought forth by confinement.
The agreement between free energies derived from Grimme-D2 treatments and from rate data (Fig. 8) for NO–O2 reactions indicate that Grimme-D2 methods accurately capture the enthalpic effects of confinement and that the void volume (eqn (2)) is the relevant characteristic distance for translation in statistical mechanics entropy estimates. D2 and D360 versions of the Grimme methods for cis-NOO2NO intermediates (Scheme 1) in CHA (ESI† – Section S5) give energies that differ by 7 kJ mol−1 with D3 giving the lower energies without any detectable differences in the optimized geometry. Thus, both methods lead to the same conclusions and to similar mechanistic interpretations of the NO–O2 rate enhancements by confinement.
The effects of void dimensions on rate enhancements were also examined using DFT estimates of TS stabilization within SIL frameworks (0.64 nm diameter of largest inscribed sphere vs. 0.74 nm in CHA).39 Enthalpic stabilization using PBE and Grimme D2 (Quantum Espresso) and entropy losses upon confinement are reported in Table 3 along with measured values. The confinement of the relaxed analog of the homogeneous TS structure within SIL leads to enthalpic stabilization of 39.2 kJ mol−1, in agreement with measured values7 (33.6 ± 12.4 J mol−1 K−1, Table 3), and to a concomitant entropy loss of 45.3 J mol−1 K−1 (298 K, 1 bar), also in line with measurements7 (28.1 ± 37.4 J mol−1 K−1, Table 3). As in CHA, van der Waals interactions predominantly account for the resulting decrease in free energy. Without dispersion corrections, the enthalpic stabilization is negligible (1.8 kJ mol−1).
These enthalpic and entropic effects of confinement are slightly stronger on SIL than CHA voids, but their respective relaxed TS structures are essentially identical as shown in Fig. 7, where bond lengths and angles are shown for relaxed homogeneous TS structures and for those confined within CHA and SIL voids. The stronger enthalpic TS stabilization within SIL (39.2 kJ mol−1) compared with CHA (36.3 kJ mol−1) reflects the slightly smaller dimensions of the SIL largest voids compared with the CHA cages (0.64 nm vs. 0.74 nm) and the more effective van der Waals contacts as the confining voids approach the size of the TS structures (0.4 nm). These smaller spaces also decrease translational freedom leading to a very slightly larger entropy loss upon confinement in SIL than in CHA (45.3 J mol−1 K−1vs. 44.9 J mol−1 K−1). The stronger enthalpic TS stabilization within SIL compensates for its lower entropy at near ambient temperatures, leading to smaller activation free energy on SIL than on CHA. As a result, kinetic enhancements over homogeneous routes are slightly larger on SIL than CHA (5 × 10⁴vs. 2 × 10⁴; 288 K; Fig. 8), in excellent agreement with the experimental measurements as shown in Fig. 8.
These findings provide compelling theoretical evidence and mechanistic insights into the remarkable enhancement for homogeneous reactions brought forth by “physical” confinement of their TS analogs within pure silicate voids of dimensions similar to those of the relevant TS structures. Such confinement effects confer enthalpic stability, at an entropic penalty that becomes essentially inconsequential at near ambient temperatures, through non-directional van der Waals contacts but without the formation of chemical bonds between the TS structures and the confining framework. Such ‘catalysis by confinement’ is expected to play a significant role in many other homogeneous reactions that occur at low temperatures, such as acetylene trimerization and Diels–Alder-type reactions. For instance, our results provide a mechanistic interpretation of the observed enhanced rates for the Diels–Alder reaction of buta-1,3-diene to 4-vinyl-cyclohexene only by physical confinement in the cages of non-acidic zeolites.36 In fact, as for the case of NO oxidation, the observed rate reflects the difference between the free energy of the kinetically relevant TS and that of reactants present in the contacting extracrystalline gas phase. Thus, measured rate enhancements occur because of the solvation of the kinetically relevant TS, through dispersion forces brought forth by confinement. These quantitative descriptions of catalysis by confinement at the molecular scale require computational methods that account for dispersion forces to accurately describe adsorption, reaction coordinates, and transition states for molecular transformations within confined spaces. The remarkable effects of confinement without binding7,36 provide significant incentives for the continuous improvement of the theoretical methods required to accurately account for van der Waals forces.
Conclusions
The homogeneous NO oxidation pathway proceeds via the formation of different N2O4 isomers, with the isomerization of cis-NOO2NO to trans-NOO2NO as the rate-limiting step of the reaction network. Upon confinement, the reaction path evolves along the same sequence of elementary steps as in the homogeneous phase, and the free energies along the reaction coordinate show that the isomerization of the trans-NOO2NO isomer is the sole kinetically-relevant step, as in the case of the homogeneous routes. We found that confinement does not substantially affect the relevant energies of each individual elementary step because the reactants, products and transition states share the same molecularity and size and are thus stabilized by confinement to the same extent. Measured rates reflect, however, the energy of the relevant termolecular transition states relative to those of their unconfined gaseous reactants, making reactivity strongly dependent on the enthalpic stabilization of transition states provided by vdW dispersion forces upon confinement. This enthalpic stabilization more than compensates the loss of entropy upon confinements at low temperatures (<423 K), thus giving a lower free energy of activation than for the homogeneous reaction. This enthalpic stabilization vanishes when vdW interactions are excluded in the calculations. Thus, the confinement effects are clearly shown to reflect vdW forces, which have a preeminent role in the remarkable NO oxidation rate enhancements experimentally observed in CHA and SIL.Excellent agreement between measured and DFT-PBE derived rate enhancements is evident in this study in spite of the fact that PBE was found to strongly underestimate the activation energy of the NO oxidation rate. This is a result of rate enhancements that depend solely on the compensating enthalpic and entropic effects brought forth by van der Waals contacts upon confinement. As such, the vdW method and the geometry of the TS, which influences the magnitude of the van der Waals stabilization brought forth by confinement and that was found to depend very weakly on the specific quantum mechanical treatment, are the main relevant contributors for the quantification of the rate enhancements upon confinement.
Conflicts of interest
There are no conflicts to declare.Acknowledgements
Computational time at CINECA, Bologna (Italy) is gratefully acknowledged. The authors acknowledge financial support from the European Research Council under the European Union's Horizon 2020 research and innovation programme (Project SHAPE – Grant No. 677423), from U.S. Department of Energy, Office of Science, Office of Basic Energy Sciences, under contract number DE-AC05-76RL0-1830, and from the Theodore Vermeulen Chair endowment funds.References
- T. Maesen, in Introduction to Zeolite Science and Practice, ed. J. Čejka, H. van Bekkum, A. Corma and F. Schüth, Elsevier, 2007, vol. 168, pp. 1–12 Search PubMed.
- J. Weitkamp and M. Hunger, in Introduction to Zeolite Science and Practice, ed. J. Čejka, H. van Bekkum, A. Corma and F. Schüth, Elsevier, 2007, vol. 168, pp. 787–835 Search PubMed.
- A. Ghorbanpour, J. D. Rimer and L. C. Grabow, Catal. Commun., 2014, 52, 98–102 CrossRef.
- R. Gounder and E. Iglesia, Acc. Chem. Res., 2012, 45, 229–238 CrossRef PubMed.
- R. Gounder and E. Iglesia, Chem. Commun., 2013, 49, 3491 RSC.
- R. Gounder and E. Iglesia, J. Am. Chem. Soc., 2009, 131, 1958–1971 CrossRef PubMed.
- N. Artioli, R. F. Lobo and E. Iglesia, J. Phys. Chem. C, 2013, 117, 20666–20674 Search PubMed.
- P. Nachtigal and J. Sauer, Application of quantum chemical methods in zeolite science, in Introduction to zeolite science and practice, ed. J. Cejka, H. van Bekkum, A. Corma and F. Schüth, Elsevier, Amsterdam, 3rd edn, 2007, ch. 20, pp. 701–736 Search PubMed.
- A. R. Puigdollers, P. Schlexer and G. Pacchioni, J. Phys. Chem. C, 2015, 119, 15381–15389 Search PubMed.
- J. Klimeš and A. Michaelides, J. Chem. Phys., 2012, 37, 1209, DOI:10.1063/1.4754130.
- N. Hansen, T. Kerber, J. Sauer, A. T. Bell and F. J. Keil, J. Am. Chem. Soc., 2010, 132, 11525–11538 CrossRef PubMed.
- M. Vandichel, D. Lesthaeghe, J. Van der Mynsbrugge, M. Waroquier and V. Van Speybroeck, J. Catal., 2010, 271, 67–78 CrossRef.
- M. Boronat, C. Martínez and A. Corma, Phys. Chem. Chem. Phys., 2011, 13, 2603 RSC.
- V. Van Speybroeck, K. De Wispelaere, J. Van der Mynsbrugge, M. Vandichel, K. Hemelsoet and M. Waroquier, Chem. Soc. Rev., 2014, 43, 7326–7357 RSC.
- J. P. P. Ramalho, J. R. B. Gomes and F. Illas, RSC Adv., 2013, 3, 13085 RSC.
- H. Prats, P. Gamallo, R. Sayós and F. Illas, Phys. Chem. Chem. Phys., 2016, 18, 2792–2801 RSC.
- J. Hafner, L. Benco and T. Bucko, Top. Catal., 2006, 37, 41–54 CrossRef.
- G. M. Mullen and M. J. Janik, ACS Catal., 2011, 1, 105–115 CrossRef.
- F. Goltl, A. Gruneis, T. Bucko and J. Hafner, J. Chem. Phys., 2012, 137, 114111 CrossRef PubMed.
- O. B. Gadzhiev, S. K. Ignatov, S. Gangopadhyay, A. E. Masunov and A. I. Petrov, J. Chem. Theory Comput., 2011, 7, 2021–2024 CrossRef PubMed.
- O. B. Gadzhiev, S. K. Ignatov, A. G. Razuvaev and A. E. Masunov, J. Phys. Chem. A, 2009, 113, 9092–9101 CrossRef PubMed.
- M. L. McKee, J. Am. Chem. Soc., 1995, 117, 1629–1637 CrossRef.
- W. G. Liu and W. A. Goddard, J. Am. Chem. Soc., 2012, 134, 12970–12978 CrossRef PubMed.
- G. F. Luo and X. B. Chen, J. Phys. Chem. Lett., 2012, 3, 1147–1153 CrossRef PubMed.
- M. Colombo, I. Nova, E. Tronconi, V. Schmeisser and M. Weibel, Catal. Today, 2014, 231, 99–104 CrossRef.
- Y. Zheng, M. P. Harold and D. Luss, Catal. Today, 2016, 264, 44–54 CrossRef.
- S. Shwan, J. Jansson, J. Korsgren, L. Olsson and M. Skoglundh, Catal. Today, 2012, 197, 24–37 CrossRef.
- P. S. Metkar, V. Balakotaiah and M. P. Harold, Catal. Today, 2012, 184, 115–128 CrossRef.
- T. C. Bruggemann and F. J. Keil, J. Phys. Chem. C, 2011, 115, 2114–2133 Search PubMed.
- T. C. Bruggemann and F. J. Keil, J. Phys. Chem. C, 2011, 115, 23854–23870 Search PubMed.
- K. W. W. M. Thiemann and E. Scheibler, Ullmann's Encyclopedia of Industrial Chemistry, 2000, pp. 177–226 Search PubMed.
- Z. Zhang, J. D. Atkinson, B. Jiang, M. J. Rood and Z. Yan, Appl. Catal., B, 2014, 148–149, 573–581 CrossRef.
- Z. Guo, M. Wang, Z. H. Huang and F. Kang, Carbon, 2015, 87, 282–291 CrossRef.
- Y. Shen, X. Ge and M. Chen, RSC Adv., 2016, 6, 8469–8482 RSC.
- E. G. Derouane, J. Mol. Catal. A: Chem., 1998, 134, 29–45 CrossRef.
- R. M. Dessau, J. Chem. Soc., Chem. Commun., 1986, 1167–1168 RSC.
- J. P. Perdew, K. Burke and M. Ernzerhof, Phys. Rev. Lett., 1996, 77, 3865–3868 CrossRef PubMed.
- P. Giannozzi, S. Baroni, N. Bonini, M. Calandra, R. Car, C. Cavazzoni, D. Ceresoli, G. L. Chiarotti, M. Cococcioni, I. Dabo, A. Dal Corso, S. de Gironcoli, S. Fabris, G. Fratesi, R. Gebauer, U. Gerstmann, C. Gougoussis, A. Kokalj, M. Lazzeri, L. Martin-Samos, N. Marzari, F. Mauri, R. Mazzarello, S. Paolini, A. Pasquarello, L. Paulatto, C. Sbraccia, S. Scandolo, G. Sclauzero, A. P. Seitsonen, A. Smogunov, P. Umari and R. M. Wentzcovitch, J. Phys.: Condens. Matter, 2009, 21, 395502 CrossRef PubMed.
- E. L. First, C. E. Gounaris, J. Wei and C. A. Floudas, Phys. Chem. Chem. Phys., 2011, 13, 17339–17358 RSC.
- R. M. Martin, Electronic-Structure: Basic Theory and Practical Methods, Cambridge University Press, Cambridge, 2004 Search PubMed.
- C. Tuma and J. Sauer, Chem. Phys. Lett., 2004, 387, 388–394 CrossRef.
- C. Tuma and J. Sauer, Phys. Chem. Chem. Phys., 2006, 8, 3955–3965 RSC.
- S. Grimme, J. Comput. Chem., 2004, 25, 1463–1473 CrossRef PubMed.
- S. Grimme, J. Comput. Chem., 2006, 27, 1787–1799 CrossRef PubMed.
- G. Henkelman and H. Jonsson, J. Chem. Phys., 2000, 113, 9978–9985 CrossRef.
- G. Henkelman, B. P. Uberuaga and H. Jonsson, J. Chem. Phys., 2000, 113, 9901–9904 CrossRef.
- S. R. Bahn and K. W. Jacobsen, Comput. Sci. Eng., 2002, 4, 56–66 CrossRef.
- M. J. Frisch, G. W. Trucks, H. B. Schlegel, G. E. Scuseria, M. A. Robb, J. R. Cheeseman, G. Scalmani, V. Barone, B. Mennucci, G. A. Petersson, H. Nakatsuji, M. Caricato, X. Li, H. P. Hratchian, A. F. Izmaylov, J. Bloino, G. Zheng, J. L. Sonnenberg, M. Hada, M. Ehara, K. Toyota, R. Fukuda, J. Hasegawa, M. Ishida, T. Nakajima, Y. Honda, O. Kitao, H. Nakai, T. Vreven, J. A. Montgomery Jr., J. E. Peralta, F. Ogliaro, M. J. Bearpark, J. Heyd, E. N. Brothers, K. N. Kudin, V. N. Staroverov, R. Kobayashi, J. Normand, K. Raghavachari, A. P. Rendell, J. C. Burant, S. S. Iyengar, J. Tomasi, M. Cossi, N. Rega, N. J. Millam, M. Klene, J. E. Knox, J. B. Cross, V. Bakken, C. Adamo, J. Jaramillo, R. Gomperts, R. E. Stratmann, O. Yazyev, A. J. Austin, R. Cammi, C. Pomelli, J. W. Ochterski, R. L. Martin, K. Morokuma, V. G. Zakrzewski, G. A. Voth, P. Salvador, J. J. Dannenberg, S. Dapprich, A. D. Daniels, Ö. Farkas, J. B. Foresman, J. V. Ortiz, J. Cioslowski and D. J. Fox, Gaussian 09, Gaussian, Inc., Wallingford, CT, 2009 Search PubMed.
- X. S. Li and M. J. Frisch, J. Chem. Theory Comput., 2006, 2, 835–839 CrossRef PubMed.
- J. Döbler, M. Pritzsche and J. Sauer, J. Am. Chem. Soc., 2005, 127, 10861–10868 CrossRef PubMed.
- A. Goodrow and A. T. Bell, J. Phys. Chem. C, 2007, 111, 14753–14761 Search PubMed.
- A. Getsoian, V. Shapovalov and A. T. Bell, J. Phys. Chem. C, 2013, 117, 7123–7137 Search PubMed.
- P. Deshlahra and E. Iglesia, J. Phys. Chem. C, 2016, 120, 16741–16760 Search PubMed.
- B. A. De Moor, A. Ghysels, M. F. Reyniers, V. Van Speybroeck, M. Waroquier and G. B. Marin, J. Chem. Theory Comput., 2011, 7, 1090–1101 CrossRef PubMed.
- B. A. De Moor, M. F. Reyniers and G. B. Marin, Phys. Chem. Chem. Phys., 2009, 11, 2939–2958 RSC.
- B. A. De Moor, M. F. Reyniers, M. Sierka, J. Sauer and G. B. Marin, J. Phys. Chem. C, 2008, 112, 11796–11812 Search PubMed.
- M. M. J. Treacy and J. B. Higgins, Collection of Simulated XRD Powder Patterns for Zeolites, Elsevier, 2001 Search PubMed.
- R. Atkinson, D. L. Baulch, R. A. Cox, J. N. Crowley, R. F. Hampson, R. G. Hynes, M. E. Jenkin, M. J. Rossi and J. Troe, Atmos. Chem. Phys., 2004, 4, 1461–1738 CrossRef.
- L. P. Olson, K. T. Kuwata, M. D. Bartberger and K. N. Houk, J. Am. Chem. Soc., 2002, 124, 9469–9475 CrossRef PubMed.
- S. Grimme, J. Antony, S. Ehrlich and H. Krieg, J. Chem. Phys., 2010, 132, 154104 CrossRef PubMed.
Footnote |
| † Electronic supplementary information (ESI) available: Calculations of enthalpies and entropies using statistical mechanics treatments, calculation of the NO reaction rates, structures of each step of Scheme 1 in gas-phase, absolute energies and coordinates of the atoms for gas-phase intermediate and transition state structures of Scheme 1, images and coordinates of the atoms for the structures of the kinetically relevant transition state (step 1.3 of Scheme 1) in CHA and in SIL, coordinates of the atoms and energy of the optimized cis-NOO2NO intermediate (Scheme 1) using Grimme-D2 and Grimme-D3 methods. See DOI: 10.1039/c8cp01615a |
| This journal is © the Owner Societies 2018 |

