 Open Access Article
Creative Commons Attribution 3.0 Unported Licence
A bis-boronic acid modified electrode for the sensitive and selective determination of glucose concentrations†‡
Hui-Chen Wangac, Hao Zhoub, Baoqin Chenb, Paula M. Mendesd, John S. Fossey*c, Tony D. James*a and Yi-Tao Long*ab
aSchool of Chemistry, University of Bath, Bath, BA2 7AY, UK. E-mail: t.d.james@bath.ac.uk
bShanghai Key Laboratory of Functional Materials Chemistry & Department of Chemistry, East China University of Science and Technology, Shanghai 200237, China. E-mail: ytlong@ecust.edu.cnu
cSchool of Chemistry, University of Birmingham, Edgbaston, Birmingham, B15 2TT, UK. E-mail: j.s.fossey@bham.ac.uk
dSchool of Chemical Engineering, University of Birmingham, Edgbaston, Birmingham B15 2TT, UK
First published on 22nd October 2013
Abstract
A bis-boronic acid modified electrode for the sensitive and selective determination of glucose concentrations has been developed. The electrochemical characteristics of the sensor with added saccharides were investigated using cyclic voltammetry (CV) and electrochemical impedance spectroscopy (EIS). The bis-boronic acid modified electrode was both sensitive and selective for glucose.
Introduction
Saccharides such as D-glucose and D-fructose are important dietary sources of energy from natural carbohydrate sources and are used as processed food additives (high fructose corn syrup). From a clinical perspective measuring the concentration of D-glucose in blood is particularly important given the need of diabetic patients to regularly monitor its concentration,1 making fast and accurate determination of saccharides (particularly glucose) important. Many methods exist to measure the concentration of D-glucose including electrochemical and optical approaches.2 The most widely adopted sensors for D-glucose in food analysis, environmental monitoring, medical diagnosis, and many other fields are electrochemical in nature.3 Such saccharide sensors rely on the use of an enzyme such as glucose oxidase (GOx) or glucose dehydrogenase to generate redox mediator species, which are thereafter detected electrochemically.4 These sensors require the coupling of the enzyme in close proximity to the electrode in order to obtain high sensitivity. However, due to the intrinsic properties of enzymes, the catalytic activity of GOx is susceptible to environmental factors such as temperature, humidity, pH, ionic detergents, and toxic chemicals.5 Furthermore, GOx sensors suffer from high cost and poor stability and require complicated immobilisation procedures.6 Therefore, simple enzyme-free glucose sensing is highly desirable. Much work has been carried out in order to develop enzyme-free glucose sensors.7Enzymeless sensing is an important area of sensor development; robust, long shelf-life systems are required for use in the field. One approach towards enzyme-free sensors involves the direct oxidation of glucose at nanostructured electrodes.8 Nanostructuring allows the detection of glucose at a lower overpotential.9 However, such electrodes are very sensitive to adsorbed interferents such as chloride and suffer from surface fouling when used over prolonged periods.10 An alternative enzymeless approach for glucose detection involves the use of fully synthetic receptors, such as boronic acids.11 A boronic acid receptor binds reversibly with cis-1,2- and cis-1,3-diols to form five- and six-membered cyclic boronic esters, respectively.12 Boronic acid based receptors have been used successfully as fluorescence sensors,13 surface appended sensors,14 and potentiometric/amperometric sensors.15
Among various analytical methods, electrochemical impedance spectroscopy (EIS) is an effective method to probe the interfacial properties of modified electrodes and is often used to probe chemical transformations and processes associated with conductive supports.16 EIS has been used in many fields, particularly corrosion, but only since 1980 has it become more widely applied, for ion-selective electrodes,17 electrochemical sensors and biosensors in general.18 EIS has been used to follow the chemical modification electrodes based on SAMs and to quantify species in solution.19 The recognition mechanism in these systems requires the blocking of electron transfer of a redox probe at the SAM/solution interface through complexation, and thus the species are recognised indirectly.20
With our present work, an electrochemical sensor for saccharides has been prepared by surface modification of a gold electrode with a bis-boronic acid receptor. The receptor was designed to contain a glucose selective chemosensor unit (bis-boronic acid) and surface anchoring unit (sulphur), the synthesis of which can be found in the ESI.† The selectivity of the sensors towards glucose, fructose, galactose and mannose was then evaluated using cyclic voltammetry (CV) and electrochemical impedance spectroscopy (EIS). As expected the sensor surface was particularly sensitive towards glucose. Our novel glucose selective bis-boronic acid designed for surface functionalisation has also been used in a partner paper that exploits surface plasmon resonance to detect the interactions between the bis-boronic acid functionalised surface and the different saccharides.21
Experimental
Materials
D-Glucose, D-fructose, D-galactose, and D-mannose were purchased from Aladdin (Shanghai, China). Phosphate buffer solutions (PBS, pH 8.0) were prepared with 0.2 M NaH2PO4, 0.2 M Na2HPO4, and 0.1 M KNO3. All other chemicals used were of analytical reagent grade and all solutions were prepared with deionised water obtained from a Milli-Q System (Millipore, USA).Preparation of clean gold electrodes
Gold disk electrodes were polished with a 0.05 μm alumina slurry, cleaned by soaking in piranha solution (H2SO4![[thin space (1/6-em)]](https://www.rsc.org/images/entities/char_2009.gif) :
:![[thin space (1/6-em)]](https://www.rsc.org/images/entities/char_2009.gif) H2O2 = 3
H2O2 = 3![[thin space (1/6-em)]](https://www.rsc.org/images/entities/char_2009.gif) :
:![[thin space (1/6-em)]](https://www.rsc.org/images/entities/char_2009.gif) 1) for 15 min, (Caution! Piranha solution should be handled with extreme care and should never be stored in a closed container. It is a very strong oxidant and reacts violently with most organic materials) and sonicated in water, twice. Then the electrode was electrochemically cycled from a potential of −1.0 to +1.25 V vs. Ag/AgCl in 0.5 M H2SO4 solution until a stable gold oxidation peak at 1.1 V vs. Ag/AgCl was observed.
1) for 15 min, (Caution! Piranha solution should be handled with extreme care and should never be stored in a closed container. It is a very strong oxidant and reacts violently with most organic materials) and sonicated in water, twice. Then the electrode was electrochemically cycled from a potential of −1.0 to +1.25 V vs. Ag/AgCl in 0.5 M H2SO4 solution until a stable gold oxidation peak at 1.1 V vs. Ag/AgCl was observed.Preparation of bis-boronic acid 1
Commercial bis(hexamethylene) triamine was reacted with (Boc)2O to obtain a mono-boctriamine derivative. After reductive amination of pyrene carboxyaldehyde by this amine, the product can be converted to a Boc protected precursor to 1 by further alkylation with pinnacol protected 2-(bromomethyl)-phenyl boronic acid. The precursor upon deprotection with trifluoroacetic acid and reaction with the NHS ester of lipoic acid furnished bis-boronic acid 1 in 26% overall yield (five steps, Scheme 1). Compound 1 was synthesised by a modular approach allowing the potential incorporation of diverse functionalities to be delivered by this or future sensors (functionality dormant in one application may come to the fore in another). The chemosensor compound 1 includes a sulphur functionality for surface attachment. In this case we incorporate the known glucose selective bis-boronic acid unit to demonstrate the modular approach.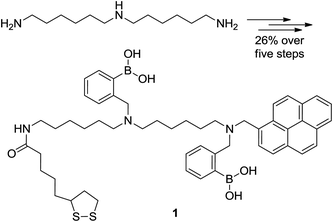 | ||
| Scheme 1 Structures of the starting material and product in the synthesis of bis-boronic acid 1 in five steps from N-1-(6-aminohexyl) hexane-1,6-diamine in 26% overall yield as detailed in the ESI.† | ||
Preparation of the boronic acid modified gold electrodes
Gold electrodes were incubated in a solution of bis-boronic acid 1 in methanol (10 mM) for 2 days. The electrodes were rinsed with methanol and water, as represented in Scheme 2.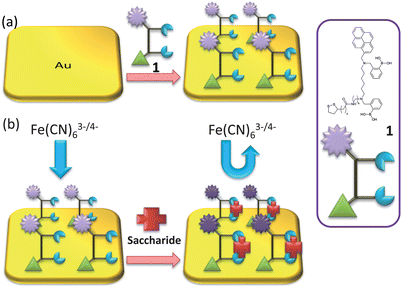 | ||
| Scheme 2 (a) Representation of gold surface functionalisation by receptor unit 1; and (b) saccharide binding. | ||
Cyclic voltammetric measurements were performed using a CHI660C electrochemical workstation (Shanghai Chenhua, China). All electrochemical experiments were performed with a conventional three-electrode system, using the modified gold electrode (as shown in Scheme 2) as the working electrode, a platinum wire as the auxiliary electrode, and a saturated calomel electrode (SCE) as the reference electrode. Electrochemical impedance experiments were performed with a Zahner electrochemical workstation (Zahner, Germany) in PBS (pH 8.0) containing 5 mM Fe(CN)63−/4− (1![[thin space (1/6-em)]](https://www.rsc.org/images/entities/char_2009.gif) :
:![[thin space (1/6-em)]](https://www.rsc.org/images/entities/char_2009.gif) 1) with 0.1 M KNO3. The impedance spectra were recorded within the frequency range of 10−1 to 105 Hz with an applied DC potential of 0.20 V and a sine wave potential of 10 mV. All potentials were reported with respect to the reference electrode. The ZSimpWin (Version 3.10) software was used to evaluate the experimental results of EIS.
1) with 0.1 M KNO3. The impedance spectra were recorded within the frequency range of 10−1 to 105 Hz with an applied DC potential of 0.20 V and a sine wave potential of 10 mV. All potentials were reported with respect to the reference electrode. The ZSimpWin (Version 3.10) software was used to evaluate the experimental results of EIS.
Results and discussion
Electrochemical characteristics of the modified electrode
CVs at the bare gold electrode and the modified electrode in PBS (pH = 8.0) containing 5 mM Fe(CN)63−/4− (1![[thin space (1/6-em)]](https://www.rsc.org/images/entities/char_2009.gif) :
:![[thin space (1/6-em)]](https://www.rsc.org/images/entities/char_2009.gif) 1) with 0.1 M KNO3 at the scan rate of 100 mV s−1 are shown in Fig. 1A. Two well defined redox peaks could be observed at the bare gold electrode (Fig. 1A-a) with peak potential separation (ΔEp, the potential difference between the oxidation peak potential and reduction peak potential, which is inversely proportional to the electron transfer rate22) of 94 mV. After the electrode was dipped in the bis-boronic acid solution for 2 days, the CV curve changes drastically in peak current and peak potential separation (Fig. 1A-b). The changes of the peak current and peak potential separation were attributed to the sluggish electron-transfer kinetics through the self-assembled monolayer. The CVs of the self-assembled electrode at different scan rates are shown in Fig. 1B. It can be seen from Fig. 1B that both anodic and cathodic peak currents increased linearly with the square root of the scan rate between 10 and 200 mV s−1 (the inset of Fig.1B) indicating a diffusion-controlled redox process.
1) with 0.1 M KNO3 at the scan rate of 100 mV s−1 are shown in Fig. 1A. Two well defined redox peaks could be observed at the bare gold electrode (Fig. 1A-a) with peak potential separation (ΔEp, the potential difference between the oxidation peak potential and reduction peak potential, which is inversely proportional to the electron transfer rate22) of 94 mV. After the electrode was dipped in the bis-boronic acid solution for 2 days, the CV curve changes drastically in peak current and peak potential separation (Fig. 1A-b). The changes of the peak current and peak potential separation were attributed to the sluggish electron-transfer kinetics through the self-assembled monolayer. The CVs of the self-assembled electrode at different scan rates are shown in Fig. 1B. It can be seen from Fig. 1B that both anodic and cathodic peak currents increased linearly with the square root of the scan rate between 10 and 200 mV s−1 (the inset of Fig.1B) indicating a diffusion-controlled redox process.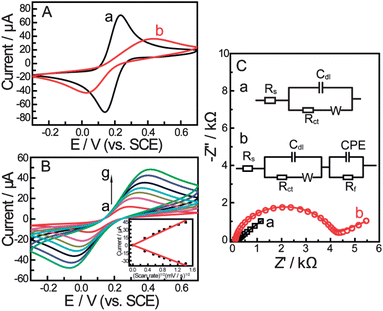 | ||
Fig. 1 (A) Cyclic voltammograms for different electrodes and (B) CVs of the gold electrode modified with a self-assembled monolayer of compound 1 in PBS (pH = 8.0) containing 5 mM Fe(CN)63−/4− (1![[thin space (1/6-em)]](https://www.rsc.org/images/entities/char_2009.gif) : :![[thin space (1/6-em)]](https://www.rsc.org/images/entities/char_2009.gif) 1) with 0.1 M KNO3 at the scan rate (from a to g): 10, 30, 50, 70, 100, 150, 200 mV s−1. The inset shows the linear relationship between the peak current and the square root of scan rate. (C) Nyquist plots and equivalent circuit models for different electrodes in 0.2 M PBS (pH = 8.0) containing 5 mM Fe(CN)63−/4− (1 1) with 0.1 M KNO3 at the scan rate (from a to g): 10, 30, 50, 70, 100, 150, 200 mV s−1. The inset shows the linear relationship between the peak current and the square root of scan rate. (C) Nyquist plots and equivalent circuit models for different electrodes in 0.2 M PBS (pH = 8.0) containing 5 mM Fe(CN)63−/4− (1![[thin space (1/6-em)]](https://www.rsc.org/images/entities/char_2009.gif) : :![[thin space (1/6-em)]](https://www.rsc.org/images/entities/char_2009.gif) 1) with 0.1 M KNO3. (a) Bare Au electrode, (b) boronic acid compound modified Au electrode. Scan rate: 100 mV s−1. 1) with 0.1 M KNO3. (a) Bare Au electrode, (b) boronic acid compound modified Au electrode. Scan rate: 100 mV s−1. | ||
The self-assembly process of the gold electrode was also monitored by EIS experiments. EIS is an effective method for probing the features of surface-modified electrodes.23 In EIS, the semicircle diameter in the impedance spectrum equals the electron-transfer resistance, Rct. This resistance controls the electron transfer kinetics of the redox probe ([Fe(CN)6]4−/3−) at the electrode interface. It can be seen that an almost straight line which is a characteristic of a diffusion limited electrochemical process was obtained with the bare gold electrode (Fig. 1C-a). While, the self-assembly of the bis-boronic acid on the electrode surface generated an insulating layer on the electrode that functioned as a barrier to the interfacial electron transfer. This is reflected by the appearance of the semicircular part of the spectrum (Fig. 1C-b). These data are consistent with the results obtained from CV experiments and demonstrate that the bis-boronic acid is immobilised on the gold electrode in a similar configuration to that depicted in Scheme 2.
The results obtained by EIS were verified using different electrical equivalent circuits shown in the inset of Fig. 1C. These circuits represented bare electrode (Fig. 1C-a, inset) and the modified electrode (Fig. 1C-b, inset) which were evaluated using ZSimpWin (Version 3.10) software. The EIS data were also simulated by the electrical equivalent circuit in Fig. 1C. We observed very good agreement between both experimental and calculated results from the best fitting electrical equivalent circuit model, where the chi-squared (χ2) value was minimized below 10−4. χ2 is the function defined as the sum of the squares of the residuals.
The detection of saccharides by cyclic voltammetry (CV)
The electrochemical behaviour of the biosensor was then investigated using cyclic voltammetry. As shown in Fig. 2, the peak current decreases with increasing saccharide concentrations and the peak-to-peak separation increases. We attribute this to the self-assembled layer on the gold electrode which acts as an inert electron transfer blocking layer. When the modified electrode is dipped into solutions of saccharides, the boronic acid binds with saccharides and further hinders the diffusion of the [Fe(CN)6]4−/3− toward the electrode surface. As shown in Scheme 2, when the bis-boronic acid interacts with saccharides, the effective surface area of the electrode is decreased, which limits the diffusion of the redox couple toward the electrode surface. This is rationalized from the curves in Fig. 2, in which the ip with 1 mM D-glucose is about 26.3 μA at pH 8.0 while that observed in the absence of D-glucose is about 35.9 μA. Therefore, it is clear that ip decreases with increasing saccharide concentration.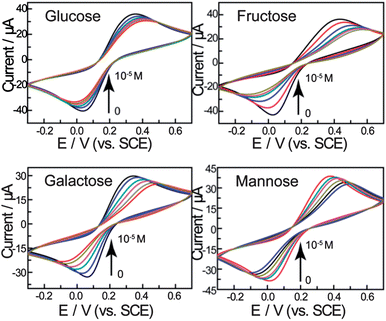 | ||
Fig. 2 CVs of the gold electrode modified with a self-assembled monolayer of compound 1 in 0.2 M PBS (pH = 8.0) containing 5 mM Fe(CN)63−/4− (1![[thin space (1/6-em)]](https://www.rsc.org/images/entities/char_2009.gif) : :![[thin space (1/6-em)]](https://www.rsc.org/images/entities/char_2009.gif) 1) with 0.1 M KNO3 after treatment in the different concentrations of saccharides (from outer to inner: 0, 10−6, 3 × 10⁻⁶, 5 × 10⁻⁶, 8 × 10⁻⁶, 10−5 M) at 100 mV s−1. 1) with 0.1 M KNO3 after treatment in the different concentrations of saccharides (from outer to inner: 0, 10−6, 3 × 10⁻⁶, 5 × 10⁻⁶, 8 × 10⁻⁶, 10−5 M) at 100 mV s−1. | ||
Fig. 3 shows the peak current as a function of saccharide concentration, illustrating that the current versus concentration of saccharides gives a linear relationship between 0 and 10 μM. The stability constants reported previously using standard methods are:24D-Glucose (1.3 ± 0.3 × 10⁵ M−1), D-galactose (1.5 ± 0.2 × 10⁵ M−1), D-fructose (1.3 ± 0.3 × 10⁴ M−1) and D-mannose (6.5 ± 0.6 × 10⁴ M−1). The binding constants calculated are significantly higher than solution binding in exact value. These observed stability constants on the surface are also comparable in trend with that in the solution phase. The concentration limitation of the mathematical model and the disordering of the monolayer by binding reaction are both proposed to be the reasons (for details see the ESI†).
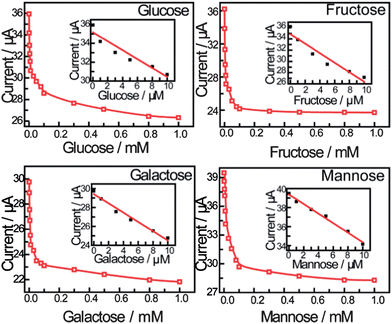 | ||
| Fig. 3 The calibration curve obtained using peak current as a function of saccharide concentration. The inset shows the linear relationship between the peak current and the concentration of saccharides applied in the calibration (from 0 to 10 μM). | ||
The detection of saccharides by electrochemical impedance spectroscopy
Electrochemical impedance spectroscopy is an effective method to investigate the interfacial properties of modified electrodes. The detailed information about the electric properties of the film on the modified electrodes could be acquired. Here, we demonstrate that impedance spectroscopy is a unique and sensitive technique in sensing the saccharides.Fig. 4 shows the complex impedance plots of the bis-boronic acid modified electrode and after immersion in different concentrations of saccharides. Significant changes in the impedance spectra were observed for different concentrations of saccharides, the diameter of the semicircle parts increases with increasing saccharide concentration compared with the modified electrode, which shows that the complexation of the boronic acid group with saccharides changes the film characteristics, such as ion transfer resistance and the dielectric capacitance.
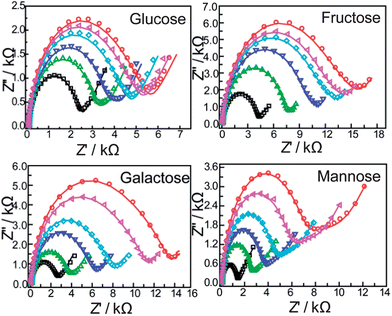 | ||
Fig. 4 EIS of the modified gold electrodes modified with a self-assembled monolayer of compound 1 with different concentrations of saccharides (from inner to outer: 0, 10−6, 3 × 10⁻⁶, 5 × 10⁻⁶, 8 × 10⁻⁶, 10−5 M): in PBS (pH = 8.0) containing 5 mM Fe(CN)63−/4− (1![[thin space (1/6-em)]](https://www.rsc.org/images/entities/char_2009.gif) : :![[thin space (1/6-em)]](https://www.rsc.org/images/entities/char_2009.gif) 1) with 0.1 M KNO3. The frequency range is between 100 mHz and 100 kHz at the half-wave potential of 0.2 V with 10 mV sine wave potential. 1) with 0.1 M KNO3. The frequency range is between 100 mHz and 100 kHz at the half-wave potential of 0.2 V with 10 mV sine wave potential. | ||
A modified Randle's circuit (shown in Fig. 1C-b, inset) was used to fit the measured data. In this circuit, Rs is the ohmic resistance due to an electrolyte and underlying electrode. Rct is the charge- and/or ion-transfer resistance occurring at the film/solution interface. The Warburg impedance represents semi-infinite linear diffusion within the solution. Since the interface between the electroactive film and the electrode is not a perfectly smooth plane but has some roughness and/or porosity, the ideal capacity is replaced by a frequency-dependent constant phase element (CPE), ZCPE = Y0(jω)−α and α = 1 − φ (φ is equal to one for the complete smooth electrode).
The circuit element of most interest in this work is the charge-transfer resistance (Rct) which represents the charge- and/or ion-transfer resistance, because it often relates directly to the accessibility of the modified electrode and reflects the flow of charge across the modified interface into the electrode. In this work, the Rct of the self-assembled monolayer film increases with an increase in the saccharide concentration as shown in Fig. 5, indicating that the concentration of saccharides could be detected by monitoring changes in Rct. Saccharides are nonconductive therefore, the pathway of electrons or ions are blocked when saccharides bind with the bis-boronic acid on the modified electrode, and the electron/ion transfer resistance (Rct) increases with increasing saccharide concentration.
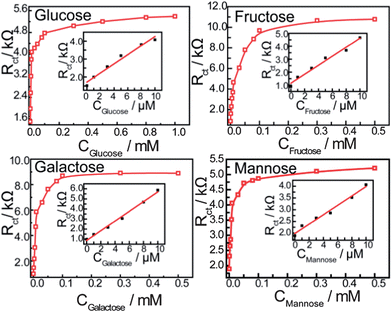 | ||
| Fig. 5 Calibration curves obtained using Rct as a function of saccharide concentration. The frequency range is between 100 mHz and 100 kHz at the half-wave potential of 0.20 V with 10 mV sine wave potential. The inset shows the linear relationship between the Rct and the concentration of saccharides (from 0 to 10 μM). | ||
Fig. 5 shows the saccharide response curves of a modified electrode in PBS (pH 8.0), the change in Rctvs. the concentration of saccharides gives a linear relationship between 0 and 10 μM. The stability constants obtained are: D-glucose (1.7 ± 0.3 × 10⁵ M−1), D-galactose (9.1 ± 1.2 × 10⁴ M−1), D-fructose (4.6 ± 0.5 × 10⁴ M−1) and D-mannose (1.2 ± 0.1 × 10² M−1).
The observed binding constants demonstrate that the relative saccharide selectivity of the solution fluorescent bis-boronic acid is maintained on a gold surface when probed electrochemically. Whilst the relative binding constants are in line with expectations the absolute values calculated are significantly higher than those one might expect for a boronic acid–saccharide interaction alone. We expect the overall observed binding to be a consequence of the boronic acid receptor and the electrochemical sensing regime used. Whilst remaining tentative, additional discussion is provided in the ESI† pertaining to the mathematical model and surface construction which might contribute to future discussion in this regard.
Conclusions
In this work, we have demonstrated that a surface modified gold electrode with a self-assembled monolayer of bis-boronic acid can detect four saccharides: D-glucose, D-fructose, D-galactose and D-mannose. Cyclic voltammograms and electrochemical impedance spectroscopy (EIS) were used to detect these four saccharides, and a very good linear response, high sensitivity and selectivity for glucose was achieved using this method.Acknowledgements
This research was supported by the National Science Fund for Distinguished Young Scholars (21125522), the National Natural Science Foundation of China (91027035), the Fundamental Research Funds for the Central Universities (WK1013002, WB1113005) and the Open Project Program of the State Key Laboratory of Chemical Engineering, (ECUST, SKL-ChE-11C01), ERDF AWMII, The University of Birmingham, The University of Bath and The Royal Society. Y.-T.L., J.S.F. and T.D.J thank the Catalysis and Sensing for our Environment (CASE) network. J.S.F. and T.D.J thank ECUST for guest professorship.References
- M. M. W. Muscatello, L. E. Stunja and S. A. Asher, Anal. Chem., 2009, 81, 4978–4986 CrossRef PubMed.
- (a) A. Heller and B. Feldman, Chem. Rev., 2008, 108, 2482–2505 CrossRef CAS PubMed; (b) M. S. Steiner, A. Duerkop and O. S. Wolfbeis, Chem. Soc. Rev., 2011, 40, 4805–4839 RSC.
- (a) J. D. Newman and A. P. F. Turner, Biosens. Bioelectron., 2005, 20, 2435–2453 CrossRef CAS PubMed; (b) S. R. Lee, Y. T. Lee, K. Sawada, H. Takao and M. Ishida, Biosens. Bioelectron., 2008, 24, 410–414 CrossRef CAS PubMed.
- (a) J. Wang, Chem. Rev., 2008, 108, 814–825 CrossRef CAS PubMed; (b) C. Y. Deng, J. H. Chen, X. L. Chen, C. H. Mao, L. H. Nie and S. Z. Yao, Biosens. Bioelectron., 2008, 23, 1272–1277 CrossRef CAS PubMed.
- R. Wilson and A. P. F. Turner, Biosens. Bioelectron., 1992, 7, 165–185 CrossRef CAS.
- M. H. Yang, Y. H. Yang, Y. L. Liu, G. L. Shen and R. Q. Yu, Biosens. Bioelectron., 2006, 21, 1125–1131 CrossRef CAS PubMed.
- (a) X. H. Kang, Z. B. Mai, X. Y. Zou, P. X. Cai and J. Y. Mo, Anal. Biochem., 2007, 363, 143–150 CrossRef CAS PubMed; (b) D. G. Wang, F. Guo, J. F. Chen, R. H. Zhao and Z. T. Zhang, Mater. Chem. Phys., 2008, 107, 426–430 CrossRef CAS; (c) J. Wang, D. F. Thomas and A. Chen, Anal. Chem., 2008, 80, 997–1004 CrossRef CAS PubMed; (d) C. Batchelor-McAuley, Y. Du, G. G. Wildgoose and R. G. Compton, Sens. Actuators, B, 2008, 135, 230–235 CrossRef CAS; (e) Z. J. Zhuang, X. D. Su, H. Y. Yuan, Q. Sun, D. Xiao and M. M. F. Choi, Analyst, 2008, 133, 126–132 RSC; (f) J. S. Ye, Y. Wen, W. D. Zhang, L. M. Gan, G. Q. Xu and F. S. Sheu, Electrochem. Commun., 2004, 6, 66–70 CrossRef CAS.
- (a) J. H. Yuan, K. Wang and X. H. Xia, Adv. Funct. Mater., 2005, 15, 803–809 CrossRef CAS; (b) S. Cherevko and C. H. Chung, Sens. Actuators, B, 2009, 142, 216–223 CrossRef CAS; (c) G. F. Wang, Y. Wei, W. Zhang, X. J. Zhang, B. Fang and L. Wang, Microchim. Acta, 2010, 168, 87–92 CrossRef CAS.
- (a) S. Park, H. Boo and T. D. Chung, Anal. Chim. Acta, 2006, 556, 46–57 CrossRef CAS PubMed; (b) L. Ozcan, Y. Sahin and H. Turk, Biosens. Bioelectron., 2008, 24, 512–517 CrossRef CAS PubMed.
- (a) T. G. S. Babu and T. Ramachandran, Electrochim. Acta, 2010, 55, 1612–1618 CrossRef CAS; (b) Y. B. Vassilyev, O. A. Khazova and N. N. Nikolaeva, J. Electroanal. Chem., 1985, 196, 105–125 CrossRef.
- (a) A. Vlandas, T. Kurkina, A. Ahmad, K. Kern and K. Balasubramanian, Anal. Chem., 2010, 82, 6090–6097 CrossRef CAS PubMed; (b) T. D. James, M. D. Phillips and S. Shinkai, Boronic Acids in Saccharide Recognition, Royal Society of Chemistry, Cambridge, 2006 Search PubMed.
- (a) J. P. Lorand and J. O. Edwards, J. Org. Chem., 1959, 24, 769–774 CrossRef CAS; (b) R. Nishiyabu, Y. Kubo, T. D. James and J. S. Fossey, Chem. Commun., 2011, 47, 1106–1123 RSC; (c) R. Nishiyabu, Y. Kubo, T. D. James and J. S. Fossey, Chem. Commun., 2011, 47, 1124–1150 RSC; (d) S. D. Bull, M. G. Davidson, J. M. H. van den Elsen, J. S. Fossey, A. T. A. Jenkins, Y.-B. Jiang, Y. Kubo, F. Marken, K. Sakurai, J. Zhao and T. D. James, Acc. Chem. Res., 2013, 46, 312–326 CrossRef CAS PubMed; (e) J. S. Fossey, F. D'Hooge, J. M. H. van den Elsen, M. P. P. Morais, S. I. Pascu, S. D. Bull, F. Marken, A. T. A. Jenkins, Y. B. Jiang and T. D. James, Chem. Rec., 2012, 12, 464–478 CrossRef CAS PubMed.
- (a) H. Fang, G. Kaur and B. Wang, J. Fluoresc., 2004, 14, 481–489 CrossRef CAS PubMed; (b) J. C. Pickup, F. Hussain, N. D. Evans, O. J. Rolinski and D. J. S. Birch, Biosens. Bioelectron., 2005, 20, 2555–2565 CrossRef CAS PubMed; (c) Y.-J. Huang, W.-J. Ouyang, X. Wu, Z. Li, J. S. Fossey, T. D. James and Y.-B. Jiang, J. Am. Chem. Soc., 2013, 135, 1700–1703 CrossRef CAS PubMed; (d) D. K. Scrafton, J. E. Taylor, M. F. Mahon, J. S. Fossey and T. D. James, J. Org. Chem., 2008, 73, 2871–2874 CrossRef CAS PubMed; (e) F. D'Hooge, S. A. Elfeky, S. E. Flower, S. I. Pascu, A. T. A. Jenkins, J. M. van den Elsen, T. D. James and J. S. Fossey, RSC Adv., 2012, 2, 3274–3280 RSC.
- (a) T. A. Schuller, M. Kuball, S. E. Flower, T. D. James, J. S. Fossey, D. Marcon, J. Das, S. Degroot, M. Germain and A. Sarua, Sens. Actuators, B, 2011, 160, 1078–1081 CrossRef CAS; (b) S. A. Elfeky, F. D'Hooge, L. Poncel, W. B. Chen, S. P. Perera, J. M. H. van den Elsen, T. D. James, A. T. A. Jenkins, P. J. Cameron and J. S. Fossey, New J. Chem., 2009, 33, 1466–1469 RSC.
- (a) N. Katif, R. A. Harries, A. M. Kelly, J. S. Fossey, T. D. James and F. Marken, J. Solid State Electrochem., 2009, 13, 1475–1482 CrossRef CAS; (b) S. Arimori, S. Ushiroda, L. M. Peter, A. T. A. Jenkins and T. D. James, Chem. Commun., 2002, 2368–2369 RSC; (c) E. Shoji and M. S. Freund, J. Am. Chem. Soc., 2001, 123, 3383–3384 CrossRef CAS PubMed.
- R. J. Pei, Z. L. Cheng, E. K. Wang and X. R. Yang, Biosens. Bioelectron., 2001, 16, 355–361 CrossRef CAS PubMed.
- G. Horvai, E. Gráf, K. Tóth, E. Pungor and R. P. Buck, Anal. Chem., 1986, 58, 2735–2740 CrossRef CAS.
- (a) B. Pejcic and R. De Marco, Electrochim. Acta, 2006, 51, 6217–6229 CrossRef CAS; (b) R. Pauliukaite, M. E. Ghica, O. Fatibello-Filho and C. M. A. Brett, Electrochim. Acta, 2010, 55, 6239–6247 CrossRef CAS.
- R. K. Shervedani and S. A. Mozaffari, Surf. Coat. Technol., 2005, 198, 123–128 CrossRef CAS.
- E. Katz and I. Willner, J. Am. Chem. Soc., 2002, 124, 10290–10291 CrossRef CAS PubMed.
- A. Stephenson-Brown, H.-C. Wang, P. Iqbal, J. A. Preece, Y.-T. Long, J. S. Fossey, T. D. James and P. M. Mendes, Analyst, 2013 10.1039/c3an01233f.
- J. J. Harris and M. L. Bruening, Langmuir, 2000, 16, 2006–2013 CrossRef CAS.
- (a) A. B. Kharitonov, L. Alfonta, E. Katz and I. Willner, J. Electroanal. Chem., 2000, 487, 133–141 CrossRef CAS; (b) B. Rezaei, T. Khayamian, N. Majidi and H. Rahmani, Biosens. Bioelectron., 2009, 25, 395–399 CrossRef CAS PubMed.
- C. R. Cooper and T. D. James, J. Chem. Soc., Perkin Trans. 1, 2000, 963–969 RSC.
Footnotes |
| † Electronic supplementary information (ESI) available: General and experimental procedures, mathematical model details, further discussion related to higher than anticipated sensitivity and spectra. See DOI: 10.1039/c3an01234d |
| ‡ Dedicated to Professor Seiji Shinkai to celebrate his 70th birthday. |
| This journal is © The Royal Society of Chemistry 2013 |
