
 Open Access Article
 This Open Access Article is licensed under a Creative Commons Attribution-Non Commercial 3.0 Unported Licence
A simple strategy for measuring the genuine resonance Raman optical activity (RROA) of nonpolar molecules†
Joanna
Mazurkiewicz
 ab,
Aleksandra
Orlef
a,
Tomasz
Misiaszek
c,
Tomasz K.
Olszewski
c and
Agnieszka
Kaczor
*a
ab,
Aleksandra
Orlef
a,
Tomasz
Misiaszek
c,
Tomasz K.
Olszewski
c and
Agnieszka
Kaczor
*a
aFaculty of Chemistry, Jagiellonian University, 2 Gronostajowa Str., 30-387 Krakow, Poland. E-mail: agnieszka.kaczor@uj.edu.pl
bDoctoral School of Exact and Natural Sciences, Jagiellonian University, 11 Lojasiewicza Str., 30-348 Krakow, Poland
cDepartment of Physical and Quantum Chemistry, Faculty of Chemistry, Wroclaw University of Science and Technology, Wybrzeże Wyspiańskiego 27 Str., 50-370, Wroclaw, Poland
First published on 25th March 2025
Abstract
Resonance Raman optical activity (RROA) enables increasing very-low analytical sensitivity of ROA, essential for its applications in biomedicine. Since discovery of the ECD-Raman effect, there is discussion if RROA is measurable. Here, we present a straightforward strategy for registration of RROA of nonpolar compounds based on their encapsulation in micelles, enabling nearly complete elimination of the ECD-Raman contribution.
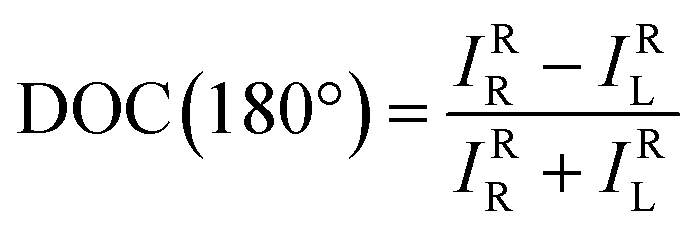
ROA is a method that seems to be cut out for analysis of biological systems, due to its remarkable sensitivity to the stereostructure combined with the capability for measurements in aqueous solutions. Yet, low analytical sensitivity of ROA, caused by the weakness of the ROA signal (typically 10−3–10−4 of the Raman intensity), currently makes its true biological and medical applications practically impossible. Therefore, scientists have been exploring different techniques of signal enhancement, including resonance (RROA),1–5 aggregation-induced resonance (AIRROA),6–10 exciton-coupling,11 nonlinear phenomena (CARS-ROA),12–14 or surface enhancement (SEROA),15–18 summarized in the recent reviews.19,20 RROA is a simple, hence convenient, approach, as it only requires coupling of the laser excitation energy with the energy of the electronic excitation (in analogy to Raman resonance). Additionally, the theory of RROA is developed.21 As typically ROA excitation in the visible range is used, many of the candidates for the potential RROA are nonpolar, metal-containing molecules/supramolecules. However, RROA measurements of such systems are complicated due to the recently discovered ECD-Raman (eCP-Raman) effect22,23 where ECD or e denotes electronic circular dichroism and CP – circularly polarized. It caused a stir in the scientific community, as it initially cast doubt on the possibility of measuring genuine RROA and questioned the previously published RROA results. The ECD-Raman phenomenon is caused by the ECD undergoing in the ROA cuvette in combination with polarized Raman scattering (of both the solute and the solvent).22,23 The polarized Raman scattering is related with the degree of circularity (DOC) defined for backscattering:
as the difference in the co-rotating and Raman spectrum (IRR − IRL) spectrum divided by their sum (IRR + IRL)24,25 and related with the polarizability changes during vibrational transitions (superscripts and subscripts refer to polarization of the incident and scattered light, respectively).22,23 The effect is particularly problematic for nonpolar solvents for which DOC values are large. In such cases, ECD-Raman can completely obscure native RROA. Currently, it is known that the effect can be minimized in polar solvents (characterized by low DOC values) and when short path lengths are used (to reduce the ECD influence).26 Additionally, an experimental protocol for subtracting ECD-Raman was proposed, however it is rather elaborate.27 The effect is also negligible for systems generating very intense natural RROA.8 Yet, the pool of non-polar, often metal-containing compounds producing weak-to-medium resonance conditions is significant. We have realized that for such compounds a simple idea is their encapsulation in micelles enabling registration of the ECD-Raman-free, i.e., the genuine RROA signal in the aqueous environment. In this work, we prove that such approach works, eliminating the ECD-Raman contribution from both the solute and the solvent.
For evaluation of the effectiveness of our concept, we used R,R and S,S enantiomers of the Ni-complex: ((R,R)-bis(pyrrol-2-ylmethyleneamine)-cyclohexane nickel(II), Fig. 1) that was studied in the original works on ECD-Raman,22,23 so is a valid reference point. Ni-complex is highly nonpolar and does not (even in trace amounts) dissolve in water. Ni-complex has a weak ECD in the 532–595 nm range (i.e., the ROA range of 0–2000 cm−1 for the 532 nm excitation), so it generates a significant ECD-Raman effect. The ECD-Raman effect (denoted here as IR − IL in accordance with the previously introduced convention) can be predicted according to the following equation:22,23

 | ||
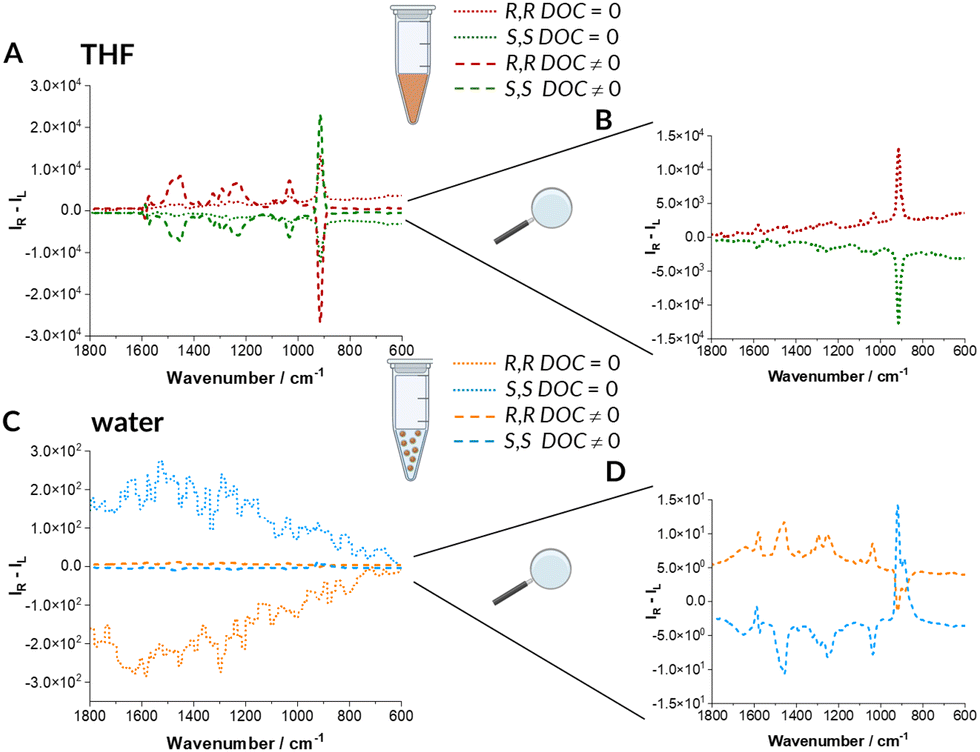
| Fig. 1 Significant ECD-Raman effect for Ni-complex in THF. Experimental: ECD (A) and (B), DOC (C), resonance Raman (D) ‘ECD-Raman/RROA’ (E) and calculated ECD-Raman (F) spectra of R,R and S,S enantiomers of Ni-complex dissolved in THF ((A): c = 0.0030 mol L−1, (B): c = 0.0003 mol L−1, (C)–(E): c = 0.0200 mol L−1). DOC, resonance Raman and ‘ECD-Raman/RROA’ spectra are presented as recorded, without any manipulations, ECD spectra were submitted to the necessary procedure of solvent subtraction only. The structure of R,R enantiomer of Ni-complex is shown. Electronic absorption spectra in Fig. S4A and B (ESI†). The Raman spectrum of THF is provided in Fig. S5 (ESI†). | ||
Firstly, we considered the Ni-complex in a nonpolar solvent to assess the precision of our DOC measurements and refer to the previous works.22,23R,R and S,S enantiomers of Ni-complex were synthesized according to the known procedure28 and their structures were confirmed by NMR (Experimental details in, ESI,† spectra in Fig. S1). Experimental ECD, DOC, Raman and ‘ECD-Raman/RROA’ (i.e., the spectra registered in ROA spectrometer in the resonance conditions, resulting from both the ECD-Raman and RROA contributions) as well as predicted ECD-Raman spectra for the Ni-complex in tetrahydrofuran (THF) are given in Fig. 1A–F. The respective spectra of S,S and R,R enantiomers are perfect mirror images both for all experimental spectra and for predicted ECD-Raman spectra. In agreement with the previous works where the solvents were chloroform and dichloromethane, ECD bands of the Ni-complex in THF are weak (also refer to Fig. S2 and S3, ESI†). ‘ECD-Raman/ROA’ spectra contain mostly bands from the achiral solvent (most intense denoted by the asterisk and blue colour in Fig. 1F) and a few signals due to the solute, in particular bands at 1586 or 1092 cm−1, (denoted in black in Fig. 1F). The predicted ECD-Raman spectra confirm indisputably that these bands originate primarily from the ECD-Raman effect, with only a very small contribution from the natural RROA.
The essential aim of the work was to eliminate the ECD-Raman contribution, and to do so we have encapsulated the Ni-complex in micelles formed by Pluronic F-127, a copolymer built from poly(ethylene oxide)(PEO)-poly (propylene oxide)(PPO)-poly(ethylene oxide)(PEO). In the aqueous solutions, Pluronic F-127 forms reversed micelles with the hydrophilic PEO groups directed outwards and the hydrophobic PPO core inwards (Fig. 2), creating space that can accommodate the hydrophobic Ni-complex molecules. The experimental ECD, DOC, Raman and RROA spectra together with the predicted ECD-Raman spectra for the Ni-complex encapsulated in micelles are shown in Fig. 2A–F. Although in ROA measurements the concentration of Ni-complex in nanostructures (c = 0.0012 mol L−1) is 20 times lower than for the Ni-complex in THF (c = 0.0200 mol L−1), the RROA spectra are clearly pronounced. No induced ROA signal of THF embedded in micelles or empty micelles themselves is observed, in agreement with the low-intensity Raman bands of micelles in the conditions of the experiment (Fig. S5, ESI†).
 | ||
| Fig. 2 Genuine RROA of Ni-complex encapsulated in micelles. Experimental: ECD (A) and (B), DOC (C), Raman (D) RROA (E) and calculated ECD-Raman (F) spectra of R,R and S,S enantiomers of Ni-complex encapsulated in Pluronic-127 micelles ((A)–(E): c = 0.0012 mol L−1). DOC, resonance Raman and RROA spectra are presented as recorded, without any manipulations, ECD spectra were submitted to the necessary procedure of solvent subtraction only. The structure of R,R enantiomer of Ni-complex is shown. Electronic absorption spectra in Fig. S4C and D (ESI†). The Raman spectrum of empty micelles with the addition of THF (trace amount) is provided in Fig. S5 (ESI†). Ni-complex is stable in nanocarriers as shown in Fig. S6 (ESI†). | ||
The natural RROA provenience is confirmed by a very weak DOC signal (as expected for the aqueous solution with a minor, in this case 6%, THF content) and the predicted ECD-Raman spectra close to zero. The CID (the ratio of ROA to Raman intensity, Table S1 and Fig. S7, ESI†) is between 3 × 10⁻⁴ and 1 × 10⁻³ indicating weak enhancement (as expected) and resonance via more than one excited state as otherwise, according to the single electronic state (SES) resonance theory,21 CID should be equal for all the bands. Overall, this is a very encouraging result showing that even for ‘difficult cases’ of near resonance conditions and low analyte concentrations (Fig. 2E and Fig. S8, ESI†) the ECD-Raman effect can be entirely eliminated by a simple and straightforward strategy of encapsulation of a studied hydrophobic analyte in micelles. Overall, such an approach reduces the value of the ECD-Raman by nearly two orders of magnitude.
Finally, we asked ourselves what is the contribution of polarized Raman scattering in the ECD-Raman effect observed for the Ni-complexes in THF and the micelle environment. Analyzing this factor can let us evaluate the impact of DOC on the overall ECD-Raman effect and therefore also the effectiveness of our strategy that is mostly based on minimizing DOC values. To answer this question, we separated two terms from the formula for the ECD-Raman effect, as shown below:

The second term of the equation shows the polarized Raman scattering contribution (magnified by the ECD intensity via Δε) from both the solvent and the solute and is graphically separated for the Ni-complex in THF (Fig. 3A) and encapsulated in micelles (Fig. 3B). For the Ni-complex in THF where the ECD-Raman is significant, the DOC-related factor is considerably more pronounced than the Δε′-dependent first term of the equation. The importance of DOC-related factor has been noticed in the original work explaining the origin of the ECD-Raman effect.23
 | ||
| Fig. 3 The contribution of Δ ε ′ and DOC-dependent terms in the ECD-Raman effect for Ni-complex in THF (A) and (B) and in micelles (C) and (D). The Δε′-dependent term denoted by dotted lines. The solvent and DOC-dependent term denoted by dashed lines. | ||
Contrarily, in the aqueous environment with 6% of THF, the term related to the DOC factor is extremely small and practically negligible compared with the RROA signal as shown by the lack of even a trace intensity of the most intense ECD-Raman band at ca. 915 cm−1 in the experimental RROA spectra (Fig. 2E). In this case, the Δε′-dependent term is more important, however is can mostly impact the baseline.
Although ECD-Raman can be perceived as a new type of chiral spectroscopy29 and some applications of this effect have been already demonstrated,30 it is usually an undesirable phenomenon obscuring the RROA signal. The ECD-Raman effect is particularly significant for nonpolar solutions, where polarized Raman scattering is significant. So, it is substantial for a broad range of nonpolar molecules, often metal complexes, that provide ECD bands in the visible range and hence result in resonantly enhanced RROA if excited with the visible light. The polarized Raman scattering of both the solvent and the solute is a predominant contribution to the ECD-Raman effect via DOC. Therefore, we have developed a simple strategy to measure of genuine RROA of nonpolar compounds based on minimizing DOC factor achieved by the change of the solvent. Practically it was realized through encapsulation of the nonpolar metal complex in reversed micelles. Such approach enabled nearly complete elimination of the ECD-Raman contribution of both the solvent and the solute. Taking into account the wide range of micelle types, the proposed strategy is universal and can be applied to a variety of structurally different systems.
Conceptualization: AK, methodology: JM, AO, TM, TO, AK, validation: JM, formal analysis: JM, TM, TO, investigation: JM, AO, TM, TO, writing – original draft: AK, writing: – review & editing: JM, AO, TM, TO, visualization: JM, TM, TO supervision: AK, project administration: AK funding acquisition: AK.
This publication has been funded by the National Science Centre, Poland: OPUS 19 (project no. 2020/37/B/ST4/01168 to A. K.). The open-access publication of this article has been supported by a grant from the Faculty of Chemistry under the Strategic Programme Excellence Initiative at Jagiellonian University. We thank Larry Nafie, Kim Quinn and Rina Dukor for discussions regarding the DOC measurements and Darek Marek for constant help in aligning the ROA system. Franciszek Włodek is acknowledged for the assistance in the preliminary experiments. The study was carried out using research infrastructure funded by the European Union in the framework of the Smart Growth Operational Programme, Measure 4.2; Grant No. POIR.04.02.00-00-D001/20, “ATOMIN 2.0 – Center for materials research on ATOMic scale for the INnovative economy”.
Data availability
Detailed description of experimental methods as well as additional spectra are provided in ESI.†Conflicts of interest
There are no conflicts to declare.Notes and references
- S. Haraguchi, M. Hara, T. Shingae, M. Kumauchi, W. D. Hoff and M. Unno, Angew. Chem., Int. Ed., 2015, 54, 11555–11558 CAS.
- S. Haraguchi, T. Shingae, T. Fujisawa, N. Kasai, M. Kumauchi, T. Hanamoto, W. D. Hoff and M. Unno, Proc. Natl. Acad. Sci. U. S. A., 2018, 115, 8671–8675 CAS.
- E. Machalska, G. Zajac, A. Gruca, F. Zobi, M. Baranska and A. Kaczor, J. Phys. Chem. Lett., 2020, 11, 5037–5043 CrossRef CAS.
- J. Matsuo, T. Kikukawa, T. Fujisawa, W. D. Hoff and M. Unno, J. Phys. Chem. Lett., 2020, 11, 8579–8584 CrossRef CAS PubMed.
- C. Merten, H. Li and L. A. Nafie, J. Phys. Chem. A, 2012, 116, 7329–7336 CrossRef CAS PubMed.
- M. Dudek, E. Machalska, T. Oleszkiewicz, E. Grzebelus, R. Baranski, P. Szcześniak, J. Mlynarski, G. Zajac, A. Kaczor and M. Baranska, Angew. Chem., Int. Ed., 2019, 58, 8383–8388 CrossRef CAS.
- M. Dudek, G. Zajac, A. Kaczor and M. Baranska, J. Phys. Chem. B, 2016, 120, 7807–7814 CrossRef CAS.
- N. Hachlica, M. Stefańska, M. Mach, M. Kowalska, P. Wydro, A. Domagała, J. Kessler, G. Zając and A. Kaczor, Small, 2024, 20, 2306707 CrossRef CAS.
- A. Orlef, E. Stanek, K. Czamara, A. Wajda and A. Kaczor, Chem. Commun., 2022, 58, 9022–9025 RSC.
- G. Zajac, A. Kaczor, A. Pallares Zazo, J. Mlynarski, M. Dudek and M. Baranska, J. Phys. Chem. B, 2016, 120, 4028–4033 CrossRef CAS PubMed.
- A. Kolodziejczyk, L. A. Nafie, A. Wajda and A. Kaczor, Chem. Commun., 2023, 59, 10793–10796 RSC.
- K. Hiramatsu, H. Kano and T. Nagata, Opt. Express, 2013, 21, 13515–13521 CrossRef CAS.
- K. Hiramatsu, P. Leproux, V. Couderc, T. Nagata and H. Kano, Opt. Lett., 2015, 40, 4170–4173 CrossRef CAS PubMed.
- V. Kumar, T. Reichenauer, L. Supovec, D. Jansen, N. Brodt, G. Zając, A. Domagała, M. Barańska, J. Niemeyer and S. Schlücker, J. Raman Spectrosc., 2023, 54, 1011–1020 CrossRef CAS.
- S. Abdali and E. W. Blanch, Chem. Soc. Rev., 2008, 37, 980–992 RSC.
- E. Er, T. H. Chow, L. M. Liz-Marzán and N. A. Kotov, ACS Nano, 2024, 18, 12589–12597 CAS.
- S. G. Lee, S. Kwak, W. K. Son, S. Kim, K. T. Nam, H. Y. Lee and D. H. Jeong, Anal. Chem., 2024, 96, 9894–9900 CAS.
- S. Ostovar Pour, L. Rocks, K. Faulds, D. Graham, V. Parchaňský, P. Bouř and E. W. Blanch, Nat. Chem., 2015, 7, 591–596 CAS.
- A. Kaczor, Phys. Chem. Chem. Phys., 2023, 25, 19371–19379 CAS.
- C. R. Lightner, A. Kaczor and C. Johannessen, Vib. Spectrosc., 2024, 132 Search PubMed.
- L. A. Nafie, Chem. Phys., 1996, 205, 309–322 CAS.
- G. Li, M. Alshalalfeh, Y. Yang, J. R. Cheeseman, P. Bouř and Y. Xu, Angew. Chem., Int. Ed., 2021, 60, 22004–22009 CAS.
- T. Wu, G. Li, J. Kapitán, J. Kessler, Y. Xu and P. Bouř, Angew. Chem., Int. Ed., 2020, 59, 21895–21898 CAS.
- L. D. Barron, Molecular Light Scattering and Optical Activity, Cambridge University Press, Cambridge, 2004 Search PubMed.
- L. A. Nafie, Vibrational Optical Activity: Principles and Applications, John Wiley & Sons, 2011 Search PubMed.
- E. Machalska, G. Zajac, A. J. Wierzba, J. Kapitán, T. Andruniów, M. Spiegel, D. Gryko, P. Bouř and M. Baranska, Angew. Chem., Int. Ed., 2021, 60, 21205–21210 CAS.
- T. Wu, J. Kapitán and P. Bouř, J. Phys. Chem. Lett., 2022, 13, 3873–3877 CAS.
- X.-F. Shan, L.-Z. Wu, X.-Y. Liu, L.-P. Zhang and C.-H. Tung, Eur. J. Inorg. Chem., 2007, 3315–3319 CAS.
- G. Li, M. Alshalalfeh, J. Kapitán, P. Bouř and Y. Xu, Chem. – Eur. J., 2022, 28, e202104302 CrossRef CAS PubMed.
- E. Machalska, N. Hachlica, G. Zajac, D. Carraro, M. Baranska, G. Licini, P. Bouř, C. Zonta and A. Kaczor, Phys. Chem. Chem. Phys., 2021, 23, 23336–23340 RSC.
Footnote |
| † Electronic supplementary information (ESI) available: Experimental procedures, additional spectra and tables necessary for data analysis. See DOI: https://doi.org/10.1039/d5cc00879d |
| This journal is © The Royal Society of Chemistry 2025 |